HAL Id: inserm-01985990
https://www.hal.inserm.fr/inserm-01985990
Submitted on 18 Jan 2019
HAL is a multi-disciplinary open access
archive for the deposit and dissemination of
sci-entific research documents, whether they are
pub-lished or not. The documents may come from
teaching and research institutions in France or
abroad, or from public or private research centers.
L’archive ouverte pluridisciplinaire HAL, est
destinée au dépôt et à la diffusion de documents
scientifiques de niveau recherche, publiés ou non,
émanant des établissements d’enseignement et de
recherche français ou étrangers, des laboratoires
publics ou privés.
impedance model
Kankoé Sallah, Roch Giorgi, Linus Bengtsson, Xin Lu, Erik Wetter, Paul
Adrien, Stanislas Rebaudet, Renaud Piarroux, Jean Gaudart
To cite this version:
Kankoé Sallah, Roch Giorgi, Linus Bengtsson, Xin Lu, Erik Wetter, et al.. Mathematical
mod-els for predicting human mobility in the context of infectious disease spread: introducing the
impedance model. International Journal of Health Geographics, BioMed Central, 2017, 16 (1), pp.42.
�10.1186/s12942-017-0115-7�. �inserm-01985990�
RESEARCH
Mathematical models for predicting
human mobility in the context of infectious
disease spread: introducing the impedance
model
Kankoé Sallah
1,2*, Roch Giorgi
1,3, Linus Bengtsson
4,5, Xin Lu
4,5,6, Erik Wetter
5,7, Paul Adrien
8,
Stanislas Rebaudet
9, Renaud Piarroux
10and Jean Gaudart
1,3Abstract
Background: Mathematical models of human mobility have demonstrated a great potential for infectious disease epidemiology in contexts of data scarcity. While the commonly used gravity model involves parameter tuning and is thus difficult to implement without reference data, the more recent radiation model based on population densi-ties is parameter-free, but biased. In this study we introduce the new impedance model, by analogy with electricity. Previous research has compared models on the basis of a few specific available spatial patterns. In this study, we use a systematic simulation-based approach to assess the performances.
Methods: Five hundred spatial patterns were generated using various area sizes and location coordinates. Model performances were evaluated based on these patterns. For simulated data, comparison measures were average root mean square error (aRMSE) and bias criteria. Modeling of the 2010 Haiti cholera epidemic with a basic susceptible– infected–recovered (SIR) framework allowed an empirical evaluation through assessing the goodness-of-fit of the observed epidemic curve.
Results: The new, parameter-free impedance model outperformed previous models on simulated data according to average aRMSE and bias criteria. The impedance model achieved better performances with heterogeneous popula-tion densities and small destinapopula-tion populapopula-tions. As a proof of concept, the basic compartmental SIR framework was used to confirm the results obtained with the impedance model in predicting the spread of cholera in Haiti in 2010. Conclusions: The proposed new impedance model provides accurate estimations of human mobility, especially when the population distribution is highly heterogeneous. This model can therefore help to achieve more accurate predictions of disease spread in the context of an epidemic.
Keywords: Human mobility, Disease spread, Impedance model, Spatial statistics, Epidemiology, Radiation model, Gravity model
© The Author(s) 2017. This article is distributed under the terms of the Creative Commons Attribution 4.0 International License (http://creativecommons.org/licenses/by/4.0/), which permits unrestricted use, distribution, and reproduction in any medium, provided you give appropriate credit to the original author(s) and the source, provide a link to the Creative Commons license, and indicate if changes were made. The Creative Commons Public Domain Dedication waiver (http://creativecommons.org/ publicdomain/zero/1.0/) applies to the data made available in this article, unless otherwise stated.
Background
Epidemic spread depends on the likelihood of infection, as well as on individual human interactions. Concern-ing the latter, mobility networks play a huge role in the
temporal and spatial dynamics of disease transmission within a population [1].
If mobility networks cannot be provided, reaction dif-fusion models can roughly report on the epidemic spread [2]. In the last decade, there has been a growing interest among infectious disease epidemiologists in estimat-ing human mobility and rebuild mobility networks [3]. While mathematical models of human mobility have been in use since the last century, they are of less value
Open Access
*Correspondence: [email protected]
1 INSERM, IRD, SESSTIM, Sciences Economiques & Sociales de la Santé & Traitement de l’Information Médicale, Aix Marseille Univ, Marseille, France Full list of author information is available at the end of the article
when real mobility data or reliable proxies—such as the call detail records (CDRs) of mobile network operators— are available [4]. The usefulness of these models appears in data-scarce contexts, such as during infectious disease epidemics in low-income countries, when forecasting the best possible allocation of resources becomes necessary. Indeed, these models can predict mobility patterns based solely on population size, population density, and travel distance.
The gravity and radiation models are the most com-monly used mobility models today. The gravity model posits that mobility between two locations increases with population size and decreases with distance [5], whereas the radiation model assumes mobility to depend on population density [6]. Insofar as it relies on parameter tuning, the gravity model provides a broad theoretical framework that is pragmatically useless in the absence of specific space-dependent fitting [7]. As for the radiation model, it merely serves to predict the relative probabil-ity of mobilprobabil-ity from a given location to different desti-nations—though it can help deduce absolute number of trips, provided that the average number of trips from each source location is known or approximated. In short, in data-scarce contexts such as in low-income countries, mathematical models of human mobility can only be used with minimal assumptions about the overall prob-ability of mobility in the population.
The aim of this study was to introduce a new, param-eter-free model, the impedance model, for predicting human mobility in the context of data scarcity.
In this article, we define the mobility models, translate them into formulations that allow for rigorous compari-son, simulate a set of spatial patterns linked to various scenarios, and then compare the performance of the new impedance model, intuitively adapted from the laws of electricity, to previous well known models, for each simulated pattern. Lastly, we evaluate the performance of each of these models in predicting a real infectious dis-ease spread, namely the 2010 cholera epidemic in Haiti.
Methods
Definitions
The impedance model
In order to estimate probabilities of mobility in data-scarce contexts, we proposed an intuitive and parameter-free model adapted from Ohm’s law of electricity (1827). We developed this model by simple analogy with the electric current model, where electric potential is repre-sented by P = I × R, R is the electric resistance, and I is the electric current (charge per unit of time). In a human mobility model, electric resistance is assimilated to dis-tance (d), electric current to number of trips per day (Fij), and electric potential to mobility potential per day
on a given trajectory. The latter depends on the overall probability of mobility α applied to the size of the source and destination populations. It can be formulated as α Pi+ Pj .
Thus, according to the impedance model, the number of trips flow from i to j can be formulated as Fij = αPid+Pij j.
The probability for a person in location i to travel from
i to j is given by
This formula is parameter-free.
The previously known mobility models have also been developed by analogy with the laws of physical science. Among these, some have been pragmatically successful, and have thus become especially popular.
The gravity model
The gravity model estimates the number of trips Fij,
between two geographical locations i and j, knowing their population sizes Pi and Pj and the distance between
them, dij, as
To allow rigorous comparisons, the formulation was adapted. See Additional file 1: A1
The radiation model
The radiation model was developed by analogy with the processes of emission and absorption of electromagnetic particles studied by physical scientists. The probability of commuting from i to j is given by
More details on radiation model are given in Additional file 1: A2
Simulations
Data generation
In order to assess the performance of our proposed model in plausible epidemiological situations, we gen-erated data to build spatial patterns that could stand for real epidemic spaces. Location coordinates were gener-ated using the double-uniform distribution. Each spatial pattern formed a square whose sides spanned between 1° and 40° in a polar coordinate system, and included a limited number of locations representing different demographic units. The area of each generated pattern varied approximately from 12,100 km2 (roughly the size (1) πij= Fij Ti = αPid+Pj ij i�=j αPid+Pj ij = Pi+Pj dij i�=j P i+Pj dij (2) Fij= k PinPjm fγ(dij) (3) πij= PiPj Pi+ Sij Pi+ Pj+ Sij
of Gambia or Lebanon) to 19,360,000 km2 (roughly the
size of Russia or North America). The number of gener-ated locations in each spatial pattern varied randomly from 5 to 30. Each pattern reflected population densities that can be plausibly observed by demographers (100– 10,000 inhabitants/km2). Two topological rules were
applied to create plausible patterns: (1) each pattern had to include at least 10 km between locations of more than 100,000 inhabitants; and (2) the size of the population generated for each pattern had to be proportional to the pattern area.
Our aim was to account for geographical scale and to avoid the inconsistencies that come with considering huge populations in small areas (e.g., locations with more than 10,000,000 inhabitants in Gambia) or with examin-ing very small populations in large areas (e.g., accountexamin-ing for villages with small populations when studying disease spread throughout Russia).
The double-uniform distribution was used to gener-ate population sizes. Population size heterogeneity was controlled by varying the gap between the two uniform distributions. In sensitivity analyses, the hypothesis used to generate population sizes was modified with a Pois-son distribution, a double PoisPois-son distribution, a normal distribution, and a truncated normal distribution. The regular grid pattern was also assessed to estimate result variability due to travel distances.
Simulation design
Reference data were needed to evaluate the performance of the three models on simulated patterns. In the absence of real mobility data or reliable proxies, we had to make assumptions to generate reference mobility data. Several scenarios were proposed, all of which had as a prerequi-site a power deterrence function.
The first scenario—the source population and distance deterrence (SPDD)—assumed that the probability of mobility from source i to destination j decreased with the distance between i and j and was proportional to the size of the source population.
The second scenario—the small to large population with distance deterrence (SLDD)— assumed that the probability of mobility on a given trajectory was propor-tional to the destination/source population size ratio and inversely proportional to distance.
The third scenario—large to small population with dis-tance deterrence (LSDD)—assumed that the probability
(4) πij∝ Pi× 1 dij (5) πij∝ Pj Pi × 1 dij
of mobility was proportional to the destination/source population size ratio, while retaining the power deter-rence function.
The total number of trips from location i (Ti) depended
on the overall probability of mobility (α) and on the size of the source population (Pi) (Eq. 8). The expected
num-ber of trips on a given trajectory ij (Fij) followed a Poisson
distribution (P), whose average depended on the prob-ability of mobility from location i to destination j (πij) and
on the total number of trips from location i (Eq. 8).
where P represented a Poisson distribution.
Number of simulations
The parameter to be estimated, α, was the overall prob-ability of mobility in the population. Probabilities of mobility estimated from various CDRs ranged from 1 to 5% (France, 2007: 0.026 [8], Kenya, 2012: 0.026 [9], Haiti, 2010: 0.035 [10], Spain, 2007: 0.011 [8], United States, 2011: 0.022 [6]). We used the range’s maximum value (5%) in the data generation process to approximate the worst-case conditions for infectious disease spread.
The epidemiological literature on disease spread does not provide recommendations on the threshold propor-tion of infected individuals that needs to be detected to avoid disease propagation. Obviously, this number depends on specific spatiotemporal patterns. Neverthe-less, for methodological reasons, we assumed that a 1% error (Δ) in the estimated overall probability of mobil-ity has significant consequences for emergency plan-ning. This means that surveillance systems should be able to detect a variation in the overall daily probability of mobility corresponding to 100 persons moving from a small town of 10,000 inhabitants or to 100,000 persons moving from a huge agglomeration of about 10,000,000 inhabitants such as Paris. Assuming the maximum over-all probability of mobility to be 10%, the maximum vari-ance in the probability of mobility is σ2 = 0.1 * 0.1 = 0.01.
According to simulation guidelines [11], the number of simulations needed to detect significant difference in the overall probability of mobility estimated by various mod-els is given by (6) πij∝ Pi Pj × 1 dij (7) Ti= α × Pi (8) Fij∼ P(πij× Ti) (9) N = Z1−(α/2)σ � 2 = 1.96 × 0.1 0.01 2 = 385 for α = 5% significance level
For each scenario, we performed 500 independent simulations. The same spatial patterns were used to com-pare the three mobility models so that bias due to sample variability was eliminated while assessing the differences between the models.
Measures of performance
Statistical measures of performance were: overall prob-ability of mobility ˆα; bias in the probprob-ability of mobility (δ); and average root mean square error (aRMSE) in number of trips.
The overall probability of mobility ˆα estimated by the model for a given pattern was defined as the percentage of travelers in the pattern’s population. This parameter can reveal over/underestimations of the overall probabil-ity of mobilprobabil-ity, and is equal to
where Fij is the number of trips on each ij trajectory
esti-mated by the model for a given pattern, and Pi is the size
of the population in the source location n of that pattern. The bias δ associated with each model was defined as δ = ¯ˆα − α0, where ˆα is the overall probability of
mobil-ity estimated from a single simulation, ¯ˆα is the average rate over a set of N simulations, and α0 is the value of the
overall probability of mobility used for data generation. The aRMSE in number of trips estimates was com-puted for each mathematical model as the average of root mean square errors over a set of N simulations.
where Fmodel and Fref are the numbers of trips on a given
trajectory—as estimated with model and reference data, respectively—n is the total number of trajectories in a given pattern, and N is the number of simulations for which the measure was computed.
Modeling mobility patterns in the 2010 cholera spread in Haiti with a basic susceptible–infected–recovered (SIR) transmission framework
As a proof of concept, we used the data routinely col-lected during the first weeks of the cholera epidemic in Haiti by the Ministry of Public Health and Population. These data have already been used for the epidemiologi-cal analysis of the first year of the epidemic [12]. This epi-demic, of exceptional magnitude, struck Haiti in October 2010, following the massive contamination of the Artibo-nite River after cholera was introduced in the country by a military contingent [13]. (10) ˆ α = i�=jFij n i=1Pi (11) aRMSE = average � � n(Fmodel− Fref)2 n
Briefly, morbidity data were prospectively collected at the commune level according to the World Health Organization standard definition [14].
In the current study we only analyzed data from October 27, 2010 to December 27, 2010, correspond-ing to the expansion phase of the epidemic, discardcorrespond-ing the first 2 weeks a period when cholera transmission was related to the massive contamination of the river rather than a human-driven diffusion [13]. These early stages of the epidemic were modeled using a basic SIR framework.
We used two spatial definitions (n = 140 and n = 78 locations): The first corresponded to municipalities, and the second to agglomerations connected by a human mobility network [4]. The set of differential equations below represents the dynamics of transmission in each location i. The overall population was assumed to be at demographic equilibrium, with the birth rate balancing the mortality rate; it was also assumed to be not immune in the early stages of the epidemic.
The equations above represent the weekly variations in the number of individuals in the susceptible (Si), infected
(Ii) and recovered (Ri) compartments at location i. β
rep-resents the rate of exposure to the disease—i.e., the rate of individuals becoming infected due to exposure to the effective incidence of cholera. The effective incidence of cholera in a location i, (1 − α)Ii(t) + α j�=iπijIj(t) was
modeled as a weighted average of incidence rates in local and remote locations. Weights depended on the overall probability of mobility (α), but also on the relative prob-abilities of mobility from destination locations j to source location i which were provided by the matrices derived from CDRs or from the mathematical (impedance, grav-ity, radiation) models formulated in Eqs. 1, 3, and 4. γ is the recovery rate of the infected compartment. We evalu-ated mobility matrices under two hypotheses. The first made no assumption regarding specific overall probabili-ties of mobility from each location, allowing the rate α to be adjusted. The second assumed the overall probability of mobility from each location to be approximated by CDRs.
This CDRs mobility matrix resulted from the pro-cessing of cell phone network metadata of 2.9 million
(12) dSi dt = −βSi(t) (1 − α)Ii(t) + α � j�=i πijIj(t) dIi dt = βSi(t) (1 − α)Ii(t) + α � j�=i πijIj(t) − γ Ii dRi dt = γ Ii
subscribers of the largest mobile phone operator in Haiti called Digicel (60% market share). Voice call and written messages metadata were collected daily from October 15 to December 19, 2010 [4, 10, 15]. The fraction of Sub-scriber Identity Module Cards (SIM cards) on the total population in 2013 was 61%. The maximum distance between two pairs of telephone towers was 38.6 km. The trajectories of subscribers between the phone tow-ers made it possible to reconstitute the mobility net-work between geographical locations. For each pair of sites (i, j), the proportion of SIM cards in location i at time t, which were found at location j at time t + 1, was calculated.
To determine which model best describes the early stages of the cholera outbreak in Haiti, we compared the performances of the candidate models according to Akai-ke’s information criterion [16, 17] (AIC).
where θ is the number of estimated parameters in the model, and η = nu× nw is the number of data points
(with nu and nw being the number of spatial units and the
number of weeks since the start of the calibration period, respectively). The sum of the squares of the residuals between model estimates and epidemiological records is denoted by RSS.
where C(i, j) and ˆC i, j correspond to the weekly number of reported cases and to the number of cases estimated by the model in a spatial unit u and a week w, respectively.
Results
Simulation results
Average root mean square error (aRMSE)
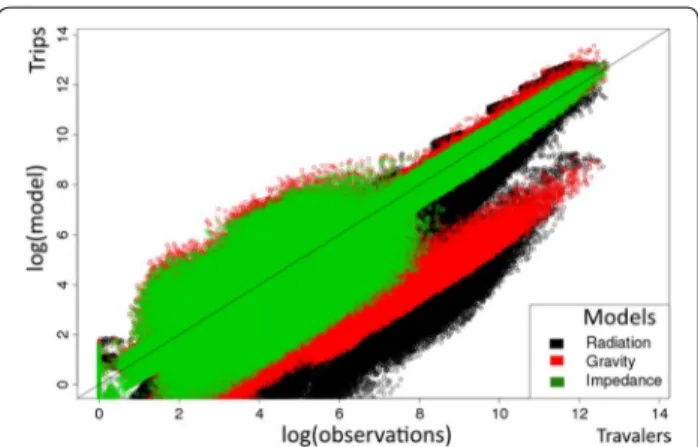
Estimates of absolute flows from all simulations and all scenarios are shown in Fig. 1. The average root mean square error was lower with the impedance model (log(aRMSE) = 7.19 CI (7.10–7.35)) as compared with the gravity and radiation models (log(aRMSE) = 7.44 CI (7.34–7.54) and 8.40 CI (7.91–8.67), respectively).
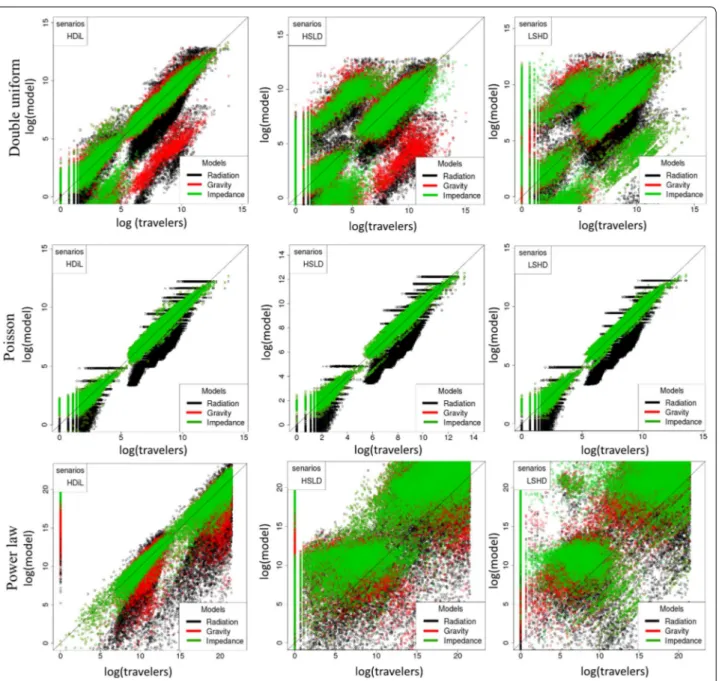
Similar tendencies were observed (both in aRMSE and bias) when using the grid distribution of locations, Pois-son distribution or a power law and whatever the spe-cific mobility scenarios: SPDD, LSDD or SLDD (Fig. 2). Assuming identical population sizes, the gravity and impedance models performed equally. Average error increased with area size. A hundred-fold increase in the standard deviation of population size (the coefficient of
(13) AIC =2θ + η ln RSS η (14) RSS = nu u nw w C(i, j) − ˆC(i, j) 2
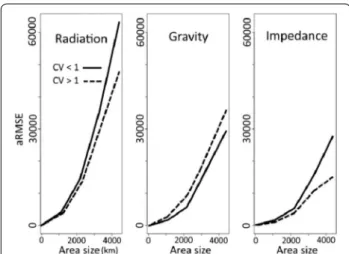
variation changing from 0.2 et 3) yielded a 5% aRMSE increase in the impedance model and 7 and 10% aRMSE decreases in the radiation and gravity models, respec-tively (Fig. 3). Thus, in heterogeneous settings, the impedance model produced the most accurate absolute flow estimates, as compared with older mathematical models.
Probabilities of mobility were estimated according to destination population, on the one hand, and according to travel distance, on the other. The predictions made with the impedance model were the closest to simulated data, regardless of population heterogeneity. When pre-dicting short-distance mobility and mobility to desti-nations with small populations, the impedance model outperformed the gravity and radiation models, espe-cially in the case of heterogeneous populations (Fig. 4).
Bias
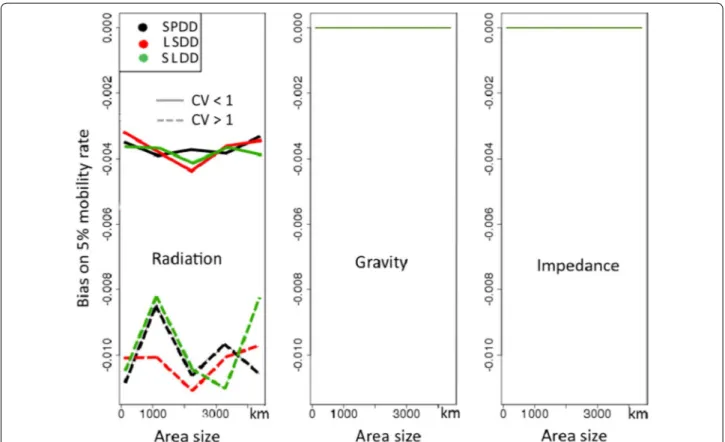
Bias in the 5% reference probability of mobility used to generate data is represented in Fig. 5 for various area sizes and for two levels of population heterogeneity.
The impedance and gravity models were unbiased regardless of the spatial pattern. The radiation model underestimated the overall probability of mobility. Bias was persistent regardless of the scenario and increased in the case of heterogeneous patterns: δ = − 0.0099 for heterogeneous populations versus − 0.0037 for homo-geneous ones. Bias persisted in the grid distribution of locations.
Likelihood of the mobility scenarios
Figure 6 summarizes the aRMSE estimates on the total number of trips in each scenario over five hundred
Fig. 1 Number of trips estimated by the three models versus
simu-lated reference data. Each dot represents the logarithm of the total number of trips on a given trajectory. The three simulation scenarios are combined for each model
simulated patterns. The SPDD scenario yielded the low-est aRMSE, making it a more plausible hypothesis for modeling human mobility (ANOVA test, p value = 0.03). Accuracy of the transmission model assuming various mobility patterns for the 2010 Haiti cholera epidemic Statistical dispersion measures comparing popula-tion heterogeneity for both spatial definipopula-tions are pre-sented below (Table 1). The coarse pattern (which includes 78 aggregated units) displays greater population heterogeneity.
Transmission parameters estimated with the Metropo-lis–Hastings Markov Chain Monte Carlo algorithm using a CDRs-based fine-scale mobility matrix (n = 140) are presented in Table 2.
CDRs data were used to calibrate the transmission parameters. These parameters were then entered in new models that lacked mobility patterns.
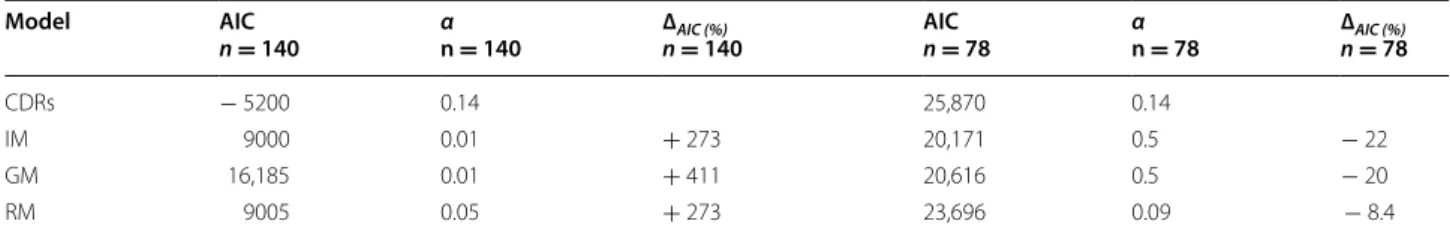
Table 3 shows the AIC results obtained with differ-ent mobility matrixes, assuming that the rate of mobil-ity from each location remains unknown. Both the matrix structure and the overall probability of mobility
Fig. 2 For each scenario separately, number of trips estimated by the three models versus simulated reference data. Number of simulations was
limited to 160. Each dot represents the logarithm of the total number of trips on a given trajectory. Power law was simulated by taking the square of a selected range values
were tested. Results are shown for both spatial defini-tions. The CDRs-based model was taken as a reference when computing AIC variations. The impedance model
performed well with heterogeneous spatial distributions, in which locations were defined as significant population agglomerations. Aggregated CDRs failed to fit the epide-miological data properly, even when using the most real-istic parameters obtained with the fine-scale definition (AIC = 25,870 with the coarse definition vs. − 5200 with the fine-scale definition). Using the coarse definition, the AIC decreased by 22% for the impedance model, by 20% for the gravity model, and by 8.4% for the radiation model.
Table 4 shows analogous results obtained by assuming that the overall probability of mobility (α) is provided by CDRs.
Additional file 1: B shows the sensitivity analysis asso-ciated with the results presented in Table 3. The latter correspond to the AIC variations that followed from vari-ations in mobility rates.
Discussion
In this article, we proposed a new, parameter-free and intuitive model for predicting human mobility in the con-text of data scarcity. We evaluated the performances of
Fig. 3 Variations in average root mean square error (aRMSE)
accord-ing to area size. Plain lines and dotted lines correspond to groups of patterns with coefficients of variation of population sizes (CV) below and above 1, respectively
Fig. 4 Probability of travel according to destination population, travel distance and population distributions. CV stands for the coefficient of
vari-ation of populvari-ation sizes. Panels a and b stand for homogeneous populvari-ation size (CV < 1) and panels c and d for heterogeneous populvari-ation size (CV > 1). Short-distance mobility and mobility to destinations with small destinations are best predicted in heterogeneous patterns with the imped-ance model
the impedance model through intensive simulation, and compared it to the (non parameter-free) gravity model and the (parameter-free) radiation model. Our results
suggest that when the number of trips from each loca-tion is known (as assumed in the radialoca-tion model and as extracted from CDRs), the impedance model provides the best equation for predicting the distribution of travel-ers towards destinations, in aggregated patterns.
The inclusion of reactive-diffusion equations in dynamic models of infectious disease transmission is a method of determining the spread of an epidemic in the absence of mobility data. This method assumes that the movements of all individuals are stochastic, happening by continuous progression throughout the geographical space and therefore, each individual can potentially visit all the geographical locations. Depending on the context, this assumption can be inaccurate [2], even if additional parameters may adapt the implications [18]. Recent works have shown that human mobility is better repre-sented by a specific spatial network [19–21]. Each Indi-vidual usually does not visit all the locations. This results in saturation in the rate of epidemic spread, whereas the classical diffusion hypothesis does not admit a limit to the diffusion speed when the mobility rate increases [2]. However, in the context of the Black Death outbreak model, Gaudart et al. [18] used a local viscosity param-eter proportional to the altitude and human density, thus
Fig. 5 Bias according to model, area size, population distributions and scenarios of simulation. CV stands for the coefficient of variation of
tion sizes. SPDD: source population and distance deterrence, LSDD: large to small population with distance deterrence, SLDD: small to large popula-tion with distance deterrence
Fig. 6 Average root mean square error over all simulations for each
scenario. The SPDD scenario appears to be the most plausible one with regard to simulated data
modeling the maximal diffusion velocity. This approach excluded low population density/mobility from the first wave of the epidemic.
Our study also uncovered the existence of intrinsic biases associated with CDRs, depending on the spatial definition used. In fact, we found that the most precious information that can be extracted from CDRs are the rates of mobility from the source location, not the prob-abilities of mobility to different destinations.
In addition, our study showed that the radiation model typically underestimates mobility, and can therefore yield inaccurate epidemiologic predictions, as has already
been suggested [9, 22–24]. Our stimulation approach was more systematic than those used in previous stud-ies, (including that of Masucci et al. [23]), as these have mainly relied on empirical data from specific countries.
We found that probability of mobility according to dis-tance and to size of destination population—as measured in several studies [6, 9]—is a pooled measure that may mask errors in core flow estimates. Estimates of the prob-ability of mobility beyond a given radius can be flawed because flows are pooled before probability is computed. In the context of infectious disease spread, raw flows are more relevant than average probabilities. Moreover, RMSE is a more relevant measure to assess the perfor-mance of mobility models in epidemiology because it is directly based on absolute number of trips. The most reli-able model is expected to yield the smallest RMSE.
The scenarios defined for data generation did not reveal anything specific. However, their formulation did help to account for a wide range of mobility hypotheses. The sec-ond scenario (SLDD) seemed to correspsec-ond to mobility patterns during peak periods of activity in both industri-alized and less industriindustri-alized countries, as well as to pat-terns of rural migration in less industrialized countries. The third scenario (LSDD) resembled mobility patterns in industrialized countries during holiday periods, as well as patterns of populations fleeing conflict zones. While these results were consistent across all three scenarios, it is obvious that mobility is driven by far more complex motivations at the individual level—which may explain the unpredictability of even the best model for any given area [25]. Moreover, we know that CDRs are unreliable Table 1 Statistical dispersion measures for two spatial
def-initions of the Haitian population
IQR interquartile range, SD standard deviation, CV coefficient of variation
Measure 140 spatial units 78 spatial units
IQR 39,232 80,251
SD 103,511 309,417
CV 1.43 2.39
Table 2 Transmission parameters used in the basic SIR framework
β indicates the contact rate, which can be detailed as β = pc, where p denotes the probability of getting infected when coming into contact with an infected individual, and c is the per-capita contact rate; γ indicates the recovery rate
Parameter Units Value References
β d−1 1 (0.96–1.16) Fitted
γ d−1 0.93 (0.89–0.97) Fitted
Table 3 Minimal AIC values, assuming that the overall probability of mobility (α) is to be fitted
AIC values obtained with each mobility model, for the 2010 Haiti cholera epidemic, assuming that the overall probability of mobility (α) is not given by CDRs, but fitted. The indicated models are: impedance model (IM), gravity model (GM), and radiation model (RM). Results are presented for the two spatial definitions. ∆AIC corresponds to the variation from the optimal AIC value derived from the CDRs
Model AIC
n = 140 αn = 140 ∆n AIC (%)= 140 AICn = 78 αn = 78 ∆n AIC (%)= 78
CDRs − 5200 0.14 25,870 0.14
IM 9000 0.01 + 273 20,171 0.5 − 22
GM 16,185 0.01 + 411 20,616 0.5 − 20
RM 9005 0.05 + 273 23,696 0.09 − 8.4
Table 4 Minimal AIC values, assuming that the overall probability of mobility (α) is known from CDRs
Overall probability of mobility (α) was derived from the CDRs. The indicated models are: impedance model (IM), gravity model (GM), and radiation model (RM). Results are presented for the two spatial definitions. ∆AIC corresponds to the variation from the optimal AIC value derived from the CDRs
Model AIC
n = 140 αn = 140 ∆n AIC (%)= 140 AICn = 78 αn = 78 ∆n AIC (%)= 78
CDRs − 5200 0.14 28,992 0.14
IM 22,798 0.14 + 538 20,852 0.14 − 28
GM 22,667 0.14 + 535 21,136 0.14 − 27
due to the uneven distribution of cell phone towers and the heterogeneous penetration of devices across popula-tions [26].
In this paper, we also compared results obtained from the new impedance model to those obtained from the two other more classical mobility models, based on real epidemiological data from the 2010 Haiti cholera epi-demic. However, this epidemic was governed by com-plex factors that may require mechanistic modeling that is more spatially explicit [17]. Here we used a basic SIR framework that failed to account for water contamina-tion. Also missing from this framework were the role of the Artibonite river in spreading the disease, the impact of hurricane Thomas (from 29 October to 7 November 2010), and rainfall data [27]. To attenuate such biases, the calibration span was restricted to a 12-week period during which meteorological and hydrolytic factors were presumed to be less critical.
Mathematical mobility models generally assume that the attractiveness of a location is correlated to the size of its population. However, this association is not always present, and, depending on the field, geographical barri-ers to mobility (such as high elevation, water bodies, etc.) and cultural resistance must be accounted for in the model formula without complicating it. While the most com-mon data include population sets that are usually defined in administrative rather than demographic terms [28], mathematical models are more accurate when relying on demographic entities. Redistribution according to demog-raphy can therefore enhance the performance of all math-ematical mobility models [28]. In our study, the impedance model performed well for patterns in which populations were aggregated beyond administrative constraints.
Future estimations of human mobility will likely increasingly rely on big data (such as high-resolution mobile network data or CDRs, social network data, etc.) [3], as these become available worldwide. However, when no real data is available on heterogeneous populations as is often the case in low-income countries, the impedance model can provide an unbiased, parameter-free, intuitive, and accurate framework for estimating human mobility for the purpose of controlling the spread of infectious diseases.
Conclusions
While dealing with scarcity of real mobility data, and especially when the population distribution is hetero-geneous, the proposed new impedance model provides most accurate estimates of human mobility at popula-tional level. Its use can improve epidemiological forecast-ing when reliable mobility data sources are not available.
Abbreviations
AIC: Akaike’s information criterion; aRMSE: average root mean square error; CDRs: call detail records; CV: coefficient of variation; GM: gravity model; IM: impedance model; IQR: interquartile range; LSDD: large to small popula-tion with distance deterrence (mobility scenario); RM: radiapopula-tion model; RSS: residual sum of squares; SD: standard deviation; SIM: subscriber identity mod-ule; SIR: susceptible–infected–recovered; SLDD: small to large population with distance deterrence (mobility scenario); SPDD: source population and distance deterrence (mobility scenario).
Authors’ contributions
KS, RG, LB, XL, EW, PA, SR, RP and JG contributed equally to this work. All authors read and approved the final manuscript.
Author details
1 INSERM, IRD, SESSTIM, Sciences Economiques & Sociales de la Santé & Traitement de l’Information Médicale, Aix Marseille Univ, Marseille, France. 2 Prospective et Coopération, Laboratoire d’Idées, Bureau d’Etudes Recherche, Marseille, France. 3 Service Biostatistique et Technologies de l’Information et de la Communication, APHM, Hôpital de la Timone, Marseille, France. 4 Department of Public Health Sciences, Karolinska Institutet, Stockholm, Sweden. 5 Flowminder Foundation, Stockholm, Sweden. 6 College of Informa-tion System and Management, NaInforma-tional University of Defense Technology, Changsha, China. 7 Stockholm School of Economics, Stockholm, Sweden. 8 DELR, Ministère de la Santé Publique et de la Population, Port-au-Prince, Haiti. 9 APHM, Direction de la Recherche et de l’Innovation, Marseille, France. 10 UMR S 1136 INSERM, UPMC, Institut Pierre Louis d’Epidémiologie et de Santé Publique, Paris, France.
Acknowledgements
The authors are grateful to Digicel Haiti for making available the anonymous mobile phone network data. We thank Arianne Dorval for the revision of the final draft of this manuscript.
Competing interests
The authors declare that they have no competing interests
Availability of data and materials
The datasets used and/or analyzed during the current study are available from the corresponding author on reasonable request.
Consent for publication
Not applicable.
Ethics approval and consent to participate
Not applicable.
Funding
This work was conducted with the support of the program “Investisse-ments d’Avenir” of the French Government in the form of an A*MIDEX grant (n°ANR-11-IDEX-0001-02). This work was granted access to the HPC resources of Aix-Marseille Université financed by the project Equip@Meso (ANR-10-EQPX-29-01) of the program “Investissements d’Avenir” supervised by the Agence Nationale pour la Recherche (Mésocentre). K. S. received grants from ADEREM (Association pour le Développement des Recherches Biologiques et Médicales) and OpenHealth Institute. XL acknowledges the support of the Natural Science Foundation of China (71522014). The funders had no role in study design, data collection and analysis, decision to publish, or preparation of the manuscript.
Additional file
• We accept pre-submission inquiries
• Our selector tool helps you to find the most relevant journal • We provide round the clock customer support
• Convenient online submission • Thorough peer review
• Inclusion in PubMed and all major indexing services • Maximum visibility for your research
Submit your manuscript at www.biomedcentral.com/submit
Submit your next manuscript to BioMed Central
and we will help you at every step:
Publisher’s Note
Springer Nature remains neutral with regard to jurisdictional claims in pub-lished maps and institutional affiliations.
Received: 9 August 2017 Accepted: 14 November 2017
References
1. Koopman J. Modeling infection transmission. Annu Rev Public Health. 2004;25:303–26.
2. Belik V, Geisel T, Brockmann D. Natural human mobility patterns and spatial spread of infectious diseases. Phys Rev X. 2011;1(1):011001. 3. Jurdak R, Zhao K, Liu J, AbouJaoude M, Cameron M, Newth D.
Under-standing human mobility from Twitter. PLoS ONE. 2015;10(7):e0131469. 4. Bengtsson L, Gaudart J, Lu X, Moore S, Wetter E, Sallah K, Rebaudet S,
Piar-roux R. Using mobile phone data to predict the spatial spread of cholera. Sci Rep. 2015;5:8923.
5. Zipf GK. The P1P2/D hypothesis: on the intercity movement of persons. Am Sociol Rev. 1946;11:677–86.
6. Simini F, Gonzalez MC, Maritan A, Barabasi AL. A universal model for mobility and migration patterns. Nature. 2012;484(7392):96–100. 7. Stefanouli M, Polyzos S. Gravity vs radiation model: two approaches on
commuting in Greece. Transp Res Proc. 2017;24(Supplement C):65–72. 8. Tizzoni M, Bajardi P, Decuyper A, King GKK, Schneider CM, Blondel V,
Smoreda Z, González MC, Colizza V. On the use of human mobility prox-ies for modeling epidemics. PLOS Comput Biol. 2014;10(7):e1003716. 9. Wesolowski A, O’Meara WP, Eagle N, Tatem AJ, Buckee CO. Evaluating Spatial Interaction Models for Regional Mobility in Sub-Saharan Africa. PLoS Comput Biol. 2015;11(7):e1004267.
10. Bengtsson L, Lu X, Thorson A, Garfield R, von Schreeb J. Improved response to disasters and outbreaks by tracking population movements with mobile phone network data: a post-earthquake geospatial study in Haiti. PLoS Med. 2011;8(8):e1001083.
11. Burton A, Altman DG, Royston P, Holder RL. The design of simulation studies in medical statistics. Stat Med. 2006;25(24):4279–92.
12. Gaudart J, Rebaudet S, Barrais R, Boncy J, Faucher B, Piarroux M, Magloire R, Thimothe G, Piarroux R. Spatio-temporal dynamics of cholera during the first year of the epidemic in Haiti. PLoS Negl Trop Dis. 2013;7(4):e2145. 13. Piarroux R, Barrais R, Faucher B, Haus R, Piarroux M, Gaudart J, Magloire R,
Raoult D. Understanding the cholera epidemic, Haiti. Emerg Infect Dis. 2011;17(7):1161–8.
14. Cholera outbreak. Assessing the outbreak response and improving preparedness. http://apps.who.int/iris/bitstream/10665/43017/1/WHO_ CDS_CPE_ZFk_2004.4_eng.pdf.
15. Mobile for Development Intelligence—Haiti. https://mobiledevelop-mentintelligence.com/countries/HTI-haiti#.
16. Akaike H. A new look at the statistical model identification. IEEE Trans Automat Contr. 1974;19:716–23.
17. Rinaldo A, Bertuzzo E, Mari L, Righetto L, Blokesch M, Gatto M, Casagrandi R, Murray M, Vesenbeckh SM, Rodriguez-Iturbe I. Reassessment of the 2010–2011 Haiti cholera outbreak and rainfall-driven multiseason projec-tions. Proc Natl Acad Sci USA. 2012;109(17):6602–7.
18. Gaudart J, Ghassani M, Mintsa J, Rachdi M, Waku J, Demongeot J. Demog-raphy and diffusion in epidemics: malaria and black death spread. Acta Biotheor. 2010;58(2):277–305.
19. Brockmann D, Hufnagel L, Geisel T. The scaling laws of human travel. Nature. 2006;439(7075):462–5.
20. Gonzalez MC, Hidalgo CA, Barabasi AL. Understanding individual human mobility patterns. Nature. 2008;453(7196):779–82.
21. Song C, Koren T, Wang P, Barabasi A-L. Modelling the scaling properties of human mobility. Nat Phys. 2010;6(10):818–23.
22. Kang C, Liu Y, Guo D, Qin K. A generalized radiation model for human mobility: spatial scale, searching direction and trip constraint. PLoS ONE. 2015;10(11):e0143500.
23. Masucci AP, Serras J, Johansson A, Batty M. Gravity versus radiation mod-els: on the importance of scale and heterogeneity in commuting flows. Phys Rev E Stat Nonlinear Soft Matter Phys. 2013;88(2):022812. 24. Yan XY, Zhao C, Fan Y, Di Z, Wang WX. Universal predictability of mobility
patterns in cities. J R Soc Interface R Soc. 2014;11(100):20140834. 25. Pappalardo L, Simini F, Rinzivillo S, Pedreschi D, Giannotti F, Barabasi AL.
Returners and explorers dichotomy in human mobility. Nat Commun. 2015;6:8166.
26. Deville P, Linard C, Martin S, Gilbert M, Stevens FR, Gaughan AE, Blondel VD, Tatem AJ. Dynamic population mapping using mobile phone data. Proc Natl Acad Sci. 2014;111(45):15888–93.
27. Jutla A, Whitcombe E, Hasan N, Haley B, Akanda A, Huq A, Alam M, Sack RB, Colwell R. Environmental Factors Influencing Epidemic Cholera. Am J Trop Med Hyg. 2013;89(3):597–607.
28. Amini A, Kung K, Kang C, Sobolevsky S, Ratti C. The impact of social segre-gation on human mobility in developing and industrialized regions. EPJ Data Sci. 2014;3(1):1–20.