Open Access
Research article
Genome scan to assess the respective role of host-plant and
environmental constraints on the adaptation of a widespread insect
Stéphanie Manel*
1,2, Cyrille Conord
1and Laurence Després
1Address: 1Laboratoire d'Ecologie Alpine, UMR CNRS 5553, Université Joseph Fourier, 2233, rue de la Piscine, Bat D UFR de Biologie, BP 53, 38
041 Grenoble Cedex 09, France and 2Current address: Laboratoire Population-Environnement-Développement, UMR 151 UP/IRD, Université de
Provence, centre Saint-Charles, Case 10, 3, place Victor-Hugo, 13331 Marseille Cedex 3, France
Email: Stéphanie Manel* - stephanie.manel@ujf-grenoble.fr; Cyrille Conord - Cyrille.Conord@ujf-grenoble.fr; Laurence Després - laurence.despres@ujf-grenoble.fr
* Corresponding author
Abstract
Background: The evolutionary success of phytophagous insects could result from their
adaptation to different host-plants. Alternatively, the diversification of widespread species might be driven by adaptation along environmental gradients. To disentangle the respective roles of host-plant versus abiotic environmental variables acting on the genome of an oligophagous insect, we performed a genome scan using 83 unlinked AFLP markers on larvae of the large pine weevil collected on two host-plants (pine and spruce) in four forestry regions across Europe.
Results: At this large geographic scale, the global genetic differentiation was low and there was no
isolation by distance pattern, suggesting that migration is overwhelming genetic drift in this species. In this context, the widely used frequentist methods to detect outliers (e.g. Dfdist), which assume migration - drift equilibrium are not the most appropriate approach. The implementation of a recently developed Bayesian approach, conceived to detect outliers even in non-equilibrium situations, consistently detected 9 out of 83 loci as outliers. Eight of these were validated as outliers by multiple logistic regressions: six correlated with environmental variables, one with host-plant and one with the interaction between environmental variables and host-plant.
Conclusion: These results suggest a relatively greater importance of abiotic environmental
variables, as opposed to factors linked with the host-plant, in shaping genetic differentiation across the genome in this species. Logistic regression allows the nature of factors involved in locus-specific selection to be precisely identified and represents another step forward in the process of identifying adaptive loci.
Background
Natural selection is expected to increase the frequency of locally advantageous alleles, resulting in higher among-population differentiation at these adaptive loci (meas-ured by locus-specific FST), compared with differentiation in the rest of the genome (neutral loci) [1,2]. Identifying
adaptive divergence among populations at specific loci from genome scans is an active and challenging research area (see [3] for a review). This task is especially demand-ing for dominant biallelic markers such as Amplified Frag-ment Length Polymorphism (AFLP) markers, although they represent an easy way to scan a large number of Published: 10 December 2009
BMC Evolutionary Biology 2009, 9:288 doi:10.1186/1471-2148-9-288
Received: 21 July 2009 Accepted: 10 December 2009 This article is available from: http://www.biomedcentral.com/1471-2148/9/288
© 2009 Manel et al; licensee BioMed Central Ltd.
This is an Open Access article distributed under the terms of the Creative Commons Attribution License (http://creativecommons.org/licenses/by/2.0), which permits unrestricted use, distribution, and reproduction in any medium, provided the original work is properly cited.
markers scattered throughout the genome in non-model species [4-6]. So far, the most widely used method to detect outliers from AFLP genome scans is implemented in Dfdist, an extension of Fdist software that allows the use of dominant markers [7]. Dfidst is a frequentist method based on summary statistics of a symmetrical island model (i.e. drift-migration equilibrium, [8]). Each locus is compared to the neutral distribution built from the mean FST averaged across all populations. Dfdist is likely to generate false positives (i.e. loci with higher than expected FST) when gene flows are asymmetric across pop-ulations, and/or when some populations experiment bot-tlenecks. To overcome that limitation, Foll and Gaggiotti [9] have recently developed a new hierarchical Bayesian method (BayeScan) that also allows the accommodation of AFLPs data. Their method is derived from the method of Beaumont and Baldwin [10]. It produces a posterior probability for each locus being under selection. The main advantage of BayeScan is that it estimates population-spe-cific FST coefficients, therefore allowing for different demographic histories and different amounts of genetic drift between populations. In structured populations, the Bayesian approach is less likely to detect false positives. The proportion of false positive in detected outliers can-not be easily estimated in the Bayesian approaches as it requires simulating datasets under different scenarios [9]. By contrast, it can be estimated using false discovery rate [11] in frequentist methods.
After detecting outlier loci, it is then a challenging pros-pect to verify whether they are involved in local adapta-tion and to isolate the different ecological factors responsible for the behaviour of each outlier from a com-plex natural environment [4,12]. Indeed, despite recent advances in tracking adaptive genes out from the neutral background genetic variability across populations of a species, the relative role of biotic versus abiotic constraints acting on genomes in their natural environment remains a largely under-explored area. For non-model organisms, outlier loci cannot be mapped and hence their functional role will remain unknown. An alternative approach is to correlate their variation in frequency throughout the sam-pling area with that of continuous environmental varia-bles, such as altitude or climate [13-15], or qualitative variables such as different host-plants for insects [6,16,17] or different life habits (limnic or benthic) for fish ecotypes [18].
The evolutionary success of phytophagous insects is thought to result mainly from their adaptation to various host-plants, with insect adaptation driving plant diversifi-cation in a co-evolutionary process [19-21]. Alternatively, the diversification of widespread species could be driven by adaptation along environmental abiotic gradients. The large pine weevil Hylobius abietis L. (Curculionidae) is a
good model for addressing this question because it is widespread in Europe (large environmental variation) and because, during larval development, it depends exclu-sively on only two plant genera: spruce (Picea) and pine (Pinus). The large pine weevil is one of the most important economic pests of European conifer forests. The larvae feed under the bark of stumps and roots of recently felled trees, and take from three months to two years to develop into adults, depending on location [22], presumably because of climatic conditions and/or host plant quality [23,24]. The adults are active only under cool climatic conditions, usually in spring and autumn, and burrow into the soil during hot summers and cold winters; adults can fly large distances and can live up to four years [22]. Because of this complex life cycle, several climatic factors including temperature, precipitation, soil, frost and wind speed may have either a direct impact on larval/adult sur-vival, or a more indirect impact on fitness through host plant quality, and represent therefore potential selective forces acting on the pine weevil genome at a large geo-graphical scale. Adults are attracted to recently felled trees (spruce or pine) where the females lay eggs under the bark. Managed pine and spruce forests planted in Western Europe 200-300 years ago offer many oviposition oppor-tunities for this weevil, allowing large stable populations to be sustained in contrasting climatic environments. The first study on the population genetic structure of the pine weevils, at the European scale [25] revealed that genetic variation of this insect is better explained by geog-raphy than host-plant (5% versus 1% of total variation). Furthermore, a locus by locus AMOVA identified some loci with significant FST across different host-plant groups, suggesting that host-plant linked selection might occur in this species. A second analysis consistently identified 2 out of 83 unlinked AFLP markers as outliers by using uni-variate logistic regressions to search for correlations between molecular markers scattered throughout the genome and several environmental variables suggesting an effect of climate on weevil adaptation [14]. However, the effect of the host-plant type was not tested.
In the present analysis, we focused on disentangling the role of abiotic environmental variables on one hand from the effect of the host-plant (pine or spruce) on the other. We therefore excluded adult weevils from the original AFLP dataset because they cannot be assigned to a host-plant, reducing the analysed dataset to 296 individual lar-vae. We firstly detected outlier loci across geographic and host-specific groups of individuals in 16 managed forest sites distributed across 4 large forestry regions (Table 1, Figure 1) using population genetic approaches (Dfdist and BayeScan). We then used a correlative approach to disentangle the effects of host-plants from those of vari-ous environmental variables. To further confirm the
involvement of selection in genetic patterns of differenti-ation, we tested for the drift-migration equilibrium (i.e. isolation by distance pattern) on neutral loci. If adapta-tion to host-plant is promoting divergence, then we would expect to find outliers loci when comparing differ-ent host populations whereas loci candidate to diverge independently from host-plant would be rather correlated with other ecological pressures, such as climate.
Results
Population genetic approaches
The global FST, calculated with AFLP-SURV 1.0 [26] was low but significant (FST = 0.02, p < 0.0001). Most pairwise
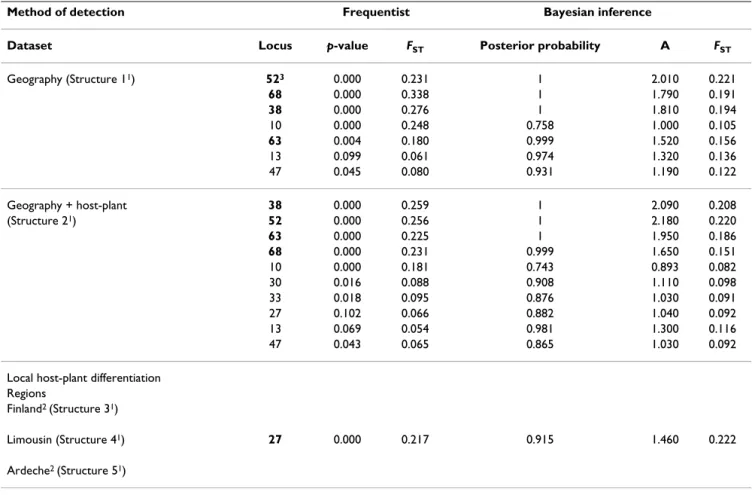
FST between sites within region were non-significantly dif-ferent from zero, while all pairwise FST between the four forestry regions were significant (range 0.057-0.058, p < 0.0001), indicating that forestry region is a coherent pop-ulation genetic entity. When larvae were grouped accord-ing to their forestry region (structure 1, Figure 1), four markers were consistently detected by both population genetic approaches as being under directional selection: loci 52, 38, 68 and 63 (Table 2). Dfdist detected one out-lier (locus 10) that was not detected by BayeScan, and BayeScan detected two outliers (loci 13 and 47) that were not detected by Dfdist.
Subdividing the geographic data set into host-plant groups (pine and spruce) (structure 2, Figure 1) allowed three additional outliers, loci 27, 30 and 33, to be detected only with BayeScan (Table 2).
When local pairwise comparisons between host-plants were performed within each region (structures 3, 4, 5, Fig-ure 1), only one locus was detected as host-specific by both genetic methods in Limousin (locus 27). This locus was also detected in host-plant groups (structure 2, Figure 1) by the Bayesian approach. No host-plant outliers were detected in Finland and in Ardèche (Table 2).
These last years, it has been suggested to use false discov-ery rate or q-values to assess significance in multiple tests [11]. The maximum estimated q-value among all p-values less than or equal to 0.0006 was 0.014: this means that among 100 loci predicted as outliers, less than 2 are false
Group-based structure of the large pine weevil larvae
Figure 1
Group-based structure of the large pine weevil lar-vae. Description of the 5 group-based structures defined for
the two population genetic approaches. Rectangles: regions. Circles: host-plant groups; P = Pine, S = Spruce; sample size in parentheses. Structure 1: individuals were grouped according to their geographic origin: Finland, Limousin, Ardèche, and Landes (the four rectangles 1, 2, 3, 4). Struc-ture 2: individuals were grouped according to their geo-graphic origin and host-plant (7 circles) Structures 3, 4, 5: within each of the three regions (rectangles 1, 2, 3) where both alternative host-plants are found (Finland, Limousin, and Ardèche), pairwise comparisons of host-plant samples were performed. Two circles in rectangle 1, 2, 3 correspond to structures 3, 4, 5 respectively.
Finland: 1 Limousin: 2 Ardèche: 3 Landes: 4
S (50) S (30) S (38) P (20) P (28) P (85) P (45)
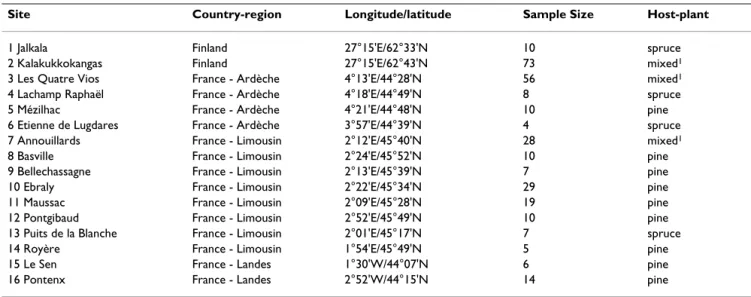
Table 1: Geographic location, sample sizes and host-association characteristics of Hylobius abietis sites collected.
Site Country-region Longitude/latitude Sample Size Host-plant
1 Jalkala Finland 27°15'E/62°33'N 10 spruce 2 Kalakukkokangas Finland 27°15'E/62°43'N 73 mixed1
3 Les Quatre Vios France - Ardèche 4°13'E/44°28'N 56 mixed1
4 Lachamp Raphaël France - Ardèche 4°18'E/44°49'N 8 spruce 5 Mézilhac France - Ardèche 4°21'E/44°48'N 10 pine 6 Etienne de Lugdares France - Ardèche 3°57'E/44°39'N 4 spruce 7 Annouillards France - Limousin 2°12'E/45°40'N 28 mixed1
8 Basville France - Limousin 2°24'E/45°52'N 10 pine 9 Bellechassagne France - Limousin 2°13'E/45°39'N 7 pine 10 Ebraly France - Limousin 2°22'E/45°34'N 29 pine 11 Maussac France - Limousin 2°09'E/45°28'N 19 pine 12 Pontgibaud France - Limousin 2°52'E/45°49'N 10 pine 13 Puits de la Blanche France - Limousin 2°01'E/45°17'N 7 spruce 14 Royère France - Limousin 1°54'E/45°49'N 5 pine 15 Le Sen France - Landes 1°30'W/44°07'N 6 pine 16 Pontenx France - Landes 2°52'W/44°15'N 14 pine
positives (i.e. neutral), so that it is very unlikely that there is any false positive among the 6 loci identified as outliers.
Results from the correlative approach and comparison with population genetic methods
The first two axes of the principal component analysis (PCA) used to investigate correlation between environ-mental factors explained 96% of the variance (76% and 20% respectively), suggesting that all these variables were highly correlated (correlations of climatic variables with axis 1: 80%; correlation of altitude with axis 2: 53%). The first two axes of the PCA were used as orthogonal predic-tors in the logistic regressions.
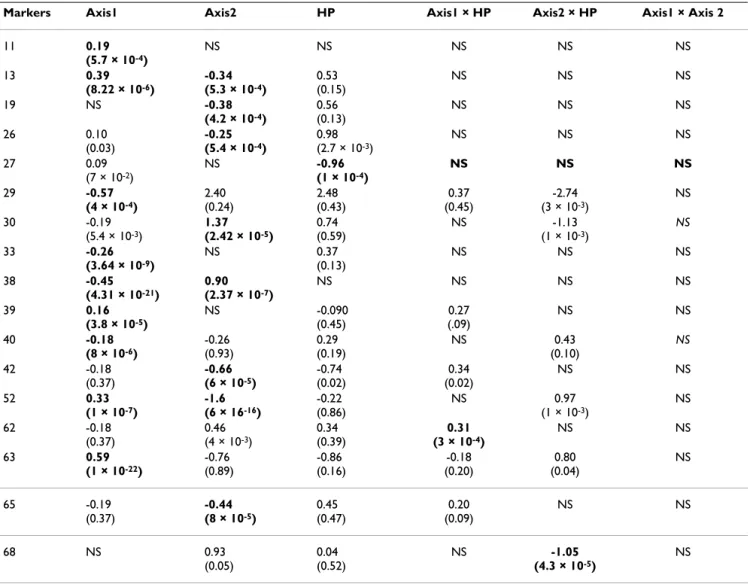
Based on both a minimal Akaike criterion and the likeli-hood ratio test significant at level α = 6 × 10⁻⁴, the multi-ple logistic regressions identified 17 markers correlated with at least one of the 6 explanatory variable tested (Table 3). The regression coefficients of the climatic varia-bles were significant for 14 markers, those of host-plant were significant for one marker (27), and those of
interac-tions between host-plant and one of the PCA axis repre-senting abiotic environmental variables for two markers (62 and 68). The maximum estimated q-value among all
p-values less than or equal to 0.0006 was 0.0033. Again it
is very unlikely that there is any false positive among the 17 loci identified as outliers.
Finally, seven loci were identified as under positive selec-tion by the regression method and at least one genetic based method (Table 2 and 3: loci 13, 27, 52, 38, 63, 30, 33 and 68). Six of these were correlated with one or two axes of the PCA representing the climatic variables, one (locus 27) was correlated with host-plant, and one (68) with the interaction between the PCA axis 2 and host-plant.
The correlative method did not detect the locus 10 detected as outlier by Dfdist but not detected by the Baye-sian approach, suggesting that this is site-specific locus related to a particular demographic history of a site rather than to the ecological pressures analysed.
Table 2: Results of outlier detection among the 83 AFLP markers in larvae of the large pine weevil using the frequentist method Dfdist and the Bayesian inference method BayeScan.
Method of detection Frequentist Bayesian inference
Dataset Locus p-value FST Posterior probability A FST
Geography (Structure 11) 523 0.000 0.231 1 2.010 0.221 68 0.000 0.338 1 1.790 0.191 38 0.000 0.276 1 1.810 0.194 10 0.000 0.248 0.758 1.000 0.105 63 0.004 0.180 0.999 1.520 0.156 13 0.099 0.061 0.974 1.320 0.136 47 0.045 0.080 0.931 1.190 0.122 Geography + host-plant 38 0.000 0.259 1 2.090 0.208 (Structure 21) 52 0.000 0.256 1 2.180 0.220 63 0.000 0.225 1 1.950 0.186 68 0.000 0.231 0.999 1.650 0.151 10 0.000 0.181 0.743 0.893 0.082 30 0.016 0.088 0.908 1.110 0.098 33 0.018 0.095 0.876 1.030 0.091 27 0.102 0.066 0.882 1.040 0.092 13 0.069 0.054 0.981 1.300 0.116 47 0.043 0.065 0.865 1.030 0.092 Local host-plant differentiation
Regions
Finland2 (Structure 31)
Limousin (Structure 41) 27 0.000 0.217 0.915 1.460 0.222
Ardeche2 (Structure 51) 1As in Figure 1.
2No outliers were found with the significance level used.
3Bold type indicates markers that are detected by both methods with a type-I error (α) = 0.0006 for Dfdist, and with a posterior probability > 0.79
BayeScan suggested that loci 27, 33 and 30 were involved in host-plant adaptation, which is confirmed by logistic regression for locus 27 (Table 3). However for marker 30 and 33, the logistic regression only found an effect of envi-ronmental variables (Table 3). Finally, one locus (locus 68) detected by BayeScan both in structure 1 and 2 (Figure 1) was found significantly associated with the interaction between host-plant and PCA axis 2.
When the outliers were omitted from the dataset, there was no correlation between neutral genetic distance (FST/ (1-FST)) and geographical distance (r = 0.35, p = 0.067) or the logarithm of the geographical distance (r = 0.33, p = 0.077).
Discussion
Detection of outliers - complimentary approaches
The lack of correlation between genetic and geographical distances, together with low FST observed throughout the range of comparisons, suggest that large pine weevils pop-ulations are not at the drift-migration equilibrium; the low FST consistently observed throughout the sampling range suggests that migration is overwhelming drift in this species. This is a further justification to use the Bayesian approach rather than Dfdist to detect outliers. Therefore we consider outliers detected by BayeScan as more relia-ble. However, both population genetic methods rely on the identification of loci that differ more than the rest of the genome between two or more groups of individuals. One caveat of such approaches to detect outliers is the
Table 3: Results from stepwise logistic regressions relating the presence and absence of each marker to the two first axes of the principal component analysis (PCA)1, the host-plant (HP), and the three interactions2.
Markers Axis1 Axis2 HP Axis1 × HP Axis2 × HP Axis1 × Axis 2
11 0.19 (5.7 × 10⁻⁴) NS NS NS NS NS 13 0.39 (8.22 × 10⁻⁶) -0.34 (5.3 × 10⁻⁴) 0.53 (0.15) NS NS NS 19 NS -0.38 (4.2 × 10⁻⁴) 0.56 (0.13) NS NS NS 26 0.10 (0.03) -0.25 (5.4 × 10⁻⁴) 0.98 (2.7 × 10⁻³) NS NS NS 27 0.09 (7 × 10⁻²) NS -0.96 (1 × 10⁻⁴) NS NS NS 29 -0.57 (4 × 10⁻⁴) 2.40 (0.24) 2.48 (0.43) 0.37 (0.45) -2.74 (3 × 10⁻³) NS 30 -0.19 (5.4 × 10⁻³) 1.37 (2.42 × 10⁻⁵) 0.74 (0.59) NS -1.13 (1 × 10⁻³) NS 33 -0.26 (3.64 × 10⁻⁹) NS 0.37 (0.13) NS NS NS 38 -0.45 (4.31 × 10⁻²¹) 0.90 (2.37 × 10⁻⁷) NS NS NS NS 39 0.16 (3.8 × 10⁻⁵) NS -0.090 (0.45) 0.27 (.09) NS NS 40 -0.18 (8 × 10⁻⁶) -0.26 (0.93) 0.29 (0.19) NS 0.43 (0.10) NS 42 -0.18 (0.37) -0.66 (6 × 10⁻⁵) -0.74 (0.02) 0.34 (0.02) NS NS 52 0.33 (1 × 10⁻⁷) -1.6 (6 × 16-16) -0.22 (0.86) NS 0.97 (1 × 10⁻³) NS 62 -0.18 (0.37) 0.46 (4 × 10⁻³) 0.34 (0.39) 0.31 (3 × 10⁻⁴) NS NS 63 0.59 (1 × 10-22) -0.76 (0.89) -0.86 (0.16) -0.18 (0.20) 0.80 (0.04) NS 65 -0.19 (0.37) -0.44 (8 × 10⁻⁵) 0.45 (0.47) 0.20 (0.09) NS NS 68 NS 0.93 (0.05) 0.04 (0.52) NS -1.05 (4.3 × 10⁻⁵) NS
1 Axis 1 and axis 2 are the two first PCA components (representing respectively 76 and 20% of total inertia) of the projection of altitude and nine
climatic variables calculated from the latitude/longitude as yearly mean of monthly values for the period 1961 to 2001 (see Methods for more details).
2Statistically significant logistic regression coefficients are indicated in bold (p-values for each coefficient are given in parenthesis). NS: the
possible detection of loci with different inherent features such as markers on sexual chromosomes, or markers that exhibit different intrinsic mutation rates. For instance, a sex-linked locus would have a different effective popula-tion size (Ne) than autosomal loci and thus more extreme
FST values; and, as a consequence, potentially mis-classi-fied as outlier. Finally, Excoffier et al. [27] highlight the need to have a good understanding of the population genetic structure of the studied organism, to accurately identify loci with unusual levels of differentiation using population genetic approaches. In that context, the valida-tion of outliers detected using populavalida-tion genetic approaches by correlative approaches appear to be partic-ularly important. Eight loci were identified both by logis-tic regression and by BayeScan as being under positive selection. Out of these loci, one was correlated with host-plant, and one was correlated with the interaction between host-plant and abiotic factors. The congruence of the results obtained with two different methods using totally different algorithms (population genetic based vs correlative approach), makes us confident about these findings. Locus 27 was detected as an outlier linked to host-plant only in Limousin (Table 2), which raises the question of local adaptation at the regional scale. In the Limousin, locus 27 is much more frequent on spruce than on pine (0.8 versus 0.36). Although it was not detected as an outlier in the two other regions (Ardèche and Finland), it was also more frequent on spruce, suggesting that it is a global trend as also suggested by the logistic regression. In contrast, the loci identified as outliers by only one of the methods should be interpreted with caution. First, the lack of congruence observed between the two genetic methods could be linked to the presence of false positives, which can be generated by both methods [9,10].
Second, the identification of an outlier by Dfdist but not by BayeScan could result from the fact that Dfdist does not take into account population-specific demographic effects. This was the case for one locus (locus 10) over-rep-resented in one region (Landes) compared with the other regions (frequency 0.9 vs 0.30 to 0.39). Because the Baye-sian model takes into account site-specific effects in mod-elling population divergence (by calculating population-specific FST), it did not detect this locus as differing more than expected given the overall divergence of this isolated south-western region (Landes) compared to the rest of the European weevil distribution. Accordingly, the FST esti-mates for this locus was strikingly different depending on the method used, with much higher estimates obtained using Dfdist than BayeScan (Table 2). Another hypothesis that can support the fact that locus 10 was only detected as an outlier by Dfdist and not BayeScan in Landes is the "allele surfing effect" [28]. In a 2D spatial demographic expansion model, it is possible that one front of the wave
drift caused by a spatial bottleneck could push low fre-quency alleles to increase their proportion and possibly become fixed in those populations at the edge of the geo-graphical range of species distribution. The non-identifi-cation of such locus by the logistic regression could be a way to further confirm a false positive.
Ecological divergence: possible selective pressures
The logistic regression identified 9 loci not consistently found by the genetic methods (11, 19, 26, 29, 39, 40, 42, 62, 65). Such results could be interpreted as spurious cor-relations, not linked to adaptation. A second explanation could be that these loci are indeed under directional selec-tion, but that both genetic methods failed to detect them as outliers. Indeed, both genetic methods have a high rate of false negatives, i.e. loci that are true outliers but that are not detected. For example, Beaumont & Balding [10], using simulated datasets, found that as many as 50% of true directionally selected biallelic codominant loci (selection coefficient 0.05) were mis-classified as being neutral by Fdist, a proportion that might be even higher with dominant markers. With BayeScan, Foll and Gaggi-otti [9] showed that for simulated AFLP datasets with an average FST of 0.05, 6 populations, 30 individuals sampled per population, and a selection coefficient of 0.05, the false negative rate was as high as 33%. The parameters used in these simulations were similar to those of our dataset (average FST = 0.05, 7 populations with an average of 42 individuals sampled per population).
Two strategies can be used to search for loci under envi-ronmental selection. The first consists of applying popula-tion genetic methods to identify outliers, then using logistic regression only on the identified outliers to char-acterise the selective pressure that best explains their vari-ability [17]. The second strategy is the one we used in the present study, which was also used by Joost et al. [14]. The approach consists of systematically applying the logistic regression to all loci to identify all marker correlations and thus perhaps identify additional markers, correlated to the environmental variable, that were not detected as outliers by the genetic approaches. As a second step in this strategy, one returns to the genetic method to investigate these newly detected relations in more depth, for example by using different groupings that better reflect the selective pressure identified by the logistic regression.
In fact, only logistic regression allows assumptions to be made on the selective pressure shaping observed patterns of adaptive genetic diversity. Although it is only a correla-tive approach, it can help us to formulate biological hypothesis. However, we need to keep in mind i) the pos-sibility of spurious relations, and ii) the problem of the choice of the explanatory variables, which is not an easy task. Indeed, climatic variables are often highly
inter-cor-related and in most cases also corinter-cor-related with elevation, longitude and latitude. In our case, to avoid the correla-tions between the climatic and elevation variables, we applied a PCA to produce orthogonal predictors, reducing a total of 10 highly correlated explanatory variables to two 'environmental' predictors. However, to have more pre-cise information about the involvement of each climatic/ elevation variable on the behaviour of each locus, it would be necessary to use the climatic variables directly rather than the PCA axes as explanatory factors, as done in Joost et al. [14]. In this later paper based on a larger dataset but not testing for the impact of the host-plant on locus-specific differentiation, two outliers (loci 38 and 52, also detected in the present analysis) were shown to be corre-lated with climatic variables, locus 38 being positively cor-related with the number of days of ground frost and negatively with precipitation, sunshine and diurnal tem-perature range, while locus 52 was positively correlated with diurnal temperature range. A priori biological assumptions and knowledge about the selective pressure at play in nature can help with the choice of predictors to be used in the model. However, when no a priori assump-tion is available, all variables (after checking for correla-tions) should be included in the model. We do nevertheless need to keep in mind that it is always better to favour direct predictors (e.g. gradient of humidity) over indirect predictors (e.g. elevation) [29].
Although migration is likely to be important in this flying weevil, which may also be enhanced due to the high con-nectivity of pine and spruce planted forests in Europe and perhaps by human-mediated translocations, we detected 8 loci out of 83 (9.6%) under directional selection across Europe - corresponding to a selection coefficient 5 times stronger than migration [10]. Out of these adaptive loci, only one was correlated with the host-plant, and one was correlated with the interaction between host-plant and abiotic variables. Hylobius larvae feed on decaying plant material, so that the food quality might depend both on the host-plant type and on climatic variables. Further-more, host-plant genotypes might vary from a region to another, explaining why the interaction between both biotic and abiotic factors might be more important than each factor taken separately in explaining genetic variabil-ity at some particular locus. This shows that in this wide-spread oligophagous weevil, climatic variables have a relatively larger effect than the host-plant in shaping genetic differentiation across the genome. Managed coni-fer forests in Western Europe are relatively recent from an evolutionary perspective and have been planted with both spruce and pine throughout large areas outside the natural range of the two tree genera, thereby possibly limiting the opportunities for selection based on host-plant. In con-trast, the wide geographic range of these managed forests means that Hylobius abietis encounters a large variability in
climatic conditions. For instance, this weevil lives under-ground during its diapause stage, and the length of the soil frost period is likely to be a selective factor [14]. We found only limited evidence for host-plant-specific out-liers, which represented only 1.2% of all loci. This is com-parable to the 1-2% of AFLP loci detected as host-specific in a genome scan performed on different ecotypes of
Timema walking sticks, using two host-plant species [17],
and slightly less than that observed across maple and wil-low beetles (5% of host-specific loci, [16]). Most of the host groups in this latter study were however taken from different geographic localities, making it difficult to dis-tinguish environmental effects from host-specific adapta-tions. Finally, the limited evidence for host-plant adaptive loci in Hylobius abietis could be related to the presence of obligate endosymbiotic bacteria in the midgut of larvae [30]. Although the precise role of these bacteria in
Hylo-bius abietis fitness has not yet been elucidated, the
pres-ence of this third genome (not included in our genome scan because insect gut was removed before DNA extrac-tion) might be an alternative way to specialize on various host-plants, thereby limiting the selection for adaptive loci within the genome of the insect itself. Obligate endo-symbionts are widespread in insects and might play a key role in the adaptation of phytophagous insects to alterna-tive host-plants [31].
Conclusion
Our study shows that correlative methods are very prom-ising to investigate the respective role of many environ-mental variables in shaping the geographical distribution at a locus level (allele frequency). They are particularly useful to validate outliers detected using population genetic methods, especially when populations are not at their demographic equilibrium. Finally, correlative meth-ods represent the only way to investigate for adaptive loci when sampling is conducted at the individual rather that population level, and no a priori grouping of individuals into panmictic populations can be performed, rendering population genetic methods inappropriate.
Methods
Study sites and data collection
This study is based on a sub-sample (296 larvae) of a large AFLP dataset of great pine weevils comprising 367 indi-viduals, including adults and larvae, collected in 20 local-ities throughout Europe [14,25]. Larvae were collected on either spruce (Picea abies Karst) or pine (Pinus sylvestris L. and Pinus pinaster Ait.) in 16 managed forest sites distrib-uted across 4 large forestry regions: three in France (Lim-ousin, Ardeche, and Landes) and one in Finland (Table 1). Some sites were planted only with spruce, other only with pine, and several both with spruce and pine. Three out of the four regions analysed comprised the two host-plants (Finland, Limousin, Ardeche), while the region Landes
was planted only with pine (Pinus pinaster) (Figure 1). For each sampled site, previously geo-referenced [23], we extracted nine environmental variables (same variables used by [12]) as yearly mean of monthly values for the period 1961-2001 (available at: http:// www.cru.uea.ac.uk[28]): mean diurnal temperature range (°C), number of days with ground frost, precipitation (mm/month), coefficient of variation of monthly precip-itation (%), relative humidity (%), maximum possible sunshine (% of day length), mean temperature (°C), wet days (number of days with > 0.1 mm rain per month), wind speed (m/s at 10 m above the ground). The altitude of the site was also noted.
Larvae were genotyped at 83 unlinked AFLP loci as described in Conord et al. (2006) [25]. Fragment length ranged from 50 to 375 bp, and most fragments (86%) were longer than 100 bp limiting the probability of homoplasy (co-migrating non-homologous fragments) which is known to affect mostly small fragments [25]. AFLP patterns were then visualised with GENOGRAPHER V1.6.0 software, in which a fluorescent peak corresponds to the presence of an amplified restriction fragment. Poly-morphic peaks were checked individually and a presence/ absence (i.e. 1/0) matrix was constructed. A previous genetic structure analysis showed that regional forests are a pertinent geographic scale for defining populations in the large pine [25].
Outlier detection using a population genetic approach
To detect outlier loci presenting a signature of positive selection in our AFLP dataset we used two population genetic approaches. Both methods aimed at detecting loci with a higher than expected differentiation between pop-ulations in contrasting situations (e.g. contrasting climatic conditions, and/or alternative host-plant species): (1) the popular Beaumont and Nichols [7] Dfdist program devel-oped from Fdist for the analysis of dominant data (avail-able at http://www.rubic.rdg.ac.uk/~mab/stuff/) and (2) a new hierarchical Bayesian method (BayeScan, http:// www-leca.ujf-grenoble.fr/logiciels.htm[9] that also allows the accommodation of AFLP data. Dfidst is a frequentist method based on summary statistics of a symmetrical island model (i.e. drift-migration equilibrium, [8]. Dfdist implements the Bayesian method of Zhivotovsky [32] for dominant markers [32] to estimate allelic frequencies. Outliers were identified by plotting FST against heterozy-gosity under the assumption of Hardy-Weinberg equilib-rium. Significance values were obtained by generating a null distribution of FST values based on 50 000 simulated loci with a mean FST equal to the trimmed mean FST calcu-lated by removing the 30% highest and lowest FST values observed in the empirical dataset [4,10]. Finally Dfdist plots the observed FST value for each locus to detect those falling outside the neutral expectation given by the null distribution.
A first shortcoming of Dfdist is the possibility of detecting false positives (i.e. committing type-I errors) [33,34]. This risk, largely due to multiple tests (one at each locus), can be reduced by using a conservative significance level [10,35], as done here by adopting the smallest type I error of our analysis which is the one calculated for logistic regressions α = 0.0006 (see later the justification). It is also possible to estimate the number of false positives among detected outlier loci (= false discovery rate) for a given level of significance by applying Storey and Tib-shirani's [11]q-value method. False discovery rate is a sta-tistical method used in multiple hypotheses testing to correct for multiple comparisons. In our case, the method estimates the false discovery rate (or q-value) from the set of each locus p-values provided by Dfdist. For a signifi-cance level of 0.0006, the corresponding q-value is the expected proportion of false positives among detected outliers. We used the q-value package in R [36] for compu-tations [11].
A second shortcoming of Dfdist is that it assumes that populations are at drift-migration equilibrium, which is unrealistic in most natural situations. In that context, the main advantage of BayeScan is that it estimates popula-tion-specific FST coefficients, therefore allowing for differ-ent demographic histories and differdiffer-ent amounts of genetic drift between populations. The method is based on a logistic regression model in which each logit value of genetic differentiation FST (i, j) for locus i in population j is decomposed as a linear combination of the coefficients of the logistic regression, αi and βj, corresponding, respec-tively, to a locus effect and to a population effect. To iden-tify adaptive loci, we focused on the posterior distribution of αi: a positive value suggests that locus i is subject to adaptive selection, whereas a negative value suggests that balancing selection is tending to homogenize allele fre-quencies over the populations. The posterior probability of locus i being under selection is estimated by defining two alternative models, one that includes αi and another that excludes it. The respective posterior probabilities of these two models are estimated using a Reversible Jump Markov Chain Monte Carlo (MCMC) approach [9]. The posterior probability that a locus is subject to selection, corresponding to P (αi ≠ 0), is then estimated from the output of the MCMC by counting the number of times αi is included in the model. Another advantage of the Baye-sian method compared with the frequentist method (Dfdist), is that it explicitly takes all loci into account in the analyses. Finally, the Bayesian approach also deals with the problem of multiple testing of a large number of genomic locations, as the number of tested loci is taken into account through the prior distribution. In this study, for the population and locus effects Gaussian priors with means of -2 and zero were used with standard deviations of 1.8 and 1, respectively, according to Beaumont and Balding [10]. The estimation of model parameters was
automatically tuned on the basis of short pilot runs (10 pilot runs, length 2000). Preliminary tests indicated that a burn-in of 10 000 iterations was enough to have the MCMC converging. The sample size was set to 10 000 and the thinning interval to 50 as suggested by Foll and Gag-giotti [9], resulting in a total chain length of 500 000 iter-ations. Four independent runs were performed for each of the two datasets to account for the consistency of the detected outliers. The loci were ranked according to their estimated posterior probability and all loci with a value over 0.79 were retained as outliers. This corresponds to a Bayes Factor >3 as defined by Jeffreys [37], which provides substantial support for acceptation of the model.
In practice, applying population genetic approaches requires to define populations. We defined 5 different population-based structures in order to disentangle abi-otic and biabi-otic factors (Figure 1). Separate analyses were done for these 5 structures using both Dfdist and BayeS-can. We firstly grouped individuals according to their geo-graphic origin only (4 populations: Finland, Limousin, Ardeche, and Landes; population size 83, 115, 78 and 20 respectively) (structure 1, Figure 1), and secondly, accord-ing to their geographic origin and host-plant (7 popula-tions: Finland Pine, Finland Spruce, Limousin Pine, Limousin Spruce, Ardeche Pine, Ardeche Spruce and Landes Pine; population size 38, 45, 30, 85, 28, 50 and 20 respectively) (structure 2, Figure 1). Finally, within each of the three regions where both alternative host-plants are found (Finland, Limousin, and Ardeche), pairwise com-parisons of host-plant samples were performed (structure 3, 4, 5, Figure 1). Multiple independent pairwise compar-isons of populations submitted to the same ecological constraints in different geographic areas allow confirma-tion of the involvement of a putative outlier in adaptaconfirma-tion to contrasting situations, in our case alternative host-plants.
Outlier detection using a correlative approach
Our objective was to assess the effect of the host-plant var-iable versus all the other measurable varvar-iables potentially involved in genetic differentiation. These include eleva-tion, 9 climatic variables and geographic coordinates of the sites. Preliminary analyses have shown strong correla-tions between climatic variables and site geographic coor-dinates. We therefore decided to remove geographic coordinates since it was not possible, given our sampling design, to disentangle the effect of climate from the effect of geography. This would not affect our conclusion about the potential effect of host-plant type. To avoid correla-tion between the explanatory variables, a principal com-ponent analysis (PCA) was applied on the correlation matrix of climatic and elevation variables. The two first axes of the PCA represent the best way to represent varia-tion in environmental abiotic factors at the studied scale.
Multiple logistic regressions with a logit link and bino-mial error distribution [38] were then used to explain the presence and absence of each marker by the coordinates of the two first axes of PCA (orthogonal predictors) repre-senting environmental abiotic variables, the host-plant variable and all the three possible interactions between these three explanatory variables. Models were fitted using a maximum likelihood method [38]. We used backwards elimination to select the variables in the final models using Akaike's information criterion (AIC). Then, for each selected model, we also tested each regression coefficient with a likelihood ratio test [38]. The significance of the likelihood ratio tests were tested using a Bonferroni cor-rection to correct for multiple testing (significance level = 0.05/83 where 83 is the number of markers = 6 × 10⁻⁴). Although initially all explanatory variables were potential predictors, only those variables selected by the above cri-teria were used in the final models. False discovery rates were also calculated using the type I error of 0.0006. All analyses were conducted using R software [36].
Isolation by distance pattern on neutral loci
To test for isolation by distance on neutral loci, we applied a Mantel test between genetic and Euclidian geographic distances calculated between the 16 sites. Genetic dis-tances were computed with AFLP-SURV 1.0 [26] as pair-wise FST using the Bayesian method with non-uniform prior distribution to estimate allele frequencies with dom-inant markers [32]. Geographic distances (in km) and Mantel tests were calculated using R software [36]. We not only tested the relation between FST/(1-FST) and the geo-graphic distance (km), but also used the logarithm of the geographic distance as recommended by Rousset [39].
Authors' contributions
SM performed the statistical analysis and drafted the man-uscript. CC participated to the design and carried out the molecular analysis. LD conceived the study, performed the population genetic analyses, coordinated and drafted the manuscript. All the authors read and approved the final manuscript.
Acknowledgements
The authors thank G. Lempérière and H. Viiri (Forest Research Institute, Finland) for collecting weevils, M. Foll and O. Gaggiotti for their helpful comments and H. McCombie-Boudry for correcting our English.
References
1. Black WC, Baer CF, Antolin MF, DuTeau NM: Population
genom-ics: genome-wide sampling of insect populations. Annual
Review of Entomology 2001, 46:441-469.
2. Schlötterer C: Hitchhiking mapping-functional genomics from
the population genetics perspective. Trends in Genetics 2003, 19:32-38.
3. Stinchcombe JR, Hoekstra HE: Combining population genomics
and quantitative genetics: finding the genes underlying eco-logically important traits. Heredity 2008, 100:158-170.
4. Bonin A, Miaud C, Taberlet P, Pompanon F: Explorative genome
Publish with BioMed Central and every scientist can read your work free of charge "BioMed Central will be the most significant development for disseminating the results of biomedical researc h in our lifetime."
Sir Paul Nurse, Cancer Research UK Your research papers will be:
available free of charge to the entire biomedical community peer reviewed and published immediately upon acceptance cited in PubMed and archived on PubMed Central yours — you keep the copyright
Submit your manuscript here:
http://www.biomedcentral.com/info/publishing_adv.asp
BioMedcentral
of altitude in the common frog (Rana temporaria). Molecular
Biology and Evolution 2006, 23:773-783.
5. Despres L, Loriot S, Gaudeul M: Geographic pattern of genetic
variation in the European globeflower Trollius europaeus L. (Ranunculaceae) inferred from amplified fragment length polymorphism markers. Molecular Ecology 2002, 11:2337-2347.
6. Emelianov I, Marec F, Mallet J: Genomic evidence for divergence
with gene flow in host races of the larch budmoth. Proceedings
of the Royal Society of London, Series B 2004, 271:97-105.
7. Beaumont MA, Nichols RA: Evaluating loci for use in the genetic
analysis of population structure. Proceedings of the Royal Society
of London, Series B 1996, 263:1619-1626.
8. Wood HM, Grahame JW, Humphray S, Rogers J, Butlin RK:
Sequence differentiation in regions identified by a genome scan for local adaptation. Molecular Ecology 2008, 17:3123-3135.
9. Foll M, Gaggiotti O: A genome scan method to identify selected
loci appropriate for both dominant and codominant mark-ers: a bayesian perspective. Genetics 2008, 180:977-993.
10. Beaumont MA, Balding DJ: Identifying adaptive genetic
diver-gence among populations from genome scans. Molecular
Ecol-ogy 2004, 13:969-980.
11. Storey JD, Tibshirani R: Statistical significance for genomewide
studies. Proceedings of the National Academy of Sciences of the United
States of America 2003, 100:9440-9445.
12. Holderegger R, Herrmann D, Poncet B, Gugerli F, Thuiller W, Taber-let P, Gielly L, Rioux D, Brodbeck S, Aubert S: Land ahead: Using
genome scans to identify molecular markers of adaptive rel-evance. Plant Ecology and Diversity 2008, 1:273-283.
13. Bonin A, Pompanon F, Taberlet P: Use of Amplified Fragment
Length Polymorphism (AFLP) markers in surveys of verte-brate diversity. In Molecular Evolution: Producing the Biochemical
Data, Part B Volume 395. Edited by: Zimmer EA, Roalson E. New York City: Academic Press; 2005:145-161.
14. Joost S, Bonin A, Bruford MW, Despres L, Conord C, Erhardt G, Tab-erlet P: A spatial analysis method (SAM) to detect candidate
loci for selection: towards a landscape genomics approach to adaptation. Molecular Ecology 2007, 16:3955-3969.
15. Jump AS, Hunt JM, Martinez-Izquierdo JA, Penuelas J: Natural
selec-tion and climate change: temperature-linked spatial and temporal trends in gene frequency in Fagus sylvatica.
Molecu-lar Ecology 2006, 15:3469-3480.
16. Egan SP, Nosil P, Funk DJ: Selection and genomic differentiation
during ecological speciation: Isolating the contributions of host association via a comparative genome scan of Neoch-lamisus bebbianae leaf beetles. Evolution 2008, 62:1162-1181.
17. Nosil P, Egan SP, Funk DJ: Heterogeneous genomic
differentia-tion between walking-stick ecotypes: "Isoladifferentia-tion by adapta-tion" and multiple roles for divergent selection. Evolution
2008, 62:316-336.
18. Campbell D, Bernatchez L: Generic scan using AFLP markers as
a means to assess the role of directional selection in the divergence of sympatric whitefish ecotypes. Molecular Biology
and Evolution 2004, 21:945-956.
19. Berlocher SH, Feder JL: Sympatric speciation in phytophagous
insects: moving beyond controversy? Annual Review of
Entomol-ogy 2002, 47:773-815.
20. Dres M, Mallet J: Host races in plant-feeding insects and their
importance in sympatric speciation. Philosophical Transactions of
the Royal Society of London Series B-Biological Sciences 2002,
357:471-492.
21. Via S: Reproductive isolation between sympatric races of pea
aphids. I. Gene flow restriction and habitat choice. Evolution
1999, 53:1446-1457.
22. Day K, Nordlander G, Kenis M, Halldorson G: General biology and
life cycles of bark weevils. In Insects in Living Trees in Europe, a
Syn-thesis Edited by: Lieutier FDK, Battisti AGJ, Evans HF. Dordrecht: Klu-wer Academi; 2004:331-349.
23. Thorpe K, Day KR: The impact of host plant species on the
lar-val development of the large pine weevil Hylobius abietis L.
Agricultural and Forest Entomology 2002, 4:187-194.
24. von Sydow F, Bigersson G: Conifer stump condition and pine
weevil (Hylobius abietis) reproduction. Canadian Journal of
For-est Research 1997, 22:1254-1262.
25. Conord C, Lemperiere G, Taberlet P, Despres L: Genetic
struc-ture of the forest pest Hylobius abietis on conifer plantations at different spatial scales in Europe. Heredity 2006, 97:46-55.
26. Vekemans X, Beauwens T, Lemaire M, Roldan-Ruiz I: Data from
amplified fragment length polymorphism (AFLP) markers show indication of size homoplasy and of a relationship between degree of homoplasy and fragment size. Molecular
Ecology 2002, 11:139-151.
27. Excoffier L, Hofer T, Foll M: Detecting loci under selection in a
hierarchically structured population. Heredity 2009, 103:285.
28. Excoffier L, Ray N: Surfing during population expansions
pro-motes genetic revolutions and structuration. Trends in Ecology
& Evolution 2008, 23:347-351.
29. Vaughan I, Ormerod S: Improving the quality of distribution
models for conservation biology by addressing shortcomings in the field collection of training data. conservation biology 2003, 17:1601-1611.
30. Conord C, Despres L, Vallier A, Balmand S, Miquel C, Zundel S, Lem-periere G, Heddi A: Long-term evolutionary stability of
bacte-rial endosymbiosis in Curculionoidea: additional evidence of symbiont replacement in the Dryophthoridae family.
Molec-ular Biology and Evolution 2008, 25:859-868.
31. Tsuchida T, Koga R, Fukatsu T: Host plant specialization
gov-erned by facultative symbiont. Science 2004, 303:1989-1989.
32. Zhivotovsky LA: Estimating population structure in diploids
with multilocus dominant DNA markers. Molecular Ecology
1999, 8:907-913.
33. Bonin A, Ehrich D, Manel S: Statistical analysis of amplified
frag-ment length polymorphism data: a toolbox for molecular ecologists and evolutionists. Molecular Ecology 2007, 16:3737-3758.
34. Luikart G, England PR, Tallmon D, Jordan S, Taberlet P: The power
and promise of population genomics: from genotyping to genome typing. Nature Reviews Genetics 2003, 4:981-994.
35. Caballero A, Quesada H, Rolan-Alvarez E: Impact of amplified
fragment length polymorphism size homoplasy on the esti-mation of population genetic diversity and the detection of selective loci. Genetics 2008, 179:539-554.
36. Team RDC: R: A language and environment for statistical
computing. R Foundation for Statistical Computing 2008.
37. Jeffreys H: Theory of probability Third edition. Oxford Universityt press; 1961.
38. McCullagh P, Nelder J: Generalized linear models. London, UK: Chapman & Hall; 1989.
39. Rousset F: Genetic differentiation and estimation of gene flow
from F-statistics under isolation by distance. Genetics 1997, 145:1219-1228.