HAL Id: hal-01714182
https://hal.archives-ouvertes.fr/hal-01714182
Submitted on 12 Feb 2019
HAL is a multi-disciplinary open access
archive for the deposit and dissemination of
sci-L’archive ouverte pluridisciplinaire HAL, est
destinée au dépôt et à la diffusion de documents
Fatima Harrak, François Bouchet, Vanda Luengo, Pierre Gillois
To cite this version:
Fatima Harrak, François Bouchet, Vanda Luengo, Pierre Gillois. Profiling Students from Their
Ques-tions in a Blended Learning Environment. LAK ’18 - 8th International Conference on Learning
Analytics and Knowledge, Mar 2018, Sydney, Australia. pp.102-110, �10.1145/3170358.3170389�.
�hal-01714182�
Profiling Students from Their Questions
in a Blended Learning Environment
Fatima Harrak
Sorbonne Universités UPMC Univ Paris 06, CNRS, LIP6 UMR 7606, 4 place Jussieu, 75005 Paris, France
François Bouchet
Sorbonne Universités UPMC Univ Paris 06, CNRS, LIP6 UMR 7606, 4 place Jussieu, 75005 Paris, France
Vanda Luengo
Sorbonne Universités UPMC Univ Paris 06, CNRS, LIP6 UMR 7606, 4 place Jussieu, 75005 Paris, France
Pierre Gillois
Université Grenoble Alpes 621 avenue Centrale, 38400
Saint-Martin-d'Hères, France
ABSTRACT
1Automatic analysis of learners’ questions can be used to improve their level and help teachers in addressing them. We investigated questions (N=6457) asked before the class by 1st year medicine/pharmacy students on an online platform, used by professors to prepare their on-site Q&A session. Our long-term objectives are to help professors in categorizing those questions, and to provide students with feedback on the quality of their questions. To do so, first we manually categorized students’ questions, which led to a taxonomy then used for an automatic annotation of the whole corpus. We identified students’ characteristics from the typology of questions they asked using K-Means algorithm over four courses. The students were clustered by the proportion of each question asked in each dimension of the taxonomy. Then, we characterized the clusters by attributes not used for clustering such as the students’ grade, the attendance, the number and popularity of questions asked. Two similar clusters always appeared: a cluster (A), made of students with grades lower than average, attending less to classes, asking a low number of questions but which are popular; and a cluster (D), made of students with higher grades, high attendance, asking
Permission to make digital or hard copies of part or all of this work for personal or classroom use is granted without fee provided that copies are not made or distributed for profit or commercial advantage and that copies bear this notice and the full citation on the first page. Copyrights for components of this work owned by others than ACM must be honored. Abstracting with credit is permitted. To copy otherwise, or republish, to post on servers or to redistribute to lists, requires prior
more questions which are less popular. This work demonstrates the validity and the usefulness of our taxonomy, and shows the relevance of this classification to identify different students’ profiles.
CCS CONCEPTS
• Computing methodologies~Unsupervised learning • Computing methodologies~Cluster
analysis • Applied computing~E-learning
KEYWORDS
Clustering, question taxonomy, student’s behavior, blended learning.
1 INTRODUCTION
Studying learners’ questions while they learn is essential, not only to understand their level and thus help them learn better [16], but also to help teachers in addressing these questions. In this paper, we are interested in whether the type of questions asked by students on an online platform can be related to their performance and their overall learning behavior. We investigate this question in the context of an hybrid curriculum (like [12]), in which every
specific permission and/or a fee. Request permissions from
LAK '18, March 7–9, 2018, Sydney, NSW, Australia
© 2018 Association for Computing Machinery. ACM ISBN 978-1-4503-6400-3/18/03 $15.00 https://doi.org/10.1145/3170358.3170389
week students have to ask questions regarding the online material they studied at home (following a flipped classroom approach), before the class, to help professors prepare their Q&A session. More precisely, our goal was to answer to 3 research questions: (RQ1) Is it possible to define a taxonomy of questions to analyze students’ questions? (RQ2) Can identification of students’ questions be automatized? (RQ3) Are annotated questions asked by a student related to their profile, i.e. is there a relationship between the type of questions asked by a student and their characteristics, in particular in terms of performance?
2 RELATED WORK
The first part of our work consists in the definition of a taxonomy of questions. Question taxonomies have been proposed in different application domains. Graesser and Person [9] proposed a question taxonomy based on their study which investigated the questions asked during tutoring sessions on college research methods and algebra. They developed this taxonomy to be used for automatic question generation. Although developed independently, we noticed a posteriori some overlap between their taxonomy and ours, in particular for categories “verification”, “example” and “definition”. However, in our case, beyond the taxonomy of questions, we focus on identifying students' characteristics and the relationships between questions type and their behavior. Bouchet [2] proposed a taxonomy of assistance requests made to an assistant conversational agent, which was distinguishing direct and indirect assistance requests, but which is too coarse-grained for our needs here. Work has also been done by Chin et al. [6-7] to identify which questions are indicative of deep vs. shallow learning for middle school students learning about science in a classroom context. Efron et al. [8] developed a taxonomy of questions asked on the microblogging service “Twitter” and found that people used Twitter as an informal social service, asking questions for factual information or clarification, which is considered as one of the most difficult categories to identify. Their taxonomy is applicable for spontaneous interactions, which is not relevant for our context.
The second part of this article is relative to the automatization of question identification. A domain in which questions have been particularly studied, although not directly related to education, is question answering (QA). In general, question answering systems’ objective is to improve answer quality and to decrease human efforts by extracting from a large set of documents the most relevant information to answer to a given question. Therefore, QA systems provide a general framework for parsing questions, searching documents, and retrieving relevant answers. For instance, the automated system AskHERMES [5] helps physicians extract and articulate
2paces.medatice-grenoble.fr
multimedia information especially in response to complex clinical questions. Some QA systems use semantic-based and ontology-based approaches [11]. Behind the scene, machine learning techniques are used to generate helpdesk responses, for instance with clustering techniques [13] or through supervised machine learning approaches [17]. Finally, our last step consists in characterizing students based on the questions they ask. In online learning, much research has focused on analyzing student learning behaviors in online communications. Various frameworks have been proposed for characterizing and analyzing computer-mediated communications in the context of e-mail and chat exchanges [4], collaborative discussions [14], and knowledge sharing [15], but none to identify students’ behavior from a given typology of questions. Closer from our work, using natural language processing techniques, Kim et al. [10] helped students participating in online discussions by retrieving useful messages, and then used supervised machine learning approaches to classify students’ messages as questions or answers to analyze the distribution of student participation by gender.
3 RESEARCH METHODOLOGY
3.1 Data Considered
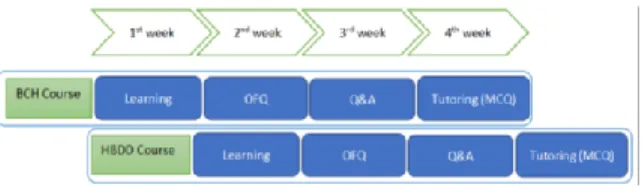
The dataset is made of questions asked in 2012 by 1st year medicine/pharmacy students from a major public French university (Université Joseph-Fourier). The Faculty of Medicine and Pharmacy has a specific hybrid training system (part of work is done remotely and the other part in classroom) for their 1st year students. The 1st year (called PACES) takes place over a year divided into two semesters. Each semester ends with a competitive exam (January and May) on the content studied during the period. A proportion of the students who failed in the competitive exam is allowed to retake the year only once. Each course is made of 4 to 6 4-week sequences on the PACES2 platform, as illustrated in Fig. 1.
Figure 1: Learning activities over a sequence (4 weeks) / course
In every sequence, the first week consists in studying the course on a DVD-ROM or on the website Medatice (slides + videos from the professor). The second week is dedicated to the Online Formulation of Questions (OFQ)
Profiling students from their questions LAK’18, March 2018, Sydney, Australia
3
for teachers: these questions relate exclusively to the multimedia courses studied the previous week. Students can see questions asked by other students in their group and vote for them if they also want an answer to that question, but cannot answer to them. At the end of the week, the questions are sent to the adjunct professors intervening during the third week, who use them to structure their interactive classroom teaching sessions. During these sessions, the professor answers to some of the questions asked by students from the online form. The fourth week is dedicated to tutoring sessions in order to test the knowledge acquired during the training sequence through self-testing using MCQ, which are then corrected with an adjunct professor. There are two tutoring sessions of 2 hours/week (about 48 sessions/year and 40 MCQ/session). Each student can individually check their grades and rankings relatively to the overall promotion. These tutoring results allow students to assess the quality of their learning. Therefore, for each of the 13 courses we have 4 to 6 sets of questions asked by 429 students (6457 questions overall) during the 2nd week of each period. Not
all courses received the same number of questions: in particular, courses from the 1st semester received more
questions, because some students are forced to quit at the end of the 1st semester, based on their results in the exam.
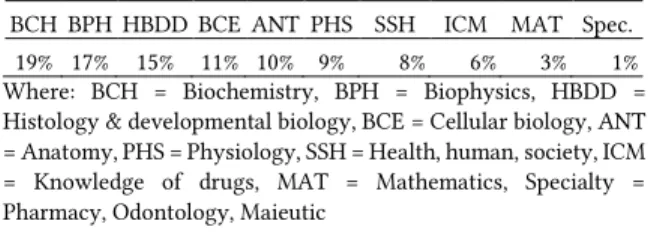
The questions distribution per course is shown in Table 1.
Table 1: Distribution of questions asked/course
BCH BPH HBDD BCE ANT PHS SSH ICM MAT Spec.
19% 17% 15% 11% 10% 9% 8% 6% 3% 1%
Where: BCH = Biochemistry, BPH = Biophysics, HBDD = Histology & developmental biology, BCE = Cellular biology, ANT = Anatomy, PHS = Physiology, SSH = Health, human, society, ICM = Knowledge of drugs, MAT = Mathematics, Specialty = Pharmacy, Odontology, Maieutic
3.2
Categorization of questions
To answer to RQ1, we took a sample of 800 questions (12% of the corpus size) from two courses (biochemistry [BCH], the histology & developmental biology [HBDD]), considered by the pedagogical team to be among the most difficult ones and had the highest number of questions asked (cf. Table 1). This sample was randomly divided into 4 sub-samples of 200 questions to apply 4 categorization steps: (1) a discovery step, (2) a consolidation step, (3) a validation step and (4) an evaluation step.
(1) The discovery step consisted in empirically grouping sentences with similarities to extract significant concepts. Although students were instructed to ask simple questions (i.e. centered on a single topic, avoiding questions such as “Could you re-explain X? Also, Y wasn’t clear”), we found that a significant subset of the questions
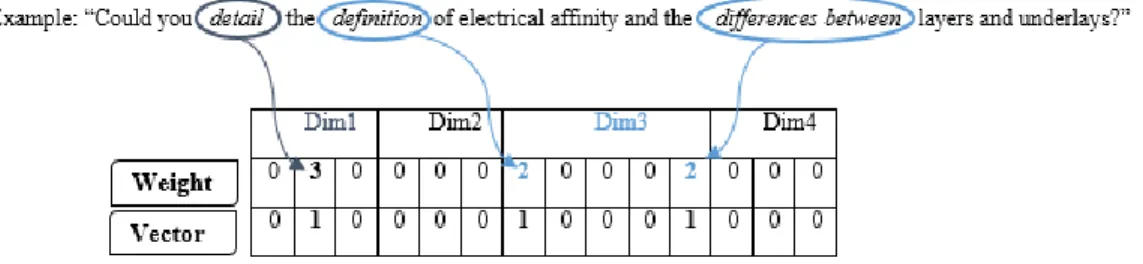
could be broken down into several independent questions in 40% of the cases. Once sentences were segmented into so-called simple questions, we grouped questions that appeared similar in structure (e.g. “what is X?” and “what is Y?”) and in meaning (e.g. “what is X? and “could you define X?”). Groups of questions were then given “labels” (e.g. “definition of a concept”) which could be grouped into higher level categories. Then we identified mutual exclusion between labels (e.g. a simple question cannot be both verification and a request for a re-explanation), and conversely, labels that could co-occur (e.g. both a verification and a re-explanation could be relative to the final exam). This led us to define a set of what we called dimensions, each of them containing a set of categories (the mutually exclusive labels), providing the values associated to the dimension. It was then possible to associate keywords or idiomatic expressions to each value in each dimension (e.g. Dimension1, value Re-explain: re-explain, restate, redefine, retry, repeat, revise, retake, resume, etc.). Each simple question can then be associated with an annotation, i.e. the unique value associated to it according to each dimension (cf. Fig. 2 for an example of annotation showing how certain keywords are used to lead to a representation of a question as a vector).
(2) The consolidation step consisted in annotating the second sub-sample to validate the dimensions and values previously identified. This led to various adjustments to the dimensions to make sure they were indeed independent from each other (e.g. addition of the value “correction” in Dim2, not previously identified).
(3) In the validation step, we performed a double annotation to validate the generality of our categories on the third sub-sample of 200 sentences (previously segmented to work on the same subset of sentences). Two human annotators used as a unique reference the taxonomy created at the end of the previous step. They made two separate and independent annotations of each dimension, and their agreement was evaluated using Cohen’s Kappa (K1=0.72, K2=0.62 where K1 and K2 correspond respectively to the Kappa for Dim1 and Dim2). Dim3 was created after this step and therefore was not annotated and the questions annotated in Dim4 were not similar for the both annotators because it is optional. Then they met to discuss and resolve the disagreements, which mostly corresponded to ambiguous cases. This led to a final refinement to the categories (e.g. separation of categories Dim1 and Dim4, addition of category Dim3). Eventually, the entire sample (600 sentences) was entirely re-annotated to consider the changes and to provide a grounded truth to which the automatic annotation could be compared to. This final version of the taxonomy is provided in Table 2, with the four final dimensions.
(4) Finally, in the evaluation step, the last sub-sample of 200 sentences was annotated manually by the two expert annotators (with an increased kappa of 0.83 on Dim1, 0.76 on Dim2 and 0.47 on Dim3). This sub-sample,
not used for the training of the automatic annotator was used for its testing (cf. section 3.3).
To annotate automatically the rest of the data, some rules were established from the manual annotation:
─ All the questions must be simple (i.e. combined questions have to be segmented into several simple ones).
─ The annotation must be unique on each dimension (i.e. a simple question can correspond to the category “deepen a concept” or to “re-explain a concept”, but not both) ─ Dimension 4 is annotated only for the questions identified as verification on dimension 1. This dimension is the most difficult one to identify automatically because it would ideally require some form of semantic analysis.
Figure 2: Example of an automatic annotation of a question using weighted keywords Table 2: Final question taxonomy from manual annotation
Dim1 Question type Description Keywords
1 Re-explain / redefine Ask for an explanation already done in the course material Re-explain, restate, revise,
repeat, resume, retry...
2 Deepen a concept Broaden a knowledge, clarify an ambiguity or request for a better
understanding
Explain, detail, precise, develop, describe...
3 Validation / verification Verify or validate a formulated hypothesis Can we, is it...
Dim2 Explanation modality /
Subject of question Description Keywords
0 N/A None – attributed when neither of the other values below applies
1 Example Example application (course/exercise) Example…
2 Schema Schema application or an explanation about it Schema, representation…
3 Correction Correction of an exercise in course/exam Correction, response…
Dim3 Explanation type Description Keywords
0 N/A None – attributed when neither of the other values below applies
1 Define Define a concept or term Define, signify, mean…
2 Manner (how?) The manner how to proceed How…
3 Reason (why?) Ask for the reason Why, reason…
4 Roles (utility?) What’s the use / function Role, utility, function…
5 Link between concepts Verify a link between two concepts, define it Matches, difference
between, relation, similar…
Dim4 Verification type (optional) Description Keywords
1 Mistake / contradiction Detect mistake/contradiction in course or explanation of teacher Contradiction, mistake…
2 Knowledge in course Verify knowledge (*)
3 Exam Verify information about an exam Exam, should we know, …
(*) There are no specific keywords in this subcategory because the knowledge in course would require a semantic analysis. Therefore, this
subcategory is annotated only if the question of verification is not a verification of mistake or exam (Dim4-1 and Dim4-3 are not annotated).
3.3 Automatic annotation
To answer to RQ2 and to annotate the whole corpus (and on the long term, to use it online to analyze the questions collected), we have chosen to use NLTK (Natural
Language Toolkit), a major library in Python to handle natural language data. The main challenge was the lack of a French corpus in the medical area studied here.
First, we identified keywords representative of each value in each dimension (cf. Fig. 2). Then we developed an automatic tagger which identifies for each question the
Profiling students from their questions LAK’18, March 2018, Sydney, Australia
5
main value associated to each dimension and tag the question as such, aggregating thereafter the values within the same dimension to have a binary annotation vector (as seen in the example of Fig. 2). To resolve the problem of ambiguity of the automatic annotation (e.g. in the example in the Fig. 2, the subcategories dim3-1 and dim3-5 annotated in the same question) within the dimension, we attributed different weights to keywords of each dimension (e.g. explain: 7, what/how: 3). However, there were questions (about 1% of the corpus) that were still ambiguous after this annotation (cf. Fig. 2, the words “definition” and “differences between” had the same weight (2) within dimension 3). In this case, the question was considered annotated in each subcategory separately. Finally, we used the sample of 200 questions from the evaluation step (cf. section 3.2) to evaluate the automatic tagger. The Kappa values per dimension are given in Table 3 for the annotations coming from both expert annotators.
Table 3: Kappa values between Automatic and Manual Annotation
Dimensions Dim1 Dim2 Dim3 Dim4
Kappa 1
Kappa 2 0.70 0.78 0.50 0.69 0.49 0.55 0.77 0.82
We consider that the kappa values obtained (between 0.61 and 0.71) were high enough to apply the automatic annotator to the full corpus, although this type of decision is always partially arbitrary [1]. Moreover, those values include unannotated sentences (tagged as ‘0’ by the annotator in all dimensions because they did not match any of the known patterns). For instance, without
unannotated questions, the kappa values on dimension 1 are between 0.82 and 0.88, for both human annotators.
Overall, we have therefore positively answered to RQ1 and 2: not only have we successfully defined a taxonomy of questions relevant for our goal, but we have been able to automatize the annotation of questions using this taxonomy, thus allowing us to automatically annotate all the sentences in the corpus (and potentially annotate future students’ questions).
4 IDENTIFYING LINKS BETWEEN
QUESTIONS AND BEHAVIOR
Our goal is now to try to address RQ3, which is to know if the questions asked by a student can be informative of their characteristics. Ideally, we would also want to identify characteristics that are generic enough, i.e. not specific to only one particular course, so we decided to consider 4 of the courses that had received the most questions: BCH, HBDD, BCE and ANT (the latter being the only course of the 2nd semester to have received a large
number of questions). One of the most obvious students’ characteristic is the students’ level, as indicated by their grade in the final exam at the end of the year. We decided to distinguish two types of students: the good students (whose rank in the final exam is superior to 200th – which
corresponds to the students allowed to move up to the 2nd
year of PACES) and the average ones (whose rank is between 200th and 600th). The students with a rank
superior to 600th generally did not ask enough questions to
be considered here. Moreover, teachers usually consider that students over rank 600th do not really have a chance
to pass the final exam, even with their assistance, and generally want to focus more on average students.
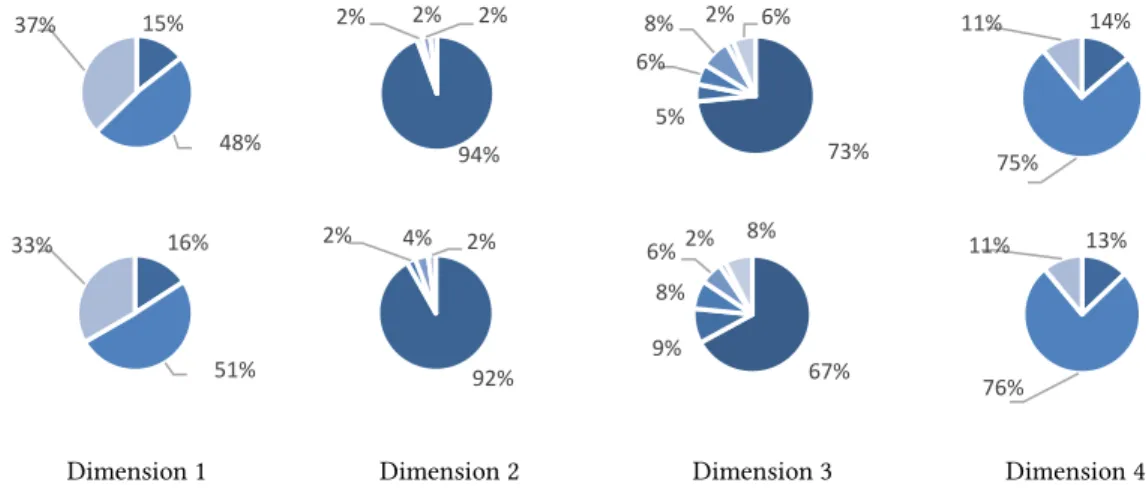
Dimension 1 Dimension 2 Dimension 3 Dimension 4
Figure 3: Proportions of questions on the 4 dimensions across the 4 considered courses (top row = good students, bottom row = average students)
(colors: from dark blue [0 or 1] to light blue [the maximum value for that dimension])
14% 75% 11% 15% 48% 37% 94% 2% 2% 2% 73% 5% 6% 8% 2% 6% 16% 51% 33% 92% 2% 4% 2% 67% 9% 8% 6%2% 8% 13% 76% 11%
4.1 Are the proportions of questions
characteristics of students’ level?
First, we assumed that good and average students would be asking significantly different questions, which led us to specify our RQ3 into RQ3.1: “are there questions that are characteristics of good or average students?”. Unfortunately, a visual exploration of the data for each dimension across the 4 courses did reveal any clear trend (cf. Fig. 3), which quickly led us to reply negatively to RQ3.1 without the need for advanced statistical comparisons between the two populations.
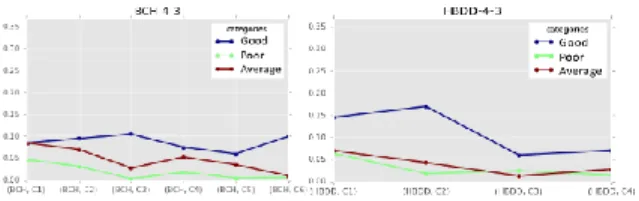
4.2 Is the dynamics of questions asked
characteristic of the students’ level?
Our second hypothesis was that the dynamics of questions asked by the students could be indicative of their level. For instance, we could assume that good students would tend to ask more complex questions towards the end of the course, because they have already acquired a solid understanding of the basic concepts during the first weeks. This led us to formulate RQ3.2 as “are there temporal patterns of questions asked that are characteristics of good or average students?”. To investigate this question, we started again by a visual data exploration, comparing the proportion of questions asked by students each week in each dimension. An example of such a visualization is shown in Fig. 4. In particular, we were looking for opposite patterns between good and average students – in our previous example, we could think that contrary to good students, the proportion of complex questions asked by average students would not increase towards the last weeks. Table 4 presents a systematic overview of the difference in trends between the categories of students. Unfortunately, the results showed that even if some dimensions seemed to be important in distinguishing good from average students (for instance dimension 4-3, i.e. verification question about the exams), and that there may exist ways to distinguish good from average students based on the type of questions they asked (e.g. an increase in questions about a deeper explanation for good students in ANT, whereas a decrease was observed for average students), the trends were different across the courses. Therefore, the answer to our RQ3.2 was that such patterns may exist, and it is then necessary to consider not only the raw proportion of questions of each type, but also their dynamics across the course. However, this dynamic seems to be very course-related, which led us to perform our following analyses separately on each course, instead of trying to group questions across the courses.
Figure 4: Pattern difference of good vs. average students on dim. 4-3 for BCH (left) /HBDD (right)
4.3 Are students’ characteristics related to
the questions they asked?
Our third and final hypothesis was that students’ questions may indicate something subtler than their mere level (good vs. average), such as whether they were regularly missing courses or whether they were taking this course for the 2nd
time. Moreover, it may be a combination of questions and not only a single dimension that needs to be considered. This led us to reify RQ3.3 as “do students who ask the same patterns of questions share similar profile characteristics?”. To answer to this question, we performed an analysis in 2 steps, similar to [3], where we started by extracting clusters of students, and then we tried to identify the characteristics distinguishing each of them.
First, we performed four separate clustering analyses using the K-Means algorithm (with k between 2 and 10) over four datasets: students who asked questions in the BCH (1227 questions by N1=244 students), HBDD (979
questions by N2=201 students), BCE (685 questions by
N3=114 students), and ANT courses (649 questions by
N4=75 students). We performed the clustering using as
features for each student the proportion of each question asked in each dimension (e.g. the proportion of questions with value 1 in dimension 1) asked (a) overall, (b) during the first half of the course and (c) during the second half of the course (44 features overall). Distinguishing (b) and (c) in addition to (a) allowed us to take into account the dynamics of questions (as suggested by our answer to RQ3.2), more than the overall distribution. We obtained 4 clusters for BCH and HBDD and 3 clusters for BCE and ANT, which centroids are provided in Table 5.
We have also tried to reduce the number of features for the clustering using a feature selection technique to show up most important and discriminant features for all courses (although a Principal Component Analysis could also lead to that result, the difficulty to interpret the dimensions extracted is an issue when the aim is to present them to teachers). Because of the differences across courses, we performed this on each course individually (e.g. the feature prop_d1-1 is more important for BCH than BCE especially in the 1st half of the course - cf. Table 5).
Profiling students from their questions LAK’18, March 2018, Sydney, Australia
7
Table 4: The evolution of students along the weeks of each course/dimension
Course Dim Good Average Contradictory behavior
ANT 5 weeks 1-2 2-2 3-5 4-3 Increase Decrease/increase Increase Stable Decrease Stable/decrease Decrease/stable Increase 1 week 2 weeks 2 weeks 1 week BCE 5 weeks 2-2 3-5 4-3 Decrease/increase Increase/decrease Decrease/increase Increase/stable Decrease/increase Increase/decrease 2 weeks 2 weeks 2 weeks BCH 6 weeks 1-2 1-3 2-2 3-5 4-1 4-3 4-2 Increase/decrease Increase/decrease Decrease/increase Increase/decrease Decrease/increase Increase/decrease Increase/decrease Decrease/increase Decrease/increase Increase/decrease Decrease/increase Increase/decrease Decrease/increase Decrease/increase 4 weeks 6 weeks 4 weeks 2 weeks 6 weeks 5 weeks 6 weeks HBDD
4 weeks 3-5 4-3 Increase/decrease Increase/decrease Decrease/increase Decrease 3 weeks 1 week
We obtained 4 new clusters for BCH, HBDD, BCE and ANT with a number of features selected varying between 7 and 14. To compare these new clusterings with the previous ones, we used the silhouette coefficient which a measure of consistency within the clusters (between -1 and 1), where a high value indicates that an element is well matched to is own cluster and poorly matched to neighboring clusters. When calculating the silhouette coefficient for the four clusterings to measure the cohesion and the quality of the new clusters, the values varied between .23 and .34 (vs. between .19 and .23 for the clusterings with 44 features). Due to the modest increase in the quality of clusters and the additional difficulty of reporting different dimensions for each course, we therefore focus in the remainder of this paper on the original clusterings using 44 features.
The second step consisted in characterizing the clusters by considering seven attributes not used for the clustering: (a) students’ average grade (AvgGrd) on the weekly tutoring sessions (out of 20) and (b) grade in the final exam (FinGrd) on this course (out of 20), (c) global attendance ratio (over the 2 semesters - GlbAtt) and (d) attendance for the considered course (CouAtt - from 0 (never there) to 1 (always there)), (e) the proportion of students who were retaking the year (RetStu), (f) the number of questions asked in this course (NbQst) and (g) the number of votes from other students on their questions in this course (NbVot). Descriptive statistics for these variables and for each of the four courses are provided in Table 6 – cluster naming has been chosen to match the similar characteristics identified further.
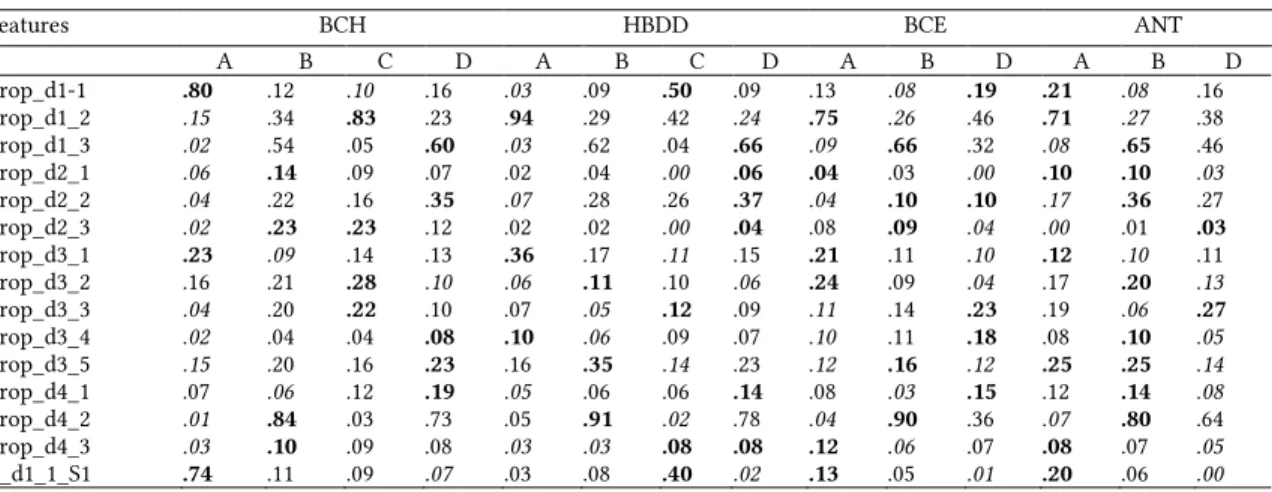
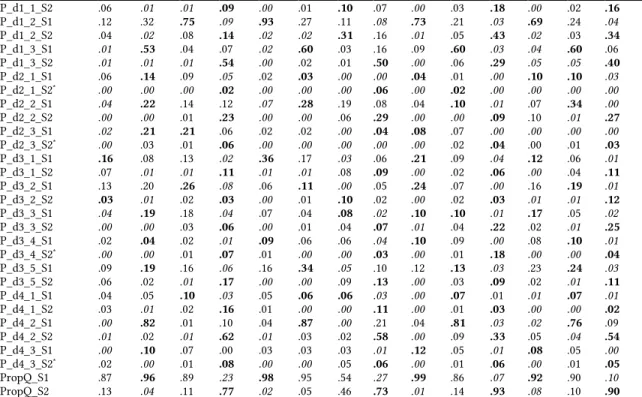
Table 5: Centroids for the 44 features associated to each cluster of each course
Features BCH HBDD BCE ANT
A B C D A B C D A B D A B D prop_d1-1 .80 .12 .10 .16 .03 .09 .50 .09 .13 .08 .19 .21 .08 .16 prop_d1_2 .15 .34 .83 .23 .94 .29 .42 .24 .75 .26 .46 .71 .27 .38 prop_d1_3 .02 .54 .05 .60 .03 .62 .04 .66 .09 .66 .32 .08 .65 .46 prop_d2_1 .06 .14 .09 .07 .02 .04 .00 .06 .04 .03 .00 .10 .10 .03 prop_d2_2 .04 .22 .16 .35 .07 .28 .26 .37 .04 .10 .10 .17 .36 .27 prop_d2_3 .02 .23 .23 .12 .02 .02 .00 .04 .08 .09 .04 .00 .01 .03 prop_d3_1 .23 .09 .14 .13 .36 .17 .11 .15 .21 .11 .10 .12 .10 .11 prop_d3_2 .16 .21 .28 .10 .06 .11 .10 .06 .24 .09 .04 .17 .20 .13 prop_d3_3 .04 .20 .22 .10 .07 .05 .12 .09 .11 .14 .23 .19 .06 .27 prop_d3_4 .02 .04 .04 .08 .10 .06 .09 .07 .10 .11 .18 .08 .10 .05 prop_d3_5 .15 .20 .16 .23 .16 .35 .14 .23 .12 .16 .12 .25 .25 .14 prop_d4_1 .07 .06 .12 .19 .05 .06 .06 .14 .08 .03 .15 .12 .14 .08 prop_d4_2 .01 .84 .03 .73 .05 .91 .02 .78 .04 .90 .36 .07 .80 .64 prop_d4_3 .03 .10 .09 .08 .03 .03 .08 .08 .12 .06 .07 .08 .07 .05 P_d1_1_S1 .74 .11 .09 .07 .03 .08 .40 .02 .13 .05 .01 .20 .06 .00
P_d1_1_S2 .06 .01 .01 .09 .00 .01 .10 .07 .00 .03 .18 .00 .02 .16 P_d1_2_S1 .12 .32 .75 .09 .93 .27 .11 .08 .73 .21 .03 .69 .24 .04 P_d1_2_S2 .04 .02 .08 .14 .02 .02 .31 .16 .01 .05 .43 .02 .03 .34 P_d1_3_S1 .01 .53 .04 .07 .02 .60 .03 .16 .09 .60 .03 .04 .60 .06 P_d1_3_S2 .01 .01 .01 .54 .00 .02 .01 .50 .00 .06 .29 .05 .05 .40 P_d2_1_S1 .06 .14 .09 .05 .02 .03 .00 .00 .04 .01 .00 .10 .10 .03 P_d2_1_S2* .00 .00 .00 .02 .00 .00 .00 .06 .00 .02 .00 .00 .00 .00 P_d2_2_S1 .04 .22 .14 .12 .07 .28 .19 .08 .04 .10 .01 .07 .34 .00 P_d2_2_S2 .00 .00 .01 .23 .00 .00 .06 .29 .00 .00 .09 .10 .01 .27 P_d2_3_S1 .02 .21 .21 .06 .02 .02 .00 .04 .08 .07 .00 .00 .00 .00 P_d2_3_S2* .00 .03 .01 .06 .00 .00 .00 .00 .00 .02 .04 .00 .01 .03 P_d3_1_S1 .16 .08 .13 .02 .36 .17 .03 .06 .21 .09 .04 .12 .06 .01 P_d3_1_S2 .07 .01 .01 .11 .01 .01 .08 .09 .00 .02 .06 .00 .04 .11 P_d3_2_S1 .13 .20 .26 .08 .06 .11 .00 .05 .24 .07 .00 .16 .19 .01 P_d3_2_S2 .03 .01 .02 .03 .00 .01 .10 .02 .00 .02 .03 .01 .01 .12 P_d3_3_S1 .04 .19 .18 .04 .07 .04 .08 .02 .10 .10 .01 .17 .05 .02 P_d3_3_S2 .00 .00 .03 .06 .00 .01 .04 .07 .01 .04 .22 .02 .01 .25 P_d3_4_S1 .02 .04 .02 .01 .09 .06 .06 .04 .10 .09 .00 .08 .10 .01 P_d3_4_S2* .00 .00 .01 .07 .01 .00 .00 .03 .00 .01 .18 .00 .00 .04 P_d3_5_S1 .09 .19 .16 .06 .16 .34 .05 .10 .12 .13 .03 .23 .24 .03 P_d3_5_S2 .06 .02 .01 .17 .00 .00 .09 .13 .00 .03 .09 .02 .01 .11 P_d4_1_S1 .04 .05 .10 .03 .05 .06 .06 .03 .00 .07 .01 .01 .07 .01 P_d4_1_S2 .03 .01 .02 .16 .01 .00 .00 .11 .00 .01 .03 .00 .00 .02 P_d4_2_S1 .00 .82 .01 .10 .04 .87 .00 .21 .04 .81 .03 .02 .76 .09 P_d4_2_S2 .01 .02 .01 .62 .01 .03 .02 .58 .00 .09 .33 .05 .04 .54 P_d4_3_S1 .00 .10 .07 .00 .03 .03 .03 .01 .12 .05 .01 .08 .05 .00 P_d4_3_S2* .02 .00 .01 .08 .00 .00 .05 .06 .00 .01 .06 .00 .01 .05 PropQ_S1 .87 .96 .89 .23 .98 .95 .54 .27 .99 .86 .07 .92 .90 .10 PropQ_S2 .13 .04 .11 .77 .02 .05 .46 .73 .01 .14 .93 .08 .10 .90
Prop_dx-y: the proportion of questions asked overall with value y in dimension x
P_dx-y_S1: the proportion of questions asked during the first half of the course with value y in dimension x PropQ_S1: the proportion of questions asked during the first half of the course for all the dimension *: Non significant feature (not discriminant in either of the four clusterings)
Table 6: Summary of means of dependent variables for each cluster and each course
Clust N Avg
Grd Grd Fin Glb Att Cou Att Ret Stu Qst Nb Vot Nb
B CH A 44 8.00 7.21 0.84 0.87 0.14 1.80 3.07 B 89 9.49 9.32 0.93 0.93 0.22 7.93 2.64 C 77 8.68 8.27 0.91 0.88 0.14 3.81 2.63 D 34 10.69 11.18 0.91 0.99 0.44 8.38 1.01 HB DD A 59 9.04 7.43 0.89 0.93 0.07 3.53 5.57 B 74 11.62 10.13 0.92 0.97 0.27 6.84 3.62 C 31 10.00 9.53 0.92 0.98 0.16 2.32 2.70 D 37 12.41 10.94 0.94 0.95 0.49 6.16 1.61 B CE A B 26 8.64 N/A 0.71 0.84 0.15 2.38 2.14 52 9.94 N/A 0.81 0.95 0.31 7.00 2.28 D 36 10.42 N/A 0.82 0.99 0.28 6.64 1.30 A NT A B 15 8.47 9.25 0.90 0.81 0.20 6.33 0.57 30 11.36 12.93 0.99 0.90 0.43 8.43 0.57 D 30 12.50 13.88 0.99 1.00 0.47 9.40 0.45
For the two variables relative to grades (AvgGrd and FinGrd), the two variables relative to attendance (GlbAtt and CouAtt) as well as for the variables relative to the questions (NbQst) and votes (NbVot), not all distributions followed a normal law (p < .05 in some cases when testing with Shapiro-Wilk), which led us to perform
Kruskal-Wallis H tests on ranks instead of one-way ANOVAs for the clusterings associated to the four courses considered.
In terms of grades, for BCH there was a statistically significant difference between clusters for the average grade (χ2(3) = 14.29, p < .005) and for the final grade (χ2(3)
= 17.93, p < .001). This was also the case for HBDD (AvgGrd: χ2(3) = 27.05, p < .001, and FinGrd: χ2(3) = 23.53,
p < .001). For BCE, there was no statistically significant difference between clusters for AvgGrd and no FinGrd data available. For ANT, there was a statistically significant difference between clusters for the average grade (χ2(2) =
6.54, p = .038) and for the final grade (χ2(2) = 12.32, p = .002).
In terms of attendance, for BCH there was a statistically significant difference for CouAtt (χ2(3) = 10.51, p = .015),
but not for GlbAtt. For HBDD, the test showed a statistically significant difference for GlbAtt (χ2(3) = 9.33, p
= .03) but not for CouAtt. For BCE, there was a statistically significant difference for CouAtt (χ2(2) = 13.69, p = .001),
but not for GlbAtt. For ANT, there was a statistically significant difference for GlbAtt (χ2(2) = 6.19, p = .045) and
CouAtt (χ2(2) = 12.04, p = .002).
In terms of number of questions/votes, for BCH there was a statistically significant difference for NbQst (χ2(3) =
42.12, p < .001) and NbVot (χ2(3) = 8.29, p = .04). For HBDD,
Profiling students from their questions LAK’18, March 2018, Sydney, Australia
9
(χ2(3) = 33.20, p < .001) and NbVot (χ2(3) = 16.76, p < .001).
For BCE, a difference for NbQst (χ2(2) = 9.85, p = .007) but
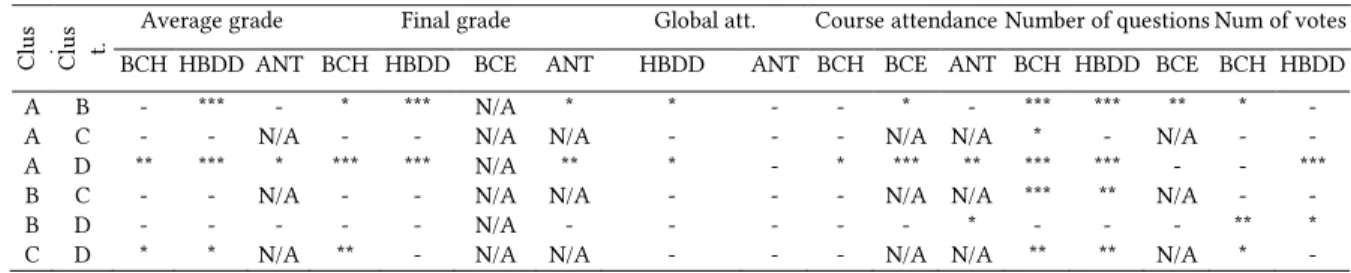
none for NbVot. For ANT, no statistically significant differences were found for NbQst and NbVot. Follow-up post hoc comparisons using Dunn’s test with Holm-Bonferroni correction are summarized in Table 7.
Finally, for the variable indicating whether the student was retaking the year (RetStu), we performed a Chi-square test which revealed a significant difference between the clusters in BCH (χ2(3) = 14.43, p = .002) and HBDD (χ2(3) =
23.72, p < .001), and no difference in BCE nor in ANT.
4.4 Discussion
Cluster A represents 18 to 29% of the students and is characterized by grades lower than average (both in the considered course and overall), and a course and global attendance that is always lower – sometimes significantly – than the one from students in other clusters. The students in this cluster are in majority (86% on average) taking the course for the first time, they asked less questions than average, but their questions received more votes than average and were therefore fairly popular. Their questions are mainly about re-explanation or deepening a concept specifically a request for definition (1, dim1-2 & dim3-1) and often asked during the first half of the course. This cluster therefore correspond to struggling passive students who need basic re-explaining, that many students could benefit from.
On the other end of the spectrum, cluster D represents 14 to 25% of the students in the first semester (and 40% in the second semester, an increased proportion that can be linked to a decrease in the activity from other students) and is characterized by course and final grades significantly higher than others (and almost always statistically significantly higher than students from cluster A), who tend to be attending most of classes. Another distinctive characteristic of this cluster is the fact it contains an important proportion of students taking the course for the second time (42% on average), who ask more questions than average but whose questions are less popular, with less votes overall. We can assume these must be very precise questions that already require a good
understanding of the content of the course, and are thus not deemed as important by other students. Indeed, they mainly asked questions of verification to check for a mistake or contradiction in the course (dim1-3 & dim4-1) and less questions on the link between concepts (dim3-5). Interestingly, when comparing the proportion of questions asked in the first vs. second half of the class, they are the only students who asked more questions in the 2nd half of
the sequences than in the 1st half, presumably because the
concepts presented at the beginning were simpler and easier for them to understand. This cluster therefore corresponds to nitpicking active students, who understand well the basics and point out potential mistakes on advanced concepts – sometimes even to confuse others, according to the pedagogical team (because of the competitive nature of the courses).
Cluster B represents 36 to 40% of students, whose grades, attendance and number of questions asked are similar to cluster D. However, the proportion of students taking the course for the second time is lower than D (31% on average), and their questions are more popular. Overall, their questions are mostly verification of knowledge and on link between concepts (dim1-3, dim4-2 & dim 3-5), but only in the 1st half of the class. They correspond to students
who are in the process of actively building their understanding of the course.
Cluster C (only for BCH and HBDD courses) tend to be an intermediate cluster which always lies in between clusters A and D.
Therefore, we can say that our clustering (based on the question dimensions only) and the follow-up inferential statistical analyses (using students’ characteristics) allow us to positively answer to RQ3.3: the proportion and dynamics of questions asked by students is strongly linked to some of their characteristics (their performance, their attendance, the number of questions they asked, the number of votes they received, and whether they were following this course for the first time or not). Moreover, although the 4 clusterings were performed separately, and contrary to our previous analyses, the fact that three very similar clusters systematically appeared in the 4 courses considered is indicative that the relationships identified are not dependent on the courses.
Table 7: Pairwise differences for AvgGrd, FinGrd, GlbAtt, CouAtt, NbQst, NbVot (* p <.05, ** p<.01, *** p<.001)
Cl
us t.
Cl
us t. Average grade Final grade Global att. Course attendance Number of questions Num of votes
BCH HBDD ANT BCH HBDD BCE ANT HBDD ANT BCH BCE ANT BCH HBDD BCE BCH HBDD
A B - *** - * *** N/A * * - - * - *** *** ** * -
A C - - N/A - - N/A N/A - - - N/A N/A * - N/A - -
A D ** *** * *** *** N/A ** * - * *** ** *** *** - - ***
B C - - N/A - - N/A N/A - - - N/A N/A *** ** N/A - -
B D - - - N/A - - - * - - - ** *
5 CONCLUSION
We have developed a taxonomy of questions asked by students in a blended learning environment and shown how an automatic annotation of questions allowed us to identify profile of students, only based on the proportions of the type of questions they asked and their evolution in time. Two extreme clusters (lower than average students with popular questions, and higher than average students with unpopular questions) always appeared, with sometimes an intermediary one (higher than average students with popular questions).
One of the limits of this work lies in the fact we have considered a single dataset (even if we considered several courses): it would therefore be interesting to apply this taxonomy in a different type of environment such as a MOOC, and check if correlations found between students’ characteristics and the type of questions they ask remain the same. It would also be necessary to replicate this work on the same courses across different years in order to check whether the same clusters always appear in each course, and whether it is possible to apply the model trained on a year over the following one.
Overall, this work not only proves the interest of the proposed taxonomy, but also opens up perspectives to identify students’ level online during the year, and whether they improve or not, based on the type of questions they ask in new courses. Moreover, from the teachers’ perspective, the automatic annotation could be helpful to organize the questions they answer to during their weekly Q&A session. In particular, it could provide them with additional information that the mere votes, to make sure they answer to questions that can benefit to different categories of students: not only to the popular questions but also to the precise (less popular) questions asked by the “good” students.
For the research community, we believe the provided taxonomy should be reusable (and is not language-dependent). Indeed, the sample of 200 questions from the evaluation step was also annotated by a novice untrained human annotator not involved in the creation of the taxonomy who was only provided with Table 2, and we obtained kappa values between novice and expert annotators of [0.59-0.67] on Dim1, 0.38 on Dim2 and [0.33-0.39] on Dim3. We think it would be particularly interesting to apply this taxonomy to annotate questions (manually or automatically) in other contexts (such as MOOCs) to evaluate its generalizability for different applications, as we expect some dimensions to be more or less relevant depending on the context.
REFERENCES
[1] Artstein, R., Poesio, M.: Inter-coder agreement for computational linguistics. Comput. Linguist. 34, 555–596 (2008)
[2] Bouchet, F. 2009. Characterization of Conversational Activities in a Corpus of Assistance Requests. Proc. of ESSLLI 2009 (Bordeaux, France, Jul. 2009), 40–50.
[3] Bouchet, F., Harley, J.M., Trevors, G.J., Azevedo, R. 2013: Clustering and Profiling Students According to their Interactions with an Intelligent Tutoring System Fostering Self-Regulated Learning. J. Educ. Data Min. 5, (2013), 104–146.
[4] Cakir, M., Xhafa, F., Zhou, N. and Stahl, G. 2005. Thread-based analysis of patterns of collaborative interaction in chat. Proc. of AI in Education (2005).
[5] Cao, Y., Liu, F., Simpson, P., Antieau, L., Bennett, A., Cimino, J.J., Ely, J. and Yu, H. 2011. AskHERMES: An online question answering system for complex clinical questions. J. of Biomedical Informatics. 44, 2 (Apr. 2011), 277–288.
[6] Chin, C. and Brown, D.E. 2002. Student-generated questions: A meaningful aspect of learning in science. International J. of Science Education. 24, 5 (May 2002), 521–549.
[7] Chin, C. and Osborne, J. 2008. Students’ questions: a potential resource for teaching and learning science. Studies in Science Education. 44, 1 (Mar. 2008), 1–39.
[8] Efron, M. and Winget, M. 2010. Questions are content: a taxonomy of questions in a microblogging environment. Proc. of the Association for Information Science and Technology. 47, 1 (2010), 1– 10.
[9] Graesser, A.C. and Person, N.K. 1994. Question asking during tutoring. American educational research j. 31, 1 (1994), 104–137. [10] Kim, J., Shaw, E. and Ravi, S. 2010. Mining Student Discussions for
Profiling Participation and Scaffolding Learning. Handbook of Educational Data Mining. CRC Press. 299–310.
[11] Li, X. and Roth, D. 2006. Learning Question Classifiers: The Role of Semantic Information. Natural Language Engineering. 12, 3 (2006), 229–249.
[12] Liu, Q., Peng, W., Zhang, F., Hu, R., Li, Y. and Yan, W. 2016. The Effectiveness of Blended Learning in Health Professions: Systematic Review and Meta-Analysis. J. of Medical Internet Research. 18, 1 (Jan. 2016).
[13] Marom, Y. and Zukerman, I. 2005. Corpus-based Generation of Easy Help-desk Responses.
[14] Shaw, E. 2005. Assessing and Scaffolding Collaborative Learning in Online Discussions. Proc. of AI in Education: (Amsterdam, The Netherlands, The Netherlands, 2005), 587–594.
[15] Soller, A. and Lesgold, A. 2003. A Computational Approach to Analyzing Online Knowledge Sharing Interaction. Proc. of AI in Education 2003 (2003), 253–260.
[16] Sullins, J., McNamara, D.S., Acuff, S., Neely, D., Hildebrand, E., Stewart, G. and Hu, X. 2015. Are You Asking the Right Questions: The Use of Animated Agents to Teach Learners to Become Better Question Askers. FLAIRS (2015), 479–482.
[17] Zhang, D. and Lee, W.S. 2003. Question classification using support vector machines. Proc. of the 26th annual int. ACM SIGIR conf. on Research and development in information retrieval (Toronto, Canada, 2003), 26–32.