Publisher’s version / Version de l'éditeur:
Vous avez des questions? Nous pouvons vous aider. Pour communiquer directement avec un auteur, consultez la
première page de la revue dans laquelle son article a été publié afin de trouver ses coordonnées. Si vous n’arrivez pas à les repérer, communiquez avec nous à [email protected].
Questions? Contact the NRC Publications Archive team at
[email protected]. If you wish to email the authors directly, please see the first page of the publication for their contact information.
https://publications-cnrc.canada.ca/fra/droits
L’accès à ce site Web et l’utilisation de son contenu sont assujettis aux conditions présentées dans le site LISEZ CES CONDITIONS ATTENTIVEMENT AVANT D’UTILISER CE SITE WEB.
Internal Report (National Research Council of Canada. Division of Building
Research), 1968-12-01
READ THESE TERMS AND CONDITIONS CAREFULLY BEFORE USING THIS WEBSITE. https://nrc-publications.canada.ca/eng/copyright
NRC Publications Archive Record / Notice des Archives des publications du CNRC : https://nrc-publications.canada.ca/eng/view/object/?id=980cab6f-90b2-4214-895c-da5f4581479e https://publications-cnrc.canada.ca/fra/voir/objet/?id=980cab6f-90b2-4214-895c-da5f4581479e
Archives des publications du CNRC
For the publisher’s version, please access the DOI link below./ Pour consulter la version de l’éditeur, utilisez le lien DOI ci-dessous.
https://doi.org/10.4224/20386579
Access and use of this website and the material on it are subject to the Terms and Conditions set forth at
Snow loads on roofs 1966-67: eleventh progress report
Kennedy, I.
NATIONAL RESEARCH COUNCIL OF CANADA
DIVISION OF BUILDING RESEARCH
SNOW LOADS ON ROOFS 1966 - 67
ELEVENTH PROGRESS REPORT
by
1. Kennedy and D. A. Lutes
.
,セ
Internal Report No. 364
of the
Division of Building Research
OTTAWA
Because of the importance of snow load as the major design load on roofs in Canada, continuous efforts are being made to obtain a better basis for the prediction of snow loads on roofs.
This report presents the results of the final year of a 10 -year countrywide survey of Snow Loads on Roofs in the form of graphs, tables and photographs and includes a discussion on future snow load
studies. Observations were made on 40 roofs at 15 A Stations; B-Station
reports were prepared by DBR staff on about 20 large roofs in the Ottawa area and on several others in the mountains of B. C.; and C-Station reports on 23 roofs were received from 8 Canadian Forces Bases.
This general survey has provided the information needed for the revision of snow load requirements in the National Building Code of
Canada. It has been discontinued after the 1966 -67 winter in favour of
two new more specialized studies aimed at filling some gaps in the
information available from the A, Band C Stations of the general survey.
These gaps concern snow loads on large flat roofs and snow loads in the mountains, both of which will be the subject of future reports.
The Division of Building Research wishes to record here its appreciation to all observers across Canada whose excellent work, often done under difficult conditions, made possible this general survey
of Snow Loads on Roofs. In particular, special appreciati.on is recorded
to A-Station observers of the Meteorological Branch of the Department of Transport at Goose Bay and Gander; the National Parks Branch of the
Department of Northern Affairs and National Resources at P. E.
1.
National Park; Laval University (Quebec); MacDonald College (St e, Anne de Bellevue); Queen's University (Kingston); University of Alberta (Edmonton); University of Waterloo, Aluminum Company of Canada at
Arvida; Mrs. P, Curtis at Inuvik; and the Atlantic, Prairie and B. C.
Regional Stations of the Division. Thanks are also here recorded to
the Chief of Defence Staff, Air Force Headquarters, Ottawa, and to the
R. C. A. F. personnel at C Stations at Comox. Lancaster Park, Cold
Lake, Winnipeg, North Bay, Ottawa, Goose Bay and Toronto. and to the building inspectors and individuals who made the observations at
B Stations. Without all this willing co -operation this survey could not
have been carried out.
This report was prepared by I. Kennedy of Queen's University,
a summer worker with the Building Structures Section and D. A. Lutes,
Research Officer with the Section, under the direction of W. R. Schriever.
Ottawa
December 1968
( ii)
R. F. Legget Director
Page
SURVEY PROCEDURES OF 1966-67 OBSERVATIONS... 3
A Stations B Stations C Stations 3 3 4 W E A T H E R . . . 4 PRESENTATION OF RESULTS. ... . .. . . .. . . 5
RESULTS OF THE 1966-67 OBSERVATIONS... 5
Average Loads 6 Drift Loads 6 A Stations 7 B Stations 10 C Stations 10 CONC LUSIONS . . . 11 FUTURE STUDIES 12 REFERENCES , . 13
SNOW LOADS ON ROOFS 1966 - 67 ELEVENTH PROGRESS REPORT
by
1. Kennedy and D. A. Lutes
Because of the importance of snow loads on roofs in the cold
climate of Canada, continuous efforts ar e being made to obtain a better
assessment of snow loads on roofs as a basis for an improved formulation
of design snow loads in the National Building Code (l).
In
general term sthe problem is to recommend a design snow load that is high enough to r educe the probability of failur e to an acceptable level but, at the sam e time, not so high that unreasonable construction costs will result.
Early design snow loads were specified in the National Building Code (1953), for differ ent locations across Canada, on a map showing
"contour lines" of equal snow load. These loads, which were used as
design loads for roofs, were based directly on measurements of maximum
ground snow depths observed over a number of years. It was obvious,
however, that in some cases these loads were too high and thus uneconomical,
and that in others, they were too low. Even superficial observations showed
that roof snow depths were often much less than ground snow depths, and
that measurements of ground snow depths were not, therefore, directly
applicable to the determination of roof snow loads.
In
view of these considerations, the Associate Committee on theNational Building Code asked the Division, in 1957, to carry out a
country-wide survey of actual accumulations of snow, ice, and rain on
roofs. The fir st full survey observations were made during the winter
of 1957-58, with more than 50 observers across Canada co-operating in
this work. Ten Progress Reports (2-11) including a pilot survey have
been prepared over the years summarizing the results of this survey. This present report gives the results of the tenth year of observations (1966-67) of the "Survey of Snow Loads on Roofs".
Three types of stations were set up for ch e survey. At A stations
the observers measured snow depth and density of the snow, mainly on flat and pitched roofs of residential size and, for comparison, on the
adjacent ground. At these stations snow depths on the roofs were measured
by means of mounted gauge sticks and on the ground with a yardstick. The
density was determined by taking samples of a known volume of snow and weighing the melt water.
At B stations observations of extreme or unusual snow load
conditions or roof failures were made by volunteer observers. This
infor-mation has been used to build up case records concerning the nature and causes of snow load formation (12).
At C stations observers made the equivalent of A-station observations on very lar ge roofs located at Air Force Bases acros s the country.
A brief review of the developments in dealing with snow loads in
the National Building Code may be useful. In 1960 the survey of snow
loads on roofs had provided sufficient evidence on the relationship between ground and roof loads to enable the Committees responsible for the
revision of the Code to make some changes in the roof loads compared
with the ground load. The roof load was set at 80 per cent of the ground
load, the ground load being based on a return period of 30 years and ad-justed to allow for the increase in the load caused by rain-water absorbed
by the snow. Some nominal allowance was also made for drift loads.
In the 1965 Code further changes were made by the Revision
Committee on Structural Loads and Procedures and this led to a mar e
rational approach to snow loads for the design of roofs.
All roof loads were based on the snow load on the ground and, consequently, the column for the roof snow load in the Table of Design
Data for Selected Locations in Canada in Supplement No. 1 (13) was
omitted. The basic roof load was again set at 80 per cent of the ground
load except that for roofs exposed to the wind a roof load of 60 per cent
of the ground load could be used under certain conditions. This reduction
of roof load for exposed roofs to 60 per cent of the ground load could only be made because, at the same time, allowance was made for a variety
of influences causing accumulations of snow loads on roofs. This was
done by means of "snow load coefficients" or shape factors, which are
shown in the form of diagrams and simple formulae in Figures 2 -1 to
2 -7 of Chapter 2 of Supplement No. 3 (14) to the NBC "Structural
infor-mation for Building Design in Canada". Explanations of the use of these
coefficients are also gi ven.
After ten years of observations of the survey of snow loads on
A-, B- and C-station roofs, the status and direction of the
survey were reviewed. It was agreed that this general survey, carried
out according to certain guidelines described (15, 16) had, on the whole,
served its purpose by supplying the material needed for the revision of
snow load requirements in the NBC, but that it could be discontinued after the
1966 -67 winter in favour of two new more specialized studies. These
studies would be aimed at filling some gaps in the information available
3
-loads on lar ge flat roofs and snow -loads in the mountains. The collection
of observations on typical or unusual accumulations of snow on selected roofs, which allowed the publication of case histories (12) for the use of designers, will, however, be continued.
International co -operation in load studies was illustrated by a paper on the preparation of standards for snow load on roofs published by CIB, co -author ed by a DBR staff member and a Soviet scientist (17). SURVEY PROCEDURES OF 1966-67 OBSERVATIONS
The procedures followed in the DBR snow load survey for the 1966 -67 winter wer e the same as those of former year s.
A Stations
During the winter of 1966-67 a total of 40 roofs were observed at
15 A stations. This total included all of the roofs observed in the previous
year's survey plus a spherical dome surface on the NRC property in Ottawa. At most A stations at least one flat and one gable roof wer e observed.
As in the past, A-station observers measured and recorded in detail the depth and density of snow on the ground and on the roofs.
Observers were asked to take readings once a week and after each heavy
snowfall; although most of them complied with these instructions, some
sent only a few observations. All the A- station results that were received
are included in this report. B Stations
B -station observations differ from those at A stations in that they are single reports of snow loads that are unusual in magnitude or distribution, or that have caused structural failur e of a building.
Observers are encouraged to make data as complete as possible and to
include photographs, or at least rough sketches, showing the depth and
shape of each snow accumulation, with a qualitative indication of the snow
density. Many of the B -station reports were later incorporated in a
collec-tion of snow load case histories being compiled by the Building Structures Section of the Division of Building Research.
For the 1966 -67 winter, DBR staff per sonnel pr epa r e d B -station reports on about 20 large roofs in the Ottawa area and on several others
in the mountains of British Columbia. No B -station reports were received
C Stations
The C -station observations consist of depth and density
measurements of snow on the ground and on the roofs of large buildings
at airports across Canada. All of the airports in the survey are
Cana-dian Forces Bases (CFB), formerly termed RCAF bases. At each
station observations are made once a week and after each heavy
snow-fall on two or more of four standard roofs - the cantilever hangar roof
(flat), the arch hangar roof (curved with flat wings), the mechanical
equipment garage roof (flat, split level), and the unit supply depot roof
(flat). In total, eight Canadian Forces Bases reported on 23 roofs this
year.
WEATHER
The three main climatological factors (snowfall, temperature, and wind), affecting snow loads on roofs are plotted against time along with the snow load for the A and C stations in Figures 3 to 25.
Climatological information for this report was obtained from the
Meteorological Branch of the Department of Transport. Where a city
with an A or C station did not have a weather office itself climate infor-mation from a nearby centre was used; for all stations the location of the corresponding meteorological station is indicated beside the plotted data. Temperature and snowfall data were obtained for all stations, but for
several stations no wind readings were available while for other s only
those gust speeds greater than 18 mph were published. For this reason
several of the graphs in Figures 3 to 25 ar e incomplete.
In general, snowfall for the 1966 -67 winter season was above
normal. The only exceptions were the two stations in the extreme north
and west (Inuvik and Comox) and Ste. Anne de Bellevue, which had
below-normal snowfalls. Two central Canadian stations (North Bay and Winnipeg)
recorded near - normal snowfalls. At all remaining stations the winter
snowfall was from 10 to 50 per cent above normal.
Temperatures across Canada were generally above normal until January, and then considerably below normal in February, March and
April. Exceptions to this were the Prairie region, which was colder
than normal all winter, and Inuvik and Comox which had warmer -than-normal weather nearly all winter.
5
-PRESENTATION OF RESULTS
Detailed results from A stations are presented here, as they have been in previous snow load progress reports, by means of a graph for each roof on which ground load, minimum, maximum, and average roof loads
are plotted against time. The number of the gauge at which the maximum
roof load is located is also noted. For one building the maximum load on
a lower canopy roof is also plotted against time. Included for each station
ar e the climatological graphs descr ibed a Ir eady, on which accumulated
snowfall, daily maximum or peak wind speed (with directions), and daily
mean temperature are plotted against time. Snowfall totals for the winter
months are shown under the sub -headings "Normal" and"
1966 -67."
Alsoincluded are drawings showing the principle dimensions of each building
and the location of snow gauges on the roof. These detailed results, that
comprise Figures 3 to
17.
are summarized in Table1
and in graphs ofFigures 1 and 2.
Observations from B stations are summarized in Table I I and pictures of two of the roofs are shown in Figures 26 and 27.
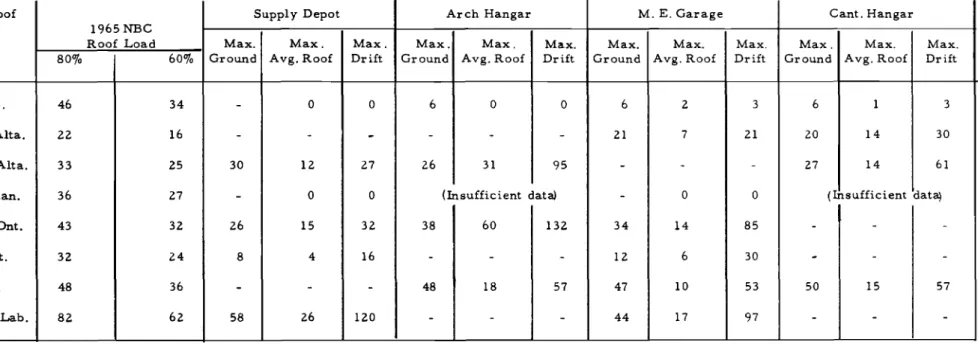
Observations from C stations are treated in exactly the same manner as those from A stations; detailed graphs for each roof are shown in Figures 18 to 25, and a summary of results is contained in Table III.
Table IV presents roof/ground load ratios for large flat roofs at both A and C stations.
RESULTS OF THE
1966-67
OBSERVATIONSThis discus sion will deal with the relationships among maximum roof load (drift load), maximum average roof load, maximum ground load,
NBC ground load, and NBC design roof load. These terms are, therefore,
defined her e as follows.
Maximum roof load (sometimes called drift load) - the greatest roof load r ecor ded at any snow gauge during the winter.
Maximum average roof load - the greatest average load over the entire roof recorded during the winter.
Maximum ground load - the greatest average snow load on the ground recorded during the winter.
NBC ground load - the 30 -year ground snow load given for the location in Supplement No.1 to the National Building Code 1965 (13).
NBC design roof load - the design roof load calculated as a fraction
of the 30 - year ground snow load accor ding to paragraphs 4. 1. 3. 7. to
4.1. 3. 10. of the National Building Code 1965 (1). Average Loads
On the average, the maximum average roof loads at A stations were only 21 per cent of the corresponding NBC design roof loads, with the largest (56 per cent)occurring on one of the roofs observed
at Ottawa. The maximum average roof loads were (on the whole) only
34 percent of the corresponding maximum ground loads, with only a Halifax roof (124 per cent) having an apparent maximum average roof load greater than the maximum ground load.
Two C -station roofs, both relatively small flat roofs at the base of a large arch roof, had maximum average roof loads which
exceeded both the corresponding NBC design roof loads and the maximum gr ound loads for the winter becaus e heavy accumulations occurr ed behind the raised door housings at the ends of the hangars.
Drift Loads
Twelve per cent of A -st at ion roofs had drift loads which exceeded the NBC basic design roof load, wher eas for C stations they wer e about
60 per cent. This is to be expected since the C -station roofs ar e lar ger
with drifts occurring on lower level roofs or behind parapets. If, on the
other hand, the drift loads are compared with the maximum ground load, it is found that 28 per cent of the A -station roofs had drift loads gr eater
than the corresponding maximum ground load. Many B -station reports
provided further examples of the drift load exceeding both the ground load and the NBC design roof load.
A more detailed discussion of the observations from individual A
stations follows. Where a meteorological quantity is compared to normal,
the normal is given in parentheses; where a snow load is compared to an NBC value, the latter follows in parentheses.
7
-A Stations
Inuvik, N. W. T. (Figure 3) - Despite the fact that snowfall
from October to April was 10 percent below normal (60 in.), the ground load in March and April reached 73 per cent of the NBC ground load for
Inuvik (46 psf), one of the highest values in this year's survey. Even
with this relatively lar ge ground accumulation, however. and the generally low wind speeds typical of this ar ea. the average roof loads wer e all
small (21 per cent or less of the corresponding NBC design roof load). The maximum drift load on the residence roof equalled the NBC value.
Edmonton (Figure 4) - This city, with snowfall 33 per cent above normal (47.6 in. ) for the winter, had a maximum ground snow load of
12 p sf, the lowest among the A stations. Drift loads on roofs observed
were less than 5 psf on both the flat and gable roof and both had large bare areas at various times during the season.
Saskatoon (Figure 5) - This city experienced a "tough" winter. For the months of November to April Sa skat oon' s mean daily temperatures averaged 5.3 degrees below normal which represents the greatest seasonal
deviation from normal observed in this survey. Furthermore, the total
snowfall was 43 per cent above normal. High winds. however, kept
average roof loads below 20 per cent of the NBC design load values (21 psf)
on all five roofs observed. Drift loads on two of the roofs exceeded the
maximum ground load but not the NBC roof load.
Winnipeg (Figure 6) - The winter here was also about five degrees
colder than usual but total snowfall was about normal. The maximum ground load was one -third the NBC ground load value and the maximum roof loads (drift loads) were only one -quarter the NBC design roof load.
Waterloo (Figure 7) - Snowfall in Waterloo was 41 per cent above normal (53 in. for November to April) but. probably due to frequent thaws. the ground load never exceeded 25 p sf, which is well below the NBC ground
load value of 60 psf. Average roof loads were also small (one -half the
ground load or less). During late January and February the drift load.
which occur s every winter on the Engineering Building roof in the lee of the higher Main Engineering Building, reached a value up to 24 per cent greater than the maximum ground load (19 psf).
Toronto (Figure 8) - In spite of the heavy snowfall for this area, the maximum ground load of 15 psf was only 37 per cent of the NBC ground
load for Toronto (40 psf). Frequent thaws throughout the winter prevented
any larger accumulation of snow. Average roof loads were generally low
(in fact the gable roof was frequently bare) but three heavy snowfalls in
January and February resulted in drift loads of about 1.5 times the maximum
ground load (15 psf) on both roofs. Other factor s contr ibuting to the
forma-tion of these unusual accumulaforma-tions were the 2 ft 2 in. parapets on the flat roof and the high winds that were able to affect the snow distribution even
though both roofs were classified as 'Isheltered".
Kingston (Figure 9) - Snowfall in Kingston was. above normal
(43 in.), but ground loads were not exceptionally large. Winds blowing
in from Lake Ontario deposited snow in concentrated loads in the lee of the 2 ft 6 in. parapets on the flat roof of McNeil House creating drift loads
of more than 2.5 times the ground load. A maximum average roof load
86 per cent of the size of the maximum ground load (15 psf) was observed. This was due to anomalies in the locations of the roof measurements.
Ottawa (Figure 10) - Snowfall in Ottawa was 20 in. above normal for the months of January and February and 8 in. below normal in March.
Total snowfall was 17 per cent above normal (83 in.). Of the seven roofs
observed, the three flat roofs had maximum average roof loads greater than 10 psf while the others (three gable and one spherical dome) all had maximum
average roof loads of less than 10 psi. For the only sheltered roof, this
load was 56 per cent of the NBC design roof load (48 p sf}, the highest such
ratio in the 1966 -67 snow survey for A stations.
An interesting addition to the snow load study this year was the
NRC dome, a metal structure with the only spherical roof in the survey.
It was snow -covered in January with a maximum average roof load of 7 psf and a drift load of 17 psi, but was bare for the rest of the winter.
Ste. Anne de Bellevue (Figure 11) Although total snowfall here
was 27 per cent below normal (99 in. ) and maximum average roof load
on the poultry building was less than 8 psi, drift loads on the gable roof
of the East Wing were equal to or greater than the ground load for most
of the winter. The largest roof drifts occurred consistently in the lee
of the main roof which is some 15 ft higher and exposed to predominantly
westerly winds. The West Wing with a low slope shed roof accumulated
9
-Quebec (Figure 12) - Only three reports were received from
Quebec for the 1966-67 winter, but it is interesting to note that the
large, sheltered, flat roof of the Pavillon Vachon had the highest reported
drift load among the A -station roofs. It was 86 p sf, which was 1. 5 times
the ground load at the time, and considerably more than the NBC design
roof load (67 psf).
Arvida (Figure 13) - Total snowfall at Arvida was 20 per cent
greater than normaL but still the maximum average and drift loads on
the roof reached only 17 per cent and 33 per cent respectively, of the
NBC design roof load (45 psf), This was partly due, no doubt, to wind
action pr eventing lar ge accumulations on the exposed flat roof. although
wind speeds at Arvida were relatively low compared to those observed elsewhere in Canada.
P. E. 1. National Park (Figure 14) - Normal snowfall totals for
P. E. 1. National Park were not available from the Department of Transport,
but it appear s from the survey results that the 1966 -67 winter snowfall was
probably greater than normal. The snow load observations indicate that
within this area there are large variations in both snowfall and loading
conditions. For example, the maximum ground load at Stanhope was 66 psf
(the only station in the survey where it equalled the NBC ground load),
whereas at Dalvay it was only 31 p s f, yet the maximum average roof loads
were only 6 p s f and 21 psf on the flat roofs at Stanhope and Dalvay. On the Dalvay roof, drift loads in the lee of a higher part of the same Building were
consistently more than twice the load on the ground. On the other hand,
the exposed gable roof remained virtually bare all winter.
Halifax (Figure 15) - This station's total snowfall was 48 per cent above normal for the winter; it was close to 90 per cent above normal for
the January to March period. The maximum average observed roof load
(16 psf) was less than one-half the NBC design load (36 p sf}. The exposed
flat NRC roof tended to have drifting conditions near its roof projections
but loads were generally small. Frequent thaws prevented large snow
accumulations on Halifax roofs.
Goose Bay (Figure 16) - Snow loading on the gable roof at Goose
Bay produced no unusual effects this winter. Considerable drifting occurred
near the eaves on the east (leeward) side of the roof. but the largest drift load was less than one -half the maximum ground load (45 psf), which in turn was less than one -half the NBC ground load for this ar ea (103 psf).
Gander (Figure 17) - More than 150 in. of snow (29 per cent above normal (118 in. )), fell at Gander during the winter, but high winds kept the roof snow loads small; the maximum average roof load observed
here was 2 psf. Snow drifts of 10 to 20 psf formed on the exposed gable
roof after several heavy snowfalls but they remained for only a few days. Although the "drift load" on the lar ge flat roof never exceeded 1 p sf, an adjacent low canopy roof accumulated drifts of depths up to 64 in. with a maximum load of 172 psf (four times the maximum ground load). B Stations
Among the more heavily loaded B -station roofs were two in Ottawa where drifts seven and eight feet high on low sheltered roofs
caused loads equal to twice the NBC ground load. In British Columbia
four buildings had average roof loads gr eater than their NBC design roof
loads. The gable -roof kitchen shelter at the Illecillewaet Camp in
Glacier Park was especially interesting as it was observed to have an average roof load of 187 psf with drift loading to about 200 psf; snow creep had produced massive overhangs which extended more than six feet from the bu ilding on all four side s.
C Stations
As in the past, average snow loads on the large flat C -station
roofs were relatively small this winter. Wind action produced dr ifting
on many of the roofs. This lead to heavy accumulations in a number of
locations: beside the raised door housing and on the canopies of the cantilever hangars; on the flat wings of the arch hangars; beside the raised portions of the mechanical equipment garages; and on the low
canopies of the unit supply depots. Because all of the buildings are
exposed to the wind the large central areas of most roofs were bare nearly all winter.
One fact concerning the arch hangar roofs must be pointed
out. Although they have been included again this year among the
"large flat roofs" of Table III, they are not really typical of this group.
The arch hangars each have a very large arch roof, spanning 160 ft ,
that is flanked by two relatively narrow (20 ft wide by 160 ft long) flat-roofed wings at the foot of the slopes; the snow gauges for the DBR/NRC
survey are located on these two flat roof sections. Although the total
area of flat roof being observed is about ten thousand square feet, these roofs consist of narrow strips, sheltered by the arch roof whose
11
-geometry the flat roofs accumulate snow which has either slid down from the arch or has been blown over from the windward side and deposited in the
lee of the arch. It is, therefore, not entirely reasonable to consider the
arch hangar in the same category as the other roofs of Table III, most of which are fully exposed to the wind and that consequently are generally fairly clear of snow.
CONCLUSIONS
On the whole the 1966 -67 observations substantiate the conclusions
presented in previous reports. The main conclusions are as follows:
(1) Average snow loads on the majority of roofs are considerably
less than the load on the surrounding ground.
(2) The amount by which the average snow load on the roof differs
from the snow load on the ground (roof to ground ratio) depends primarily
on the degr ee to which the roof is shelter ed. The effects of shelter ar e,
however, difficult to predict exactly.
(3) Whereas well sheltered roofs have ratios up to
nearly all exposed roofs have ratios of less than 0.6. unobstructed roofs exhibit very low ratios.
approximately 0.9, Well exposed
(4) Heavy drift loads, that frequently exceed ch e load on the ground by
alar ge factor, are found in roof areas of localized shelter. Their magnitude
depends on, among other things, the shape of the building, the snowfalL the
size of the "tributary" roof area, and the height of the localized shelter. The
first step in providing designers with "shape factors" to consider in estimating probable accumulations of snow due to drifting and other influences was taken by publishing recommended "Coefficients for Snow Loads on Roofs" in
Supplement No. 3 to the National Building Code, 1965. These coefficients,
however, can only deal with the more common types and shapes of roofs. Since many unusual types of roofs and conditions must be considered, a collection of case histories of interesting snow loads has been published by the Division of Building Research (12) to provide further guidance to the
designer, whose responsibility it is to make the best possible estimate
of the probable snow load. This publication will be revised and expanded
FUTURE STUDIES
It seems appropriate to add some remarks here about future
studies. Ten years of measurements have now been completed in the
general survey of "Snow Loads on Roofs" which has provided a basis mainly for the revisions of the snow load requirements in the National
Building Code of Canada. There is a need for further records in some
specialized areas, particularly in relation to the problems of snow loads on large flat roofs in cities, and snow loads on all types of roofs in the
mountains. F stations and M stations have been set up, therefore, to
make these observations.
The purpose of the F -station survey is to provide information on high and low loads occurring on single -level and multi -level flat roofs because they constitute the most common type of roof on newer commercial
and industrial buildings. One factor to be investigated is the influence of
the size of the upper roof on the drift load on the lower roof for two -level
buildings. F -station observations were started in about a dozen locations
across Canada aft e r significant snowfalls at the time when snow depth is
near the maximum for the winter. It is hoped that ultimately the r ecor ds
obtained will produce such definite information that recommendations can
be made that will improve, even further, the economy and safety of roof
structures in Canada.
The reason for establishing the M stations is that some mountainous areas in Western Canada, particularly at higher elevations, are subject to very high snowfalls resulting in ground loads of 200 psf or more and this
creates a special problem. Weather observations used in preparing Chart
7, "Maximum Snow Load on the Ground", of Supplement No. 1 to the NBC
were, of necessity, made mainly in inhabited locations, hence the chart
applies only to permanently populated areas. Consequently, the lines of
Chart 7 apply generally only to the populated valleys and not to the higher
mountain slopes, where, in some cases, much greater snow depths are
known to accumulate; these must be taken into account in the design of roofs. During the 1966 -67 winter a pilot M -station survey was carried out by two members of DBR staff at Rogers Pass in the Selkirk Mountains of
British Columbia. Measurements of snow depths and densities at various
altitudes were taken at several locations. It is hoped that ultimately the
records obtained will make it possible to establish relationship s between snow load and altitude for mountainous ar ea s .
13 -REFERENCES
1. National Building Code of Canada, 1965.
Council, Associate Committee on the Code, Ottawa, NRC 8305.
National Research National Building
2. Allen, D. E. - Snow loads on roofs, 1956 -57. A Progress Report,
National Research Council, Division of Building Research, DBR Internal Report No. 134, Ottawa, January 1958.
3. Allen, D. E. and C. J. Turkstra - Snow loads on roofs, 1957 -58.
Second Progress Report, National Research Council,
Division of Building Research, DBR Internal Report No. 163,
Ottawa, November 1958.
4. Thorburn, H. J. and B. G. W. Peter - Snow loads on roofs, 1958-59.
Third Progress Report, National Research Council, Division of
Building Research, DBR Internal Report No. 184, Ottawa,
November 1959.
5. Watt, W. E. and H. J. Thorburn - Snow loads on roofs, 1959-60.
Fourth Progress Report, National Research Council, Division
of Building Research, DBR Internal Report No. 204, Ottawa,
November 1960.
6. Scott, J. F. and B. G. W. Peter - Snow loads on roofs, 1960 -61.
Fifth Progress Report, National Research Council, Division of Building Research, DBR Internal Report No. 228, Ottawa, November 1961.
7. Hebert, P. A. and B. G. W. Peter Snow loads on roofs, 1961-62.
Sixth Progress Report, National Research Council, Division
of Building Research, DBR Internal Report No. 260, Ottawa, January 1963.
8. Allen, C. M. and B. G. W. Peter - Snow loads on roofs, 1962 -63.
Seventh Progress Report, National Research CounciL Division
of Building Research, DBR Internal Report No. 279, Ottawa, November 1963.
9.
Pernica, G. and B. G. W. Peter - Snow loads on roofs,Eight Progress Report, National Research Council,
of Building Research, DBR Internal Report No. 324
November 1966.
1963-64. Division Ottawa,
10. Faucher, Y. - Snow loads on roofs, 1964-65. Ninth Progress
Report, National Research Council, Division of Building
Research, DBR Internal Report No. 339, Ottawa, June 1967.
11. Ho, M. and D. A. Lutes - Snow loads on roofs, 1965 -66. Tenth
Progress Report, National Research Council, Division of
Building Research, DBR Internal Report No. 358. Ottawa, April, 1968.
12. Schriever, W. R., Y. Faucher and D. A. Lutes. Snow accumulations
in Canada .Ca s e Histories: 1. National Research Council,
Division of Building Research, Technical Paper No. 237,
Ottawa,January 1967, NRC 9287.
13. Climatic Information for Building Design In Canada. Supplement
No. 1 to the National Building Code, 1965. National Research
Council, Associate Committee on the National Building Code,
Ottawa, NRC 8329.
14. Structural Information for Building Design in Canada. Supplement
No. 3 to the National Building Code, 1965. National Research
Council, Associate Committee on the National Building Code, Ottawa, NRC 8331.
15. Allen, D. E. - Snow loads on roofs. The present requirements and
a proposal for a survey of snow loads on roofs. National Research
Council, Division of Building Research, DBR Internal Report
No. 106, Ottawa September 1956.
16. Allen, D. E. - Field instructions for observers at "A" stations of
snow loads on roofs. National Research Council, Division of
Building Research, Technical Note No. 233, Ottawa, October 1957.
17. Schriever, W. R. and Otstavnov, V. A. - Preparation of standards
for snow loads on roofs in various countries, with particular
reference to U. S. S. R. and Canada. C.!. B. Paper No.9,
TABLE I
SNOW LOADS FOR A STATIONS 1966 - 67
1965NBC Max
Load Max Max. Avg. Observed
{paf] Ground Roof Roof
Station Roof 60'1. 80'1. (psf) (pst) (psf)
Inuvik, N. W.T. Flat: Heated. insulated. exposed 28 37 33 3 6
Gable: Not heated. sheltered from south 28 37 33 3 6
Gable: Heated, insulated, exposed 28 37 33 6 29
Edmonton. Alta. Gable: Not heated. shelter ed 16 12 12 4 5
Flat: Heated, insulated. exposed 16 12 12 2 3
Saskatoon. Sask. Flat: Heated. insulated, exposed 21 28 10 4 12
Flat: Heated. insulated, exposed 21 28 9 2 12
Gable: Heated, insulated. exposed 21 28 20 3 6
Gable: Heated, insulated, exposed 21 28 12 3 4
Flat: Heated. insulated exposed 21 28 12 I 2
Winnipeg, Man. Flat: Heated. insulated, exposed. 811parapet 21 36 15 8 9
Gable: Heated. insulated shelter ed 27 36 15 2 10
Waterloo, Ont. Flat: Heated. insulated, exposed 36 48 25 13 16
Flat: Heated. insulated, exposed 36 48 19 10 23
Gable: Heated. insulated, exposed 36 48 17 5 6
Toronto, Ont. Gable: Heated. insulated. sheltered 23 30 15 8 23
Flat: Heated. insulated, sheltered, zt"parapet 24 32 15 13 21
Kingston. Ont. Gable: Heated. insulated. sheltered 30 40 18 11 16
Flat: Heated. insulated, exposed, 216"parapet 30 40 15 13 39
Ottawa. Ont. Flat: Heated, insulated. exposed 36 48 38 15 20
Flat' Heated. insulated, sheltered 36 48 43 27 51
Flat: Heated, insulated. exposed 36 48 29 10 24
Gable: Heated, insulated. exposed 36 48 34 7 14
Gable: Heated, insulated, exposed 36 48 36 8 12
Gable: Heated, insulated. exposed 36 48 31 9 19
Spherical dome: 36 48 29 7 17
Ste . Anne de Gable: Heated. insulated. exposed 30 40 37 8 43
Bellevue. Que. Shed: Heated. insulated. exposed 33 44 37 4 13
Arvida. P.O. Flat: Heated. insulated. exposed 45 60 41 8 15
P.E. I. National Flat: Not heated, insulated. sheltered 40 53 66 6 13
Park Flat: Not heated. insulated, sheltered 40 53 31 21 66
Gable: Heated insulated. exposed 40 53 27 I I
Halifax. N.S. Flat: Heated. insulated, sheltered 27 36 14 8 17
Gable: Heated. not insulated. sheltered 27 36 31 7 8
Flat: Heated. insulated. exposed 27 36 13 16 19
Goose Bay. Lab. Gable: Heated. insulated. exposed 62 82 45 11 21
Gander. Nfld. Flat: Not heated, insulated, exposed 37 50 42 I I '
Gable: Heated, insulated. exposed 37 50 26 2 19
SNOW LOADS AT B STATIONS 19l!6 - 67
NBC Roof
(p sf) Loads intlsf
Type of Heated and 1965 1965 Avg. Roof
Location Roof Insulated 800/0 60% Ground Roof Drifts Remarks
Rogers Pass, B. C. . Flat Canopy No 129 97 52 52 61 Strong winds. Canopy sheltered by
higher roofs
. Glacier National Park, B. C. Gable No 128 64 70 Alum inurn roof
"
"
"
Small slope No 130 123 135 Sheltered"
"
"
Steep No 117 88 109 Sheltered"
"
"
Steep No 117 95 . 107 Sheltered"
"
"
Gable No 125 110 127 Sheltered"
"
"
Low Slope No-
187 200 ShelteredGlacier. B. C. Gable No 129 97 200 120 125 Uniform roof load
Mica Creek Village, B. C. Flat Yes 147 86
-
Exposed"
"
"
Flat Yes 140 114 140 Exposed"
"
"
Flat No 165 123 .-
Exposed"
"
"
Flat Yes 200 127 130 Snow removed early in winter"
"
"
Flat Yes 178 144-
Exposed"
"
"
Low Slope Yes 160 124-
Exposed"
"
"
Low Slope No 150 146-
Exposed round water tank"
"
"
Flat Yes 180 125 136 Exhaust fan on roofOttawa, Ontario Flat No 48 36 27
-
111 Multi-level roof. Drift on lower leveL"
"
Flat Yes 48 36 25 13 62 Drift on canopyTABLE III
SNOW LOADS FOR C STATIONS 1966 - 67
(All loads in 1b./sq. ft.)
Roof Supply Depot Arch Hangar M. E. Garage Cant. Hangar
1965 NBC
Roof Load Max. Max. Max. Max. Max. Max. Max. Max. Max. Max. Max. Max.
Station 80% 60% Ground Avg. Roof Drift Ground Avg. Roof Drift Ground Avg. Roof Drift Ground Avg. Roof Drift
Cornox, B.C. 46 34
-
0 0 6 0 0 6 2 3 6 1 3Edmonton, Alta. 22 16
-
-
-
--
- 21 7 21 20 14 30Cold Lake, Alta. 33 25 30 12 27 26 31 95
-
-
- 27 14 61Winnipeg, Man. 36 27
-
0 0 (Insufficient datal-
0 0 (Insufficient data)North Bay, Ont. 43 32 26 15 32 38 60 132 34 14 85
-
-
-Toronto. Ont. 32 24 8 4 16
-
-
-
12 6 30-
--Ottawa, Ont. 48 36
-
-
-
48 18 57 47 10 53 50 15 57-1966 - 67 SNOW LOADS ON LARGE FLAT ROOFS
Max. Avg. Max. Ground Roof Load x 100
Roof Load Load Ground Load
Location Roof (psf) (psf)
(%)
Inuvik, N.W.T. Post Office 2.8 33. 4 8
Comox, B.C. Arch Hangar 0 5.9 0
M.E. Garage 1.8 5.9 31
Cant. Hangar 1.4 5.9 24
Edmonton. Alta. M.E. Garage 6.9 20.8 33
Cant. Hangar 13.7 20. 1 68
Cold Lake. Alta. U.S. Depot 11. 7 29. 5 40
Arch Hangar 31. 1 26. 3 118
Cant. Hangar 14.4 26.8 54
Saskatoon. Sask. Gymnasium 4. 3 10. 1 43
Winnipeg. Man. Library 7.8 14.7 53
U.S. Depot
}
Arch Hangar Insufficient data
M.E. Garage Cant. Hangar
Waterloo. Ont, Main Engineering Bldg. 12.6 24.8 51
Engineering Bldg. 9.8 18.9 52
North Bay, Ont. U.S. Depot 15.2 26.3 58
Arch Hangar 59.8 38.0 157
M.E. Garage 13.6 33.9 40
Ottawa. Ont. Arch Hangar 18.3 48.0 38
M.E. Garage 9.8 46.9 21
Cant. Hangar 15.1 49. 5 31
Toronto, Ont. U.S. Depot 3.7 7.5 49
M.E. Garage 5.5 11. 6 47
Quebec, P.Q. Gymnasium 1.3 55.5 2
Pavillon Vachon 24.6 55.5 44
Ar vi da, P.Q. Rolling Mill 7.8 41. 4 19
Goose Bay. Lab. U.S. Depot 25.8 57.7 45
NO. C STATIONS 15 COMOX 16 EDMONTON 17 COLD LA KE 18 WINNIPEG 19 NORTH BAY 20 TORONTO 21 OTTAWA 22 GOOSE BAY NO. A STATIONS 1 INUVIK 2 EDMONTON 3 SA SKATOON 4 WINNIPEG 5 WATERLOO 6 TORONTO 7 KINGSTON 8 OTTAWA 9 STE. ANNE DE BELLEVUE 10 ARVIDA 11 P. E. I. NATIONAL PARK 12 HAll FAX 13 GOOSE BAY 14 GAN DER ...
,
<, セGGGGGGGG/ ... . .../
/"'-'-'-i-'-'
/
.
;
.
ll'
i / . . I \ Z-A4 .
i
\. 16-C31
tCJj
セ I . Ii
i
3 - A . .... ...\.
!
_
i=!
... -J I : i t :4'-A .- .. -.;._ ..⦅セ 18-C / / I:A / <,",
/ GROUNDᄏセ
LEGEND[セhSU
MAX. AVG 20 セZ MAX.
ROOF LOA D 10 5 LOA D
LOAD IN LB/SQ FT 11966-67)
FIGURE 1
I -« l -V') V') z o
-
« VMVllO I -« V') c « o ....J )lIAnNI XV.:I11VH セ 30nvセ N oNャnoセoャ セS、innim 00U31VM nPQsセniIi N01NOW03 AV8 SsPPセ N001V)lSVS voiaセv 3nA31138 30 3NNV '31S )Iセ Vd lVNOllVN'I'3'd o...
I
,...
...
i
' - - - rエG M M M M M Mセ M I ra u QJ E o c....
QJ .r:: c.. V') >< >< ra ra .. ::;E ::;E peol iooセ 。ャア・セLNN c peot ioッセ le 1.:1 r: セ peo
j pu no
io
c.:> :J8N セYVQ _a...-_ _....,セ 0 0 a:: 0 0 "C a:: QJ....
"C QJ QJ VI QJ 0 c.. s: >< V') I.Ll....
....
0 0 l..L. l..L. 0 0 0 0 N 0 00 -.c....
....
Zl.:l/81 NI 0'101·
u.·
tn·
a.·
c <C o -'NUMBER INDICATES /
GAUGE LOCATION
/
OF MAXIMUM
/
/ /,
...
...
,
,
,
,
---TIME, DAYS
LEGEND FOR FIGURES 3 TO 24 INCLUSIVE
MAXI MUM ON
CANOPY OR
LEAN-TO ROOF
ETC.
MAXIMUM)
LOA D
ON
AVERAGE
MAIN
ROOF
MINIMUM
60 FEDERAL SLOG. 40 ,-,
---
---
\
,-, FEDERAL SLOG.セL
セ ,, ,,. (EXPOSED, HEATED,INSULATED) 20 ,----'
-'
120' - , ' GセM I' 'I--
--,-.;::C;-- 4 I zI I I " I I I ""
,
12 I 3 エセ·
.
}
0 a,
L.-- 3 I I so "'0',.£.,·
•
·
5Ell':
60 SAETZ RESIDENCE ; ;.
i
7 40 0-v:
----8 -' Lセ " セ SAETZ RESIDENCEI
,
(EXPOSED, HEATED, INSULATED)20 I
--
,_...-
1 1-セ
36'-"
...
, I \---t-- i I - I NセNNMM·
·1
MMセ 1--- »-: • 4vセ
: ; '"'
SO'V
60OJ
' '=J
SCHOOL SLOG. S• 10• 18' 40 セ 2 /r- _ _ _ _ _ - '.. I. IS' ,I ,'"
-, ,-
,"
20 »> - - - '-'" . '----
-
SCHOOL SLOG., ..:l.-;-- - ..-l-:5 355 25
, ,
セ,
....l--i.•
..I.. (SHELTERED fROM SOUTH ,lOW HEAT)0 I
,
,
'2'
I I
\
;,
,
II OCTOBER NOVEMBER DECEMBER JANUARY FEBRUARY MARCH APRil
•
'"
\
...
:I: セ セJ
'-'V
セ .: 120 -' OJ-セ9
•
0 z '" so セ セ 0...
!<i セ -' :::> .:»:,.
40 :::> '-' '-'"" セ ALL METEOROLOGICAL READINGS TAKEN AT
oセ DEPARTMENT OF TRANSPORT METEOROLOGICAL
60 • STATION, INUVIK セ 0
.+,
z . s"
"
i セ 40 ,\ I \セ⦅OMサ
GセBエ セ ZZeセ WItiIOdirectャonセMMMセj
\,
I • QQNセ(_yV
セ \OLセ
SNOWFALL,..
...,.J,
!\1----
't. \- \ / 'V). ;iセ 20 10CTOSER - APRIL) 0 .-NORMAL 1966-67 59·7' 53·S' 0 50Mセyi
セセ 32セ
- - - ---...
'"
./ AA/\
011. 0 FIGURE 3 z , .vYJ
\j'
vr:
rJ\
A /V
'-¥J"'v
f'AJ
"" ... セ...
-40SNOW LOAD OBSERVATIONS ON ROOFS Year: 1966-67
100
ROOF DESCRIPTION
8 0 1 + 1 + 1 + +
-60ヲMMMセ ___L___ + +-- --+ ---1L_ _+---_____j
MINING STORE SHED
4 0 1 - - - , - - - - 1 - - - + - - - - f - - - - + - - - 1 - - - j 2 0 1 - - - + - - - - 1 - - - + - - - - 1 - - - - + - - - 1 - - - j o 100 v---' セMMMセMM Nセ - - -=l,t;:.Ol;.:-"-'.:i23,. ' 2 ,-:.. s
Mining Stor. Shed
N
...
(Sheltere<l, Unheated Bldg.) 80 .......
• e-, 60 <>..
ADMINISTRATION BLDG.s
40 Administration Bldg. 74' ! r-t>A I 2 0 1 - - - - _ + - - - - 1 - - - _ + - - - - 1 - - - + - - - + - - - 1 o セa10
-1 +:1.11 -'.t-2 , Exposed , . ! Heated -',--Insulated Section'A-A-OCTOBER NOVEMBER DECEMBER JANUARY FEBRUARY MARCH APRIL
120
80
セ
40
.>:
V'" ALL METEOROLOGICAL READINGS TAKEN AT
L---r--'
EDMONTON CITY 0 ---60 N.+,
s FIGURE 4 SNOWFALL (NOVEMBER-APRIL) NORMAL 1966-67 47·6" 63·5"...
-46 a-'"' 0 w .... c w w a-'" 201---+Ifr--'=r---/\--AAH'---.----.I-\-It-llc."".._HHA-o..--fh.-HI-M---+l---4".'-A...".,I\-A-,.---j :r BGTPiMMMMMKMMMMiMMMMMKMMMMiMMMMKMセ]]MMMQMMMMMMMMェ :Ii ...J ...J セ ;0 o z '" <> w セ ...J :::> セ <> <>..
SNOW LOAD OBSERVATIONS ON ROOFS Year: 1966-67
60
314 LAKEcresceセt
ALL MINIMA ARE ZUO \
40 T""' ---- セ
..
314 lakeCrescent. \ 20-913r
--
--
,? . ! -3 I --- --- ---1.8 78 - - - ----
4D
-r. • , 2 ,4
:37' ' '5 7 ' ; 0 セ .& d. --l 80 +-._---- Mセ(Exposed, Heated, Insulated) 60
133-107'· ST.
ALL MINIMA ARE ZERO
セ
40 N lJJ - With 51.....
>-...
*"
20 - --- --+- n I . :}'I'
L:l
-. ' 4. ゥRTGセV、 0 --.--itO iZセ セZU
..
.--
.
0 -セMMMUW -' ;--- - - - - " 5 ----
i 45'..",N i 0 580 i (Exposed, Heated. Insulated)
I I I ! セMMMMM i 60 1 I I OUTDOOR TESTstatャoセ I 1 I I i , N 40 --+- Outroor I I ! I Test
•
: ii
I Station I1'/
' 4 .71'
I I i ICI}3'
20---" ---i , ; .7 •.5·.51 !!J4' I , iI.;
i I i ,G NセAjN I I.-
-- -- ---J -i_---r- I 30' I 0 I , , - - - ; , I 1 : :(E xposed, Heated, Insulated)
OCTOBER NOVEMBER DECEMBER JANUARY FEBRUARY MARCH APRIL
'" w :<: '-' セ 120 ::j if セ 0 セ 80 0 w !;; -' :::> { セ 40 3 ALL METEOROLOGICALreadiセgs takeセ AT '-' i . r
-...r saskatooセ AIRPORT WEATHER OFFICE
-e 0 .r:" 60 0 セZゥ 40 セGB
セセ
... ,,('INODIRECTION セ ZZ。Zセ.+,
,
.. \ 1/ J /1M
.AiAA"
jセa セ
A
セ
Cioセ セ
J J
セセセ セ aセ
sセowfall ow セ'\ it..
."' 5 x'" 20 HセovemXerMapril )..
'" セセB
V キキカLセ /VVW
' 'VVrV
"'vv
セ
Vw
セormal 1966-67 38·8" 55'3" 0 50セMエfG
セ
セ...
32'--:».
-,1.,-iiC--"
-Ci • M!'-
IAA
fir
0 FIGURE 5(A) z'" 0-..
セ \J\j
V\jvJ
'vvvv
'v "'"'セ^M -40SNOW LOAD OBSERVATIONS ON ROOFS Year: 1966-67
100
ROOF DESCRIPTION
80
60
GYMNASIUM
セ
ALL"INI"'"ARE ZERO
...
40 Gymnasium \
,
'2 J 20 - - - 1/'37:" d I セ----
Mセ セMMM[[NNNM セ ·8 • ? +.'''2
, 0 ---. MBBセMM -100 .7.
"
-'.
SOL - - _ --- ---.'----_. 1 22,7 .1 N .... eクーッウ・セ h・。エセ Ventilated...
..
'1 Parapets 60 ,-c N.R.C LAS '"9 All IIIININ'" AI£ ZERO セ
40 NRC lab.
セ
ISL...イセ
'I]
20 -- - - - -r--- -_.._ - - - - iiコWセ ' • .....- iiNH[セ 5,' セ セMNN[MMMセ -'-- I I'--;17/
I
----
セM 0 ---,_._.... -! 38 I II:;
.+i:
1]'+'
.7 .(; Detail A (Exposed, Heated, InsulatedlOCTOBER NOVEMBER DECEMBER JANUARY FEBRUARY MARCH APRIL
'"
...
:I: U セ .: 120 -J セ セ セ SO c...
!;< -J / ::> 2 40::> ALL METEOROLOGICAL READINGS TAKEN AT
u u
セBBGB
SASKATOON AIRPORT WEATHER OFFICE'" 0 , / 60 セ 40 2
•
'I \W )
iセセd[セt[
Ii 1/.+,
), :... ci1M
Nセ
..
!
Nセ
)
In
I\J\
J
イセサセ
;J
i SNOWFALL...
5 r\A..
...
g; 20r
V 'IVv,,,",
In
W' ·v
v
rv
IV'V
vVI
·v
セ (NOVEMSER-APRIL I NORMAL 1966-67 3S·S· 55'3' 0 ---50 32f-イセャc
セMr
セYl- -
MセIA
セ
-
,J
セMエjE
セ
セ 5(B) セ 0 FIGURE...
uy
V\jvi
'vyVV
v
.... -40SNOW LOAD OBSERVATIONS ON ROOFS Year: 1966-67
80f - - - " " - - -I--"
60 SouthWing of Ubrary
SOUTH WING OF LIBRARY ャセ Above Roof ,
40
,.
,
{[., T.
3
20 - .9 6 /6--- -
-7---12 - I I13
.8 .5 2-セセ 0 2 セ セMMM .7 _GO. I. 100 I 77'-(i.1
Exposed.HeatedIInsulated80 Not Ventilated.Unheated Air Space
N
...
"-:If.
60 0 AGRICULTURAL ENG BLDG <t '3 II
ALL MINIMA ARE ZERO I
40L _ _ "---,"- - - - + - - - -- - - --_.. -.----,
..
Agricultural Eng. Bldg" /4/3 20 T,,--i
I---
'20-.5 . / j .12\/'7
セN セ
セ V---
U
• /4 .8 5. セ.... 0 • 9 • .11セ 4' 'l-2/ セ . / ./0 .2 3. --i 51Above Roof- - - New Crop Research Bldg.
Sheltered1Heated. Insulated
At1ic VentilatedIUnheated
NOVEMBER DECEMBER JANUARY FEBRUARY MARCH APRil MAY
U> 10' :I: U g .: 120 -J セ
•
0 セ 80 0 10' セ -J »-r": ::::>:-::::> 40 ALL METEOROLOGICAL READINGS TAKEN AT
u
u<t
--
WINNIPEG INTERNATIONAL AIRPORTセ V 0 60
,
0.+,
S IW1NDDIRECTION セ セ 40I
'" Iセaセ ィセ
セ
'I'
セ Zeセ hIA
; ; ; 0IJJA
A
セ
A
セm セaNaセi
セイ
LZj|セa
I
SNOWFALL ow .10' セ S; 20 (NOVEMBER -APRILI'" セケ V VV V V'
'\J
'IIV'Yf
TTTl
VVV
V", ,V
NORMAL 1966-6747A' 46"9" 0 50
セ
32セ
; s:
セMエaMセj
- - - -r;
-r"
-セ A At'
FIGURE c, 0 6 セ 'Vw
'V
VV'
"VVf7J
...
-40SNOW LOAD OBSERVATIONS ON ROOFS Year: 1966-67
80 ROOF DESCRIPTION 60f - - - ' - - - + - - - / - - - + - - - - + - - - / - - - 1 254 SUNVIEW 40I - - - , - - - - + - - - + - - - \ - - - - + - - - / - - - j 254 Sunview 20f - - - + - - - - f - - - + - - - - j - - - + - - - j - - - j f--'---'! 80 ..
_-_
...' -...セセZMMGMMZセセ
-t s(Healed, Insulated,Exposed)
60f - - - ' - - - + - - - / - - - + - - - + - - - / - - - j MAIN ENG.8LDG. MainEng.Pldg. 40ヲMMMMセMMMMNMMNM ---+---+---+---+---1 ....-, , _4 - _ 5
,
20iMMMMMKMMMMKMMMMMKMMMMMMMMヲセセBBG[セG / ' , I , ' - - _ " セ s.s , __ セBMRG AJ2 b:Q 5 ,.A o 80 ,·U60f - - - ' - - - + - - - j - - - + - - - - + - - - + - - - j IHeated, Insulated,Exposed)
ENGINEERING 8LDG OSOセ 0" : El-e FIGURE 7
t - j
SNOWFALL (NOVEMBER-APRIL) NORMAL 1966- 67 53·1" 74·6" (Heated,Insulated, ShelteredIALL METEOROLOGICAL READINGS TAKEN AT DEPARTMENT OF TRANSPORT METEOROLOGICAL STATION AT KITCHENER,ONT.
M
MAY APRIL
MARCH
WIN DATA UNAVAILA8LE
NOVEMBER DECEMBER JANUARY FEBRUARY
t
LセャエZ、[MjセGt
セ セ|L
'
4 O f - - - - , - - - + - - - + - - - - t - - - - + - - - + - - - j V> W :J:: U セ .: 120 ..J Ii' ia 0 z V> 80 0 w !a ..J :::> 2 40 :::> u u « 0 60 0 セZゥ 40 ia'" セ ::I. Cia セセ xc.. 20 «V> ::E 0 50 セ ... 32 セ 0 zc.. 0 «::E WW ::EI--40 1 - - - - 1 - - - - + - - - + - - - - + - - - - + - - - + - - - - + - - - 1-z-.-SNOW LOAD OBSERVATIONS ON ROOFS Year: 1966-67
II DOUGLAS CRES I -.5G· tl'7 • ...J 33 i 1.1 -: _Li·1 ? 11 Douglas cres 37 21 DQuSI"Cres . . . セ /? \
'1)
jol5'11
LJj
b,
セセ セZ
IjM'
Sheltered 37 - G : Bldg. Healed Attic Unheated Ceiling lnsulateo + --: I 7 Iセ
I : 21 OOUGlAS CRES I - - - ' - - - + - - -L
1-
MMMャMセMM
I I I j so 60 40 20 0 100 SO t;: :t-60 0 « '3 40 20 0(Sheltered, Heated, Insulated}
I
I
I Ii
NOVEMBER DECEMBER JANUARY FEBRUARY MARCH APRIL MAY
FIGURE 8
SNOWFALL
(NOVEMSER -APRILI
NORMAL 1966-67
54·S" 67-7"
WIND READINGS TAKEN AT ISLAND AIRPORT; OTHER METEORlOGICAl READINGS TAKEN AT 315 SlDOR ST. WEST,TORONTO. I I I I I I I I I I I I ! , I I I I
r1
v---'
I I j I I I i i I </> .., :I: U セ 120 -' -' ::t セ 0 Bi SO 0 ..,:3
::> :0; 40 B u « 0 60 o セ セ 40QMWMMMMKMMMMMMKMMLLMGGMMセM⦅⦅i⦅M⦅⦅KMMM⦅K⦅MMセ⦅K⦅MM⦅⦅⦅⦅⦅⦅ェ セ セᆳ <;0 0..,..,
セ l})20QKKセMMMiイMM⦅⦅iw⦅Kj⦅ヲQ⦅セヲ⦅GKェエmMihM⦅⦅ャQj⦅⦅jTN\iエ⦅BGャ」⦅hK⦅Kャ⦅⦅v⦅G⦅⦅Mセェ⦅NN⦅ャKエ|j⦅⦅|⦅⦅a⦅⦅ャ⦅O⦅セ⦅NNNiK⦅j⦅ャ⦅⦅⦅K⦅MM⦅⦅⦅⦅⦅⦅ェ :0;SNOW LOAD OBSERVATIONS ON ROOFS Year: 1966-67
100
ROOf DESCRIPTION
60
60
26 EDGE HILL 26 Edgehill
40 ' - - - /4 7[/" I 40' I I 20
VセG
セ[SZZセL
- r ; . ' 7· セi セ Mセセ「[[L
-..:: -, B- 1.. 0 -100 ----_.- Sheltered IAttic not Heated
+-6ldg. Heated
セ
80 Insulated .... "-It' 601--- --'" McNeill House <[ McNEILL HOUSE :3 ir
.1 .4"---7· 40vv-
r\
3r. .2 . j ,5. I1
/-1-40,セL
7 7 20 .J • r.,
.
I....
セaセLLW
I NXWBセ I..
セ ..., N 0 ! セ Exposed Insulated IAttic not Ventilated Attic not Heated 61dg. Heated Parapet Z6"
I
NOVEMBER DECEMBER JANUARY FEBRUARY MARCH APRil MAY '" w :c u I ;l; -' 120 -' rt セ 0 z '" 60 '" w li rr: -' :::>
,..-.---'"
40 :::>セ
ALL METEOROLOGICAL READINGS TAKEN 8Yu
セ KINGSTON, ONT_, HYDRO
0 60 0 セZゥ 40 セ。N セ セセ
< [ 0 WINO DATA UNAVAILABLE SNOWfALL
OW
i
セ 20 (JANUARY- MARCH) NORMAL 1966-67 42·5· 47·5· 0 50 /1•
/ ' セオN 32 - - - - -1-\fJY\
Vlf\fVV\
\f'JVV
MMMMセ -セ 0 zQ. FIGURE 9 < [ 2 0 Y ww 2 .... -40SNOW LOAD OBSERVATIONS ON ROOFS Year: 1966-67
,10 .v FairhavenWay .IG 40A 80rker Blvd_ I.7 ,. .111 .07 1.8 z.
I.'
J. el21 . , I.101-c=:
jセG
,I
(E,posed,Heoled,InsuloledI H· II' (Sheltered, Heated, In,ulaledlDavidson Cres.
セ
ii
12-J
セセZZZ・、
AirSpace • 7 . . , Ceiling In,ulate<ll4" B セ 10 5+' Heatedbャ、ァセ •G 5. Flat, 10'toEave, .1 .23 4 I 7/" '1-+-z-セN
<, MAY+
セONQS
Ij' 13' I APRIL MARCH I i FEBRUARY JANUARY --,---...--_...- 9 89 I- ----DECEMBER NOVEMBER 60 OAVIOSON CRES. 40 20 0 ----. 80 60 FAIRHAVEN WAY 40 I >-セ 20 f---.----l-*'
'" I "" '3 r " 111 14 0 80 I 60 I40A BARKER BLVO 40 I 20 : 0 Yセ o 60 I ! i I
-ALL METEOROLOGICAL REAOINGS TAKEN AT OTTAWA INTERNATIONAL AIRPORT
SNOWFALL (NOVEMBER-MARCH)
NORMAL 1966-67
B2·6' 96·3'
FIGURE 10(a)
SNOW LOAD OBSERVATIONS ON ROOFS Year: 1966-67
BO ROOF DESCRIPTION 60 72 BISHOP 40 I I
--セ セ , , r:"----
.../ 20 vセ
LᆱMセQ /7r-: , ' - -セLLセ
セL",
0,'"
'
" BO 72 Bishop Blvd. 12 Nt;: 60"D
セpGMBN
セG 40 BARKERT.J.B
'" 40 QQZセ:
セ..
'3 -"... lExposed, Heated, Insulatedn
セ r, '\ /---../ , _ _ _ _ _.______ __セ________----L.- \ , , 12 セ 20 -I / .. __.J セ [:/""40 Barker Blvd. • _
セセセセ
U
^MSPセ <:----セセ
r
Nセ.
0 _セ r ' _______ T:1 0 · ' ]24a
4-BO I I I...11·1
.
I IExpose<l, Heated, Insulaled 2"1
I I I
-2-.-
セェRGMMMェ 60 I I I ;-Lt::J
T";"
DB_R I I IT
セGTG 6· I I J2' j 40 I ,I
1
..
7 :.? I I I «to I LセMMエMMMMMMNLJ....
, (ExlIose<l, Heated, Insulated I--. . , ., ' , - - I 20
Gセ
セr.
1 .- セ 0 MセM i I I INOVEMBER DECEMBER JANUARY FEBRUARY MARCH APRIL MAY
V> I I
...
i I :I: U I ! セ I 120 I I セALL METEOROLOGICAL READINGS TAKEN AT
セ
セ
I
i r - OTTAWA INTERNATIONAL AIRPORT.
;a I 0 . / z V> BO I
セ
'"...
ti セ :> セ 40 I uセ
セ 0 ...r--60 i N.+,
I I I '" 5 ! セ セ 40 , セ セセ IWIOODIRECTI,1
.1セ
Nセ
,
i!8It'M.-T
7\
t)r
A- .j'aセセ
1
SNOWFALL...
(NOVEMBER - MARCHI セ セ 20rru
VIJ
QセG|ェv
セijサヲwG \tv'V"U
V
V ,iy-rv--;W
NORMAL 1966-67 B2'6' 96·3' 0 I 50Ii£\
M 11セH
32v
V'v;Jrv1\7\
- - - 1 1 -u, "VVセaaLm
セ 0 FIGURE lO(b) f- I V VV
v -40SNOW LOAD OBSERVATIONS ON ROOFS Year: 1966-67
I----+---+---+-- ---+- - - + - - - 1 - - - 1 801---+---+---+---+---+---1 601---"---'--- --- i\.':.e. DOME N
•
I 401---,---,---+---- -- ---- ----.---+----+---1 t N.R.C OOME 110-1---+---- --- - ---+---+----+----+---1 o...
g ヲMMMセMMMMMMMM ---"!'::..".---""'----+----+----+---1---1 --- - - t - - - jNOVEMBER DECEMBER JANUARY FEBRUARY MARCH APRIL MAY
::f
120
rt セ z '" :;: セ セ 401---+---b.-L---+----+----+---j---Ir
60YセャイMMMO
ALL METEOROLOGICAL READINGS TAKEN AT OTTAWA INTERNATIONAL AIRPORT.
セ 401----+---+---+----+----+----+---1 :>i ".OOIRECT"
1:
l'
"-セ
セ セ
- 7\
:
セイ[
1
T ./\ --1\aaセ
iI
'" 20lJ
\J\j
wカjy|jセVl/Il'wl'
IrJlfVU
yセセGMゥw SNOWFALL (NOVEMBER -MARCH) NORMAL 1966-67 B2·6" 96-3" o • 50'1/\ M セ 32 'vv -FIGURE IO(e) -40SNOW LOAD OBSERVATIONS ON ROOFS Year: 1966-67
100
ROOF OESCRIPTION
BOiMMMMMNMMjMMMMKMMMMKMMMMKMMMMKMMMMKMMMセ
POULTRY BLDG (WEST WING)
MAXIMA AT I Poultry oJdg. (West Wmgl
6 0 1 - - - , - - - f - - - + - - - [ - - - f - - - + - - - 1
Poultry Bldg. (East Wing}
Sheltered from West by Moin Roof Heated, Insulated
LLMセLN J I ' / i •j. 7
1
J>tr
91 r--=-,2}1 :·2 ; '5 8·1 ' L L . . . - J 'I 1 I
t
5EqICu.1 A-A LL:i.3"--..;..'--:.!'",---Z..:J0,-",セL
セNMMNRGUPLLMG⦅セ
Sheltered from Eost by Moin Root Heated) Insulated . --: I BBGセMM - --.. _ _ _ J " ....
-iZMセセセNNゥ
\ \ \ \ \\\
\ \ セ・ \ 5 セ 20 I IPOULTRY BLDG. (EAST WING) ALL MAXIMA ARE ZERO
40 20 0 100 80 N t;: jt,-60 <> '" '3 40 20 0
NOVEMBER OECEMBER JANUARY fEBRUARY MARCH APRIL MAY
'" '":r u セ .r 120 ...J セ セ 0 z 80 '" 0
セ
'" Ii ...J r ::>,.
40 ::> J---f u u Ir
'" 0 60 :ALL METEOROLOGICAL READINGS TAKEN AT MONTREAL INTERNATIONAL AIRPORT, DORVAL, PO. SNOWFALL (NOVEMBER -APRIL! NORMAL 1966-67 98 ·7" 72·4" I
W+E
S20 I\N
VIj I'VVIfr
Gjセャヲj
'vi
I,i!IVVW
yrvvV"wU
セ vjセ|i|
o A <> セ セ 40イNjGNMMMMMMKMMMMMヲMMKMMKMセNLN⦅⦅MKMMM⦅⦅ゥMMMM⦅⦅KMMM⦅⦅⦅⦅Q ^Mセ :! -"'0 0 " , .'" >co. "''''
,.
':; セZNGM zoo "',. "'''' ,...--40 -FIGURE IISNOW LOAD OBSERVATION S ON ROOFS Year:
Location:
1966-67
STE. ANNE DE
PAVILLON VACHON , r Pavilion Vachon
/ 1,57
I
'6
セ
セM /0. . 7 +. • /I. .8 5- 2_ / / / 40f - - - t - - - - + - - - - 4 - - - - + - - - I - - - - + - - - i o o« '3 100 I I GYMNASIUM I I II Sheltered, Heated, Insulated, Not Ventilated
20iMMMMKMMMMMMKMMMMMMMMMGMMMMKMMMMMiMNセNセセMMKMMMM⦅⦅ャ o NセL Vi -I 8 5 i .2 /r.1 -c:;
Elposed , Heated, Insulated
NOVEMBER DECEMBER JANUARY FEBRUARY MARCH APRIL MAY </> <oJ :J: U i!: ::I 120 1t 3: 0 セ 80 f---C> <oJ l;; ..J :::> セ 40 :::> u セ -40 I NセMMMMNエMMM⦅⦅KMMM⦅K⦅⦅⦅⦅イ]]Gゥ⦅⦅MMMヲMMMMMMェ I
ALL METEOROLOGICAL READINGS AT QUEBEC AIRPORT, ANCIENNE LORETTE, P.Q.
SNOWFALL (NOVEMBER -APRIL)
NORMAL QYVVセVW
112·4' 1212'
FIGURE 12
SNOW LOAD OBSERVATIONS ON ROOFS Year: 1966-67