HAL Id: hal-01821635
https://hal.sorbonne-universite.fr/hal-01821635
Submitted on 22 Jun 2018
HAL is a multi-disciplinary open access
archive for the deposit and dissemination of
sci-entific research documents, whether they are
pub-lished or not. The documents may come from
teaching and research institutions in France or
abroad, or from public or private research centers.
L’archive ouverte pluridisciplinaire HAL, est
destinée au dépôt et à la diffusion de documents
scientifiques de niveau recherche, publiés ou non,
émanant des établissements d’enseignement et de
recherche français ou étrangers, des laboratoires
publics ou privés.
The biogeochemical imprint of human metabolism in
Paris Megacity: A regionalized analysis of a
water-agro-food system
Fabien Esculier, Julia Le Noë, Sabine Barles, Gilles Billen, Benjamin Créno,
Josette Garnier, Jacques Lesavre, Léo Petit, Jean-Pierre Tabuchi
To cite this version:
Fabien Esculier, Julia Le Noë, Sabine Barles, Gilles Billen, Benjamin Créno, et al.. The biogeochemical
imprint of human metabolism in Paris Megacity: A regionalized analysis of a water-agro-food system.
Journal of Hydrology, Elsevier, In press, �10.1016/j.jhydrol.2018.02.043�. �hal-01821635�
1/34
The biogeochemical imprint of human metabolism in Paris Megacity: a
1
regionalized analysis of a water-agro-food system
2
3
Authors and affiliations
4
ESCULIER Fabiena,b,*, LE NOË Juliab, BARLES Sabinec, BILLEN Gillesb, CRENO Benjamind, GARNIER Josetteb,
5
LESAVRE Jacquese, PETIT Léob, TABUCHI Jean-Pierref
6
* Corresponding author: ESCULIER Fabien, fabien.esculier@ponts.org, +33 6 75 31 91 54
7
8
a Laboratoire Eau, Environnement et Systèmes Urbains (LEESU) –
Web site
9
AgroParisTech, École des Ponts ParisTech (ENPC), Université Paris-Est Marne-la-Vallée (UPEMLV), Université
10
Paris-Est Créteil Val-de-Marne (UPEC): UMR MA-102
11
Address: LEESU, ENPC, 6-8 avenue Blaise Pascal, 77455 Champs sur Marne cedex 2 France
12
b Milieux Environnementaux, Transferts et Interactions dans les hydrosystèmes et les Sols (METIS) –
Web site
13
École Pratique des Hautes Études (EPHE), CNRS, Université Pierre et Marie Curie (UPMC) – Paris VI: UMR7619
14
Address: METIS, UPMC, Case courrier 105, 4 place Jussieu, 75005 Paris France
15
c Géographie-Cités –
Web site
16
CNRS, Université Paris I – Panthéon-Sorbonne, Université Paris VII – Paris Diderot: UMR 8504
17
Address : Géographie-Cités, 13 rue du Four, 75006 PARIS France
18
d Ecole Nationale des Ponts et Chaussées (ENPC) –
Web site
19
Address: ENPC, 6-8 avenue Blaise Pascal, 77455 Champs sur Marne cedex 2 France
20
e Agence de l’Eau Seine Normandie (AESN) –
Web site
21
Address: 51 rue Salvador Allende - 92027 NANTERRE Cedex France
22
f Syndicat Interdépartemental d’Assainissement de l’Agglomération Parisienne (SIAAP) –
Web site
23
Address : 2 rue Jules César, 75589 Paris CEDEX 12 France
24
25
Keywords
26
Biogeochemical imprint; water-agro-food system; urban metabolism; megacity; nitrogen cycle; phosphorus cycle.
27
28
Abstract
29
Megacities are facing a twofold challenge regarding resources: (i) ensure their availability for a growing urban
30
population and (ii) limit the impact of resource losses to the environment. This paper focuses on two essential
31
resources – nitrogen and phosphorus – and challenges their sustainable management in the water-agro-food
32
system of Paris Megacity. An in-depth analysis of the nitrogen and phosphorus imprint of Paris Megacity was
33
2/34
conducted, originally centered on human metabolism through consumption and excretion of these two elements.34
Upstream, the whole agricultural production that feeds Paris Megacity was scrutinized and nitrogen and
35
phosphorus flows in the agro-system were fully documented. Downstream, the analysis of solid waste and
36
wastewater management in Paris Megacity showed the fate of nitrogen and phosphorus imported into the city.
37
Paris Megacity appears to rely on a very complex and international agro-food system, requiring high levels of
38
chemical fertilizers and strongly impacting the environment through nutrient environmental losses. On the other
39
hand, solid waste and wastewater management appears to be mostly disconnected from the agro-food system:
40
even if the release of nitrogen and phosphorus into the environment has largely decreased in recent years, their
41
recycling rate remains very low. This overview of the water-agro-food system of Paris Megacity suggests that an
42
optimal management of nitrogen and phosphorus in the three subsystems (agriculture, waste management and
43
sanitation) should be integrated within a comprehensive approach linking agriculture and urban residues. This
44
analysis thus constitutes a groundwork on which paradigm shift scenarios of the global water-agro-food system
45
could be constructed.46
47
Graphical Abstract
48
49
Highlights
50
Paris Megacity externalizes most of the N&P imprint of its water-agro-food system.
51
Animal food production requires 10 to 30 times more resources than vegetal food.
52
Wastewater N imprint per capita is 4 times higher than for vegetal food production.
53
Urban residue management in Paris Megacity is poorly connected to agriculture.
54
Imprint minimization requires integrated nutrient policy at local & global scales.
55
3/34
1. Introduction
57
Born of a process of sociospatial specialization, cities are characterized by the externalization of most of their
58
metabolism – the flows of material and energy necessary to sustain urban life and urban functioning – and by
59
their dependence upon various areas and ecosystems located outside their boundaries, for both the supply of
60
resources and the disposal of waste. The industrial era has increased this dependence and remoteness to the
61
point that the urban environmental impact is greater in these supply and emission areas than in the city itself
62
(Barles, 2015). Today the imprint of urban environments can be found throughout the world (Billen et al., 2012a)
63
and for every environmental compartment, water being one of the most impacted. Cities’ dependence upon
64
remote areas also questions their sustainability and their ability to face socioecological crises that could impact
65
their metabolism as a whole: climate change and extreme climate events, change in geopolitical conditions,
66
economic crises, etc.
67
More than other cities, megacities are characterized by their huge need for material and energy (Kennedy et al.,
68
2015), among which food and water are of utmost importance for the life of their inhabitants. Megacities are not
69
just bigger than most cities: their large and diverse populations, their spatial extension, the amount and diversity
70
of activities that characterize them, the complexity of their functioning make the organization of megacities’
71
metabolism particularly delicate, especially regarding food and water from the point of view of both supply and
72
discharge through waste and wastewater. These have a strong impact on biogeochemical cycles. The
73
characterization of this impact is a key to understanding megacities’ metabolism and to considering change in
74
water and food management. This makes it necessary to (i) identify the main biogeochemical flows in terms of
75
socioecological relevance and to analyze the biogeochemical processes involved, (ii) quantify these flows and (iii)
76
locate them at the different stages of their circulation.
77
Nitrogen (N) and phosphorus (P) can be considered as the most critical biogeochemical flows regarding their
78
socioecological impact. Steffen et al. (2015) put forward nine main control variables of the Earth system and
79
suggested planetary boundaries under which these control variables should stay to prevent major shifts in the
80
regulation of the Earth system’s stability. Along with biosphere integrity, N and P flows are considered to be in the
81
highest risk zone, ahead of the climate change control variable. The concern about disruption of N and P cycles
82
has been broadly studied and documented. It is of particular significance in Europe where the N cycle intensity is
83
about five times greater than the biospheric cycle, leading to substantial negative damage, from aquatic and
84
terrestrial eutrophication to poor air quality and climate change (Sutton et al., 2011). The environmental dispersion
85
of P is also a matter of concern regarding fertilizer and therefore food production (Cordell, 2010). Phosphate rock
86
has recently been added to the list of critical raw materials by the European Commission (European Commission,
87
2014).
88
4/34
Megacities play a major role in N and P flows and depend on them. Urban dwellers’ metabolism is embedded in a89
complex worldwide water-agro-food system resulting in an equally complex biogeochemical imprint. Some studies
90
have provided an overview of urban metabolism through substance flow analysis regarding N or P
(Svirejeva-91
Hopkins et al., 2011; Færge et al., 2001; Forkes, 2007; Barles, 2007) or considered the impact of urban waste
92
and/or wastewater on the environment (Morée et al., 2013). Others have focused on the urban food-print and
93
show the relevance of a spatialized approach (Billen et al., 2009, 2012a, 2012b, 2012c; Chatzimpiros and Barles,
94
2013). However, it seems important to entertain a broader view and to explore both the downstream and the
95
upstream imprint of urban metabolism, as demonstrated by Schmid-Neset et al. (2008) for P. This approach
96
contributes to characterizing the current socioecological regime (Fischer-Kowalski and Haberl, 2007) of
97
megacities.
98
In this paper, we therefore focus on Paris Megacity, and the N and P flows involved in its food production, supply,
99
consumption and discharge. To determine the biogeochemical imprint of human metabolism in Paris Megacity, its
100
water-agro-food system has been divided into three subsystems: (i) food production in the agricultural system that
101
feeds Paris Megacity, (ii) food waste management from production at the farm to the actual ingestion of food by
102
humans and (iii) human excreta management in the city itself. In each of these subsystems, a detailed and
103
regionalized analysis of N and P flows was conducted. We aimed at qualitatively and quantitatively
104
comprehending the stakes of the biogeochemical imprint for sustainable development of a megacity such as
105
Paris. For the sake of this study, we therefore characterized the imprint of Paris Megacity by the magnitude of the
106
flows of resources (here N and P) required to sustain its food supply and the flows of wastes discharged into the
107
environment as a consequence of food consumption. We also determined the spatial distribution of these flows.
108
5/34
2. Material and methods
110
As recommended in the early work by Baccini and Brunner (1991), the borders of our system are defined in this
111
section, as well as the key issues selected.
112
2.1 Spatial and temporal frame
113
2.1.1 Spatial frame
114
The urban agglomeration of Paris is ranked the 25th largest city in the world by the United Nations (United
115
Nations, 2014). It is the largest city of the European Union and, with a population of more than 10 million
116
inhabitants, it is classified as a megacity. The definition of a city remains controversial and the setting of its
117
boundaries can vary greatly depending on the definition adopted. In this paper, we choose to follow the French
118
National Institute of Economic Statistics and Studies’ (INSEE, www.insee.fr) definition of the urban unit. The main
119
characteristic of an urban unit is that the distance between two inhabited buildings does not exceed 200 m. In this
120
sense, Paris Megacity is composed of 412 municipalities totaling 10,550,350 inhabitants in the official 2012
121
census and has a density of 3,700 cap/km² (INSEE). The term “Paris Megacity” will be used in this paper to refer
122
to the Paris urban unit.
123
Paris Megacity as an urban unit should be distinguished from three other perimeters that are also commonly used
124
to define Paris, illustrated in Table 1 and Figure 1:
125
(i) the Paris city center. This is the core municipality of Paris Megacity representing 21% of its population. It is one
126
of the densest city centers in the world with more than 21,000 cap/km² (INSEE).
127
(ii) the Paris urban area. The INSEE definition adds to the Paris urban unit the municipalities where at least 40%
128
of the residents and working population work in the Paris urban unit. Paris Megacity accounts for 85% of the
129
population of the Paris urban area and is five times denser.
130
(iii) the Ile-de-France region. This is the administrative region in which Paris Megacity is included. Its population is
131
about the same as the Paris urban area, but their respective perimeters differ slightly.
132
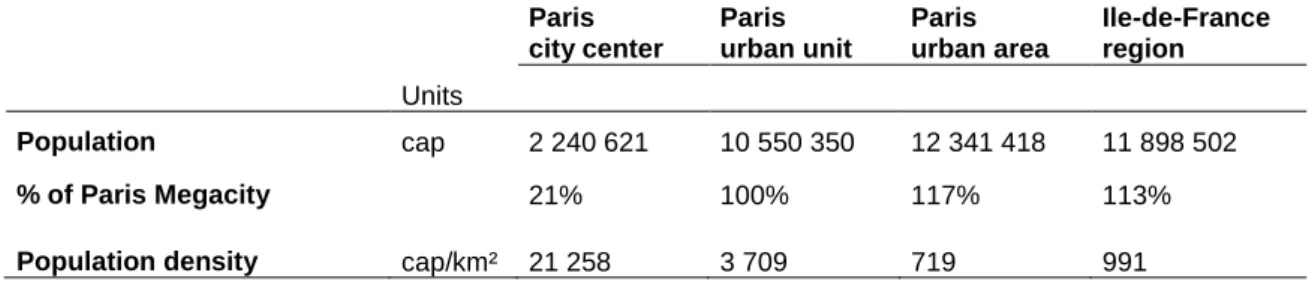
133
Table 1. Population and density of Paris: city center, urban unit, urban area and Ile-de-France administrative
134
region (data: INSEE, year 2012).
135
Paris city center Paris urban unit Paris urban area Ile-de-France region Units Population cap 2 240 621 10 550 350 12 341 418 11 898 502 % of Paris Megacity 21% 100% 117% 113% Population density cap/km² 21 258 3 709 719 991136
137
Figure 1.
138
6/34
139
This study covers the metabolism of people who are actually inside Paris Megacity and the results are expressed
140
in yearly averaged figures. Data from the population census, commuting patterns, tourism and business trips have
141
been gathered from studies conducted by French public institutions (INSEE, authorities in charge of economy and
142
tourism, Institut d’Aménagement et d’Urbanisme de la Région Ile-de-France). They have been used to obtain the
143
yearly average instantaneous number of people actually eating, discarding waste and excreting urine and feces:
144
dwellers temporarily out of the city for holidays or work have been deducted pro rata temporis; nondwellers
145
coming to the city for tourism or work have been added pro rata temporis.
146
147
As stated, the imprint of Paris Megacity largely exceeds its boundaries and each of the three subsystems studied
148
covers a specific imprint zone that can sometimes overlap. Paris Megacity lies within the Seine River basin. It is
149
located 220 km upstream from the estuary where the Seine River flows into the Baie de Seine (Seine Bay), as
150
well as into the contiguous North-West Channel and Southern Bight of the North Sea, and is responsible for the
151
development of harmful algal blooms causing severe damage to fish and shellfish populations (Lancelot et al,
152
2007; Passy et al., 2013, 2016). The Seine River basin has therefore been classified as a sensitive area subject
153
to eutrophication in the sense of the 1991 Urban Waste Water Treatment (UWWT) Directive (European Council
154
Directive 91/271/EEC). The 2015 Seine River basin management plan aims at reaching good ecological potential
155
for 2021, as required by the European Water Framework Directive (WFD) (2000/60/CE), including reduction of N
156
and P concentrations. Moreover, the 1992 Oslo-Paris convention required the Seine River basin to halve its N
157
and P flows to the sea between 1985 and 1995. The target on P has been reached, but the flows of N show an
158
opposite trend of +1% per year over the last 30 years (AESN, 2013).
159
160
2.1.2 Temporal frame
161
In recent years, the most significant changes in the water-agro-food system of Paris Megacity have been the
162
works on wastewater treatment plants in order to comply with the UWWT Directive. This directive requests that
163
the wastewater treatments withdraw 70% of the N and 80% of the P contained in the urban wastewater in
164
sensitive areas subject to eutrophication. This objective was first reached for Paris Megacity’s main wastewater
165
treatment system in 2012 (cf. the dedicated Internet site of the French Ministry of Ecology for detailed information
166
on the compliance with this directive on http://assainissement.developpement-durable.gouv.fr). Therefore we
167
chose to describe the imprint of Paris Megacity in 2012. However, because of constraints related to the availability
168
of data, our analysis of the agro-food system is based on figures from 2006. There has been no major shift in the
169
agriculture since this period (Le Noë et al., 2017).
170
171
2.2 The agro-food system that feeds Paris Megacity
172
7/34
Evaluating the environmental imprint of Paris Megacity over its food supplying areas requires (i) quantifying Paris173
Megacity’s consumption; (ii) identifying the areas supplying food to Paris Megacity; (iii) evaluating agricultural
174
production and environmental losses from agriculture for each area contributing to the food supply of Paris
175
Megacity and (iv) calculating the environmental imprint of Paris Megacity as the fraction of the environmental
176
losses attributable to food supply of Paris Megacity in each contributing area.
177
178
2.2.1 Apparent food consumption (availability)
179
Data on the availability of food commodities, based on the analysis of national accounts, are provided by INSEE.
180
These data correspond to the apparent food consumption of the French population as a whole, including wasted
181
or discarded parts at the retail and domestic level. We have considered that national data on food consumption
182
can appropriately be applied to Paris Megacity, as confirmed by more detailed inquiries on dietary habits in
183
France (AFSSA, 2009).
184
Owing to a detailed compilation of the N and P content of each item from the INSEE nomenclature based on
185
information from the CIQUAL and USDA databases on food composition (https://pro.anses.fr/tableciqual/;
186
http://ndb.nal.usda.gov), all data collected have been converted to tons of N per year (tN/y) and tons of P per year
187
(tP/y).188
189
2.2.2 Agricultural trade190
The trade exchanges of agricultural products between French departments (NUTS3 in the European Union
191
geocode standard, the administrative district between the municipality and the region) were obtained from the
192
French database SitraM (Système d’Information sur le Transport des Marchandises;
193
http://www.statistiques.developpement-durable.gouv.fr/sources-methodes/). It annually identifies the transport of
194
50 categories of agricultural products between French departments by roads, railways and navigable waterways,
195
as well as exchanges with foreign countries (customs database). Automated software has been developed by
196
Silvestre et al. (2015) for the analysis of these data. Le Noë et al. (2016) used it to establish a complete matrix of
197
the flows of agricultural commodities exchanged between 33 French agricultural areas (defined by groupings of
198
departments based on the similarity of their agricultural system; see Figure 3) as well as foreign countries
199
grouped into 12 macroregions (Lassaletta et al., 2014). From these data, the relative contribution of each of these
200
47 agricultural regions to the total Ile-de-France food supply was calculated, separately for vegetal and animal
201
proteins. We assumed that there was no significant typological difference between Paris Megacity’s food supply
202
and Ile-de-France’s food supply; therefore, the food supply of Paris Megacity was deduced by simple application
203
of population ratios.
204
205
2.2.3 Agricultural production and environmental losses of supplying territories
8/34
The GRAFS approach (Generalized Representation of Agro-Food Systems), first developed for N flows by Billen207
et al. (2014), then extended to P and C by Le Noë et al. (2017), describes the agro-food system of a given region
208
by considering four main compartments exchanging N and P flows: arable lands, grasslands, livestock biomass
209
and local population. The GRAFS approach makes it possible to draw direct links between different aspects of the
210
hydro-agro-food system, e.g., the relation between livestock breeding, grassland areas and forage crops and the
211
relation between fertilization of arable lands and grasslands and N environmental losses.
212
The GRAFS approach is based on a detailed budget of N and P flows including production, transformation and
213
consumption of animal and vegetal products, inputs of N and P fertilizers, atmospheric N and P deposition,
214
symbiotic N2 fixation, P embedded in feed additives, leaching and erosion in each agricultural region.
215
The agricultural and livestock production, arable land and grassland surface areas were obtained from the French
216
database AGRESTE (www.agreste.agriculture.gouv.fr/) at the scale of French departments (NUTS3), and from
217
the FAO data base (www.faostat.fao.org/) for foreign countries. They are converted into N or P flows based on
218
coefficients compiled from various sources (FAO, USDA databases,Lassaletta et al., 2014). Fertilizer application
219
rates were obtained by the Unifa (Union des Industries de la Fertilisation), which provides detailed data at the
220
regional administrative scale (http://www.unifa.fr/le-marche-en-chiffres/la-fertilisation-en-france.html).
221
The GRAFS approach expresses the N and P budgets on both arable land and grassland, yet N and P have very
222
different behaviors in soil. N tends to be easily leached after its conversion into nitrate by nitrifying
micro-223
organisms, while P is strongly sorbed onto soil particles. As a consequence, the environmental losses associated
224
with these elements differ and budgets need to be calculated separately to integrate these specificities. For N,
225
nitrate leaching generates water pollution. The N soil surplus is represented by the difference between N inputs to
226
the soil through fertilizer and manure application, symbiotic N fixation by legumes and atmospheric deposition,
227
and N export with harvested products. About 70% of the N surplus of arable land is leached to sub-surface runoff
228
or aquifers, while a much lower fraction is leached from grassland (Billen et al., 2013).
229
230
In the case of P, erosion is the major output flux accounting for P environmental losses. P erosion from
231
grasslands and arable lands is estimated from the soil P content cartography established for France by Delmas et
232
al. (2015) and the erosion rates for arable lands and grasslands proposed by Cerdan et al. (2010).
233
The P soil balance (the difference between fertilizer and manure inputs, atmospheric deposition and export with
234
harvested products and erosion) informs on the accumulation or depletion trend of the P stock in the soils
235
(Garnier et al., 2015). Another discrepancy between N and P budgets rely in the gap of the N:P ratio of vegetal
236
and animal biomass and as a consequence the need for P feed additives to sustain the livestock production. In
237
the present study the feed additives were deduced as the unmet needs of P by the ingestion of vegetal products.
238
239
2.2.4 Evaluation of Ile-de-France’s environmental imprint over its supply areas
9/34
The relative contribution to the total import to Ile-de-France of either vegetal or animal proteins, as calculated from241
the SitraM database, is used as an index for calculating the imprint in terms of agricultural area in each region, by
242
considering their main orientation into either crop or livestock production. The environmental imprint of
Ile-de-243
France was calculated only over regions that contribute to more than 1% of Ile-de-France vegetal or animal
244
supply.
245
We thus define the imprint of crop production of a given region as the total resource consumption and
246
environmental losses attributable to the portion of crop dedicated to vegetal food supply to Ile-de France. This
247
may include some of the resources and environmental losses associated with livestock farming in so far as
248
manure is used for crop production. Conversely, the imprint of meat and milk production is calculated by
249
considering all resources and pollution associated with livestock farming, including those linked to crop production
250
dedicated to animal feeding, without double counting. The details of these calculations are provided in Le Noë et
251
al. (2017).
252
253
In some cases, animal husbandry is based on imported feed such as soybean or oil seed cakes. As a
254
consequence, N and P imports embedded in animal feed need to be accounted for in Ile-de-France’s
255
environmental imprint. This is particularly true for regions depending on massive import of animal feed from South
256
America (Brazil, Paraguay, Uruguay, Argentina and Bolivia). Accordingly, the environmental imprint ofSouth
257
America vegetal production has been calculated and the share of this production imported to the regions of
258
intensive livestock farming supplying France has been included in the environmental imprint of
Ile-de-259
France.
260
261
2.3 Solid food waste generation and management
262
2.3.1 Food waste generation
263
Food waste appears at all stages of the food supply chain: transformation, transport and storage, distribution and
264
consumption. By far the largest amount concerns the transformation of animal products, particularly slaughtering
265
and cutting activities. Taking into account the cutting balance available for each type of livestock (Benhalima et
266
al., 2015), as well as the N and P composition of each fraction (CIQUAL; USDA; Mello et al.,1978; Ternouth,
267
1990; Little, 1984), waste generation (as blood, viscera, grease, bones, etc.) associated with edible meat
268
production can be evaluated.
269
270
Food waste generated at the latest stages of the supply chain can be evaluated by direct comparison of the
271
above-mentioned data on food availability provided by INSEE, with the data on actual food consumption given by
272
a national detailed inquiry organized in 2006–2007 by the Agence Nationale de Sécurité Sanitaire de
273
l’Alimentation de l’Environnement et du Travail (www.anses.fr/), which provides detailed information on the actual
274
10/34
ingestion of food commodities (AFSSA, 2009). Using again the N and P content given by the CIQUAL and USDA275
databases on food composition, the direct comparison of food availability and food ingestion has been made
276
possible, and losses of N and P at the latest stages of the supply chain have been evaluated by subtraction.
277
278
2.3.2 Food waste management
279
N and P flows of food waste management were evaluated by compiling data related to food waste collection and
280
treatment. National data on food waste production and collection are provided by surveys conducted by the
281
French Environment & Energy Management Agency (ADEME, www.ademe.fr): a 2007 campaign characterizing
282
domestic and economic refuse (ADEME et al., 2010) and a 2008 survey of food waste management at the
283
household level (ADEME, 2008). The former study estimates that 75% of the collected food wastecomes from
284
households. The latter study is only semiquantitative so several hypotheses regarding actual flows of food waste
285
being managed on-site had to be considered. A proportion of 10% of household food waste was assumed to be
286
managed on-site in Paris Megacity. The obligation of biowaste source separation by the largest producers is very
287
recent and the circular that specifies these obligations dates from 2012 (Circulaire du 10 janvier 2012 relative aux
288
modalités d’application de l’obligation de tri à la source des biodéchets par les gros producteurs (article L
541-21-289
1 du code de l’environnement) NOR : DEVP1131009C). Given the temporal frame used herein, we consider that
290
only two biowaste source separations are implemented by the largest producers: oil separation in which N and P
291
contents are considered negligible, and bone collection from slaughterhouses and butchers. For the latter, we
292
considered that 5–10% of bones were not collected. Although some bone collection and animal processing takes
293
place inside the city, mostly within butchers, we have considered slaughterhouses and butchers as a whole and
294
excluded them from the perimeter of urban economic activities. Management of biowaste by economic activities
295
and the Rungis International Market were evaluated by a local survey conducted by the French Ministry in charge
296
of food and agriculture (DRIAAF, 2012).
297
Food waste treatment data were collected locally. The Ile-de-France Region Waste Management Observatory
298
(ORDIF, www.ordif.com) has produced a survey of waste treatment facilities in the Ile-de-France region (ORDIF,
299
2014) that distinguishes waste treatment for Paris Megacity and waste treatment of the other Ile-de-France
300
municipalities. Paris Megacity has one major waste treatment authority: the Joint Central Household Waste
301
Treatment Authority for the Agglomeration of Paris (Syctom, http://www.syctom-paris.fr). It covers the densest
302
zones of Paris Megacity and serves 54% of the population of Paris Megacity (Figure 2). Syctom is in charge of the
303
treatment of waste and does not receive any separate collection of food waste. All food waste treated by the
304
Syctom currently goes into three incineration plants located close to the Paris city center in Ivry-sur-Seine,
Issy-305
les-Moulineaux and Saint-Ouen. There are 14 other incineration plants that receive the waste of Paris Megacity.
306
Data on waste composition and waste treatment from the Syctom were analyzed in their annual activity reports
307
and exploitation data (Syctom data, personal communication) and extrapolated to Paris Megacity.
308
11/34
309
2.4 Wastewater management in Paris Megacity
310
The final stage of our N and P imprint analysis stems from human metabolism: food transformation in the body
311
and the fate of its by-products mostly as urine and feces directed to the sewers of Paris Megacity. Detailed
312
calculations are presented in Supplementary Material.
313
314
2.4.1 Flows of N and P outside wastewater collection
315
Three types of losses were considered before release of N and P in sewers:
316
(i) human by-products of metabolism that are not in the form of urine and feces. These by-products can take three
317
forms: integumentary and accidental losses (sweat, hair, menstruation, bleeding, etc.), breathing and N and P
318
stocked in the body. Sutton et al. (2000) estimated that N volatilization related to sweat excretion accounts for 14
319
gN/cap/y, i.e. about 0.3% of N excretion through urine and feces and less than 0.1% of N loss through breathing.
320
Taking into account that many integumentary losses reach the sewers through showering or clothes washing, a
321
general value of 0.5% metabolized N and P not reaching the sewers was taken into account for breathing and
322
integumentary losses. N stock in the human body is estimated at less than 0.5% of total N ingested during an
323
individual’s lifetime. P is mostly stocked in bones and is not negligible. We assume a 1% P content in the human
324
body for a mean weight of 70 kg (INSEE), thus 0.7 kgP total stock in the body.
325
(ii) excretions by children strictly under 3 years of age. They were excluded from the calculation given that the
326
intensity of their metabolism is very limited and excretions are mostly directed to waste bins via diapers. The flow
327
of N and P of their excretions is estimated around 1% of the flow corresponding to the population of more than 3
328
years of age.
329
(iii) excretions of urine and feces that do not reach the sewer network. These excretions mostly consist of on-site
330
sanitation systems. Adapted from Lesavre (1995), 2% of the population of Paris Megacity has been considered to
331
use on-site sanitation or open urination and defecation.
332
333
2.4.2 Flows of N & P in wastewater
334
The flows of N & P in Paris Megacity wastewater were calculated on the basis of operational data provided by the
335
SIAAP (Syndicat Interdépartemental d’Assainissement de l’Agglomération Parisienne, www.siaap.fr). The SIAAP
336
is a public institution in charge of wastewater transport and treatment and it covers 85% of the population of Paris
337
Megacity (Figure 2). The SIAAP operates six wastewater treatment plants including Seine Aval, located on the
338
municipality of Achères, 20 km to the northwest of the center of Paris, which treats the wastewater of 53% of the
339
population of Paris Megacity. About 35 other wastewater treatment plants treat the remaining 15% of the
340
population of Paris Megacity (see http://assainissement.developpement-durable.gouv.fr/ for detailed information)
341
and their operational results do not significantly differ. We thus extrapolated the results obtained on the basis of
342
12/34
SIAAP operational data to the whole population of Paris Megacity. We used SIAAP operational data between343
2004 and 2014 (SIAAP, personal communication). The year 2013 was selected for the results of the treatment
344
plants because it was the first year when routine denitrification in Achères was in full operation. It was also
345
considered representative in terms of rain events and collection efficiency.
346
Discharges from the sewer network were calculated as the sum of dry weather discharges and rain weather
347
discharges as combined sewer overflows. These data were evaluated from the sanitation master plan of the
348
SIAAP area approved in 2017 (SIAAP, personal communication). N & P discharges to the sewer network
349
unrelated to human metabolism were calculated by the difference between metabolic inputs, sewer discharges
350
and treatment plant inputs. Food waste inflows were estimated on the basis of grey water composition (Deshayes,
351
2015; Larsen et al., 2013, chap. 17; Chaillou et al., 2011). N and P discharge in rivers and N and P content in
352
sewage sludge were calculated on the basis of SIAAP data. N2 emissions were deduced by subtraction and N2O
353
emissions were calculated from measurements taken at the Achères wastewater treatment plant (Bollon et al.,
354
2016a and 2016b) and extrapolated to Paris Megacity. SIAAP sludges are either incinerated or recycled in
355
agriculture through direct spreading or composting. Sludge spreading plans were examined to quantify and
356
localize N and P recycling on agricultural lands.
357
358
Figure 2.
359
13/34
3. Results
361
3.1. The agro-food system supplying Paris Megacity
362
3.1.1. Food supplying areas
363
The analysis of the transport matrix concerning the 33 French agricultural regions and foreign countries reveals
364
strong spatial segregation between regions supplying vegetal or animal products to Paris Megacity.
365
Five regions currently provide 80% of the Paris Megacity supply of vegetal proteins, namely Ile-de-France (55%),
366
Champagne-Ardennes-Yonne (8.9%), Loire Centrale (8.4%), Picardie (4.5%) and Eure-et-Loir (3.5%). Those
367
regions are highly specialized in field crop production (Le Noë et al., 2016, 2017) and their production of animal
368
proteins is negligible. In view of their spatial distribution around Paris Megacity (Figure 3), the whole area is
369
hereafter called the “Central Paris Basin” and classified as a “crop farming” region.
370
The animal protein supply is much more dispersed: 19 French regions contribute more than 1% each and
371
together supply 55% of Paris Megacity animal proteins. Three of these regions – Bretagne, Loire Aval and
372
Manche – account for 32% of the Paris Megacity animal protein supply. They are strongly specialized in intensive
373
livestock production, which depends on massive imports of animal feed from South America (Le Noë et al., 2016,
374
2017). As those regions are spatially distributed in western France (Figure 3), the whole area is hereafter called
375
the “Great West” and is classified as an “intensive livestock farming” region. On the other hand, the 16 remaining
376
regions total 23% of the animal protein supply. They are much less specialized in one or another type of
377
production, but they occupy a larger agricultural area; in addition, the proportion of permanent grassland is largely
378
equivalent to that of arable land. These features characterize these regions as “mixed crop and livestock farming.”
379
We call the “Great East” a territory formed by six regions (Loire Amont, Grande Lorraine, Cantal-Corrèze,
Ain-380
Rhône, Isère-Drôme-Ardèche and Bourgogne), which supply 13% of Paris Megacity animal proteins.
381
Furthermore, various foreign countries contribute to the animal food supply (Figure 3). Their local environmental
382
imprint is not directly calculated because of the lack of information regarding the functioning of the agro-food
383
system and the uncertainties regarding their N and P environmental losses. Yet based on literature data (Billen et
384
al., 2014) we have classified foreign countries as being close to the intensive livestock farming or mixed crop and
385
livestock farming typologies. This allows us to estimate the share of animal proteins provided by intensive
386
livestock farming regions or mixed crop and livestock farming regions (Figure 5).
387
Regarding imports of feed to the Great West region from South America, they represent 67% of the 302 ktN/y
388
imported to France. These imports are undoubtedly essential to support cattle breeding in the Great West, which
389
satisfies about one-third of Paris Megacity animal protein requirement; hence South America takes a significant,
390
yet indirect, part in the food supplying area of Paris Megacity that we define as a “soybean cultivation” area.
391
14/34
In summary, our analysis reveals four distinct typical areas contributing to the Paris Megacity food supply, each392
with its own agricultural system/orientation. These regions are (i) the Central Paris Basin, specialized in crop
393
farming; (ii) the Great West with intensive livestock farming, strongly dependent on (iii) South American countries
394
as feed suppliers; and (iv) the Great East with mixed crop and livestock farming (Figure 4a–h).
395
Figure 3.
396
397
3.1.2 The agro-food system of the supplying territories
398
To gain better insight into the agricultural metabolism of each of the four types of territory supplying Paris
399
Megacity, we established the full GRAFS diagram of N and P flows across their agricultural systems (Figure 4a–
400
h). The GRAFS representations highlight the fact that all regions use high inputs of synthetic N and P fertilizers.
401
This is especially true for the Central Paris Basin region since there is no other significant source of N and P
402
inputs to agricultural areas, in the absence of livestock. The very high crop production even leads to a negative P
403
soil budget (i.e., a depletion of P) on cropland. The very specialized Great West region is characterized by a
404
strong dependency on feed import, low grassland area and intense N surplus from arable land, the source of
405
environmental losses. In contrast, the Great East region is characterized by a large grassland area, food and feed
406
self-sufficiency and smaller surplus on arable land. Finally, South America is also defined by large grassland
407
areas, food and feed self-sufficiency, but shows a very export-oriented metabolism since 58% of its vegetal
408
production is traded internationally.
409
Figure 4.
410
411
3.1.3 Environmental imprint of Paris Megacity food supply
412
As stated above, the imprint of Paris Megacity food consumption in each supplying area is defined as the
413
resources consumed and the environmental nutrient losses, which are attributable to the food supply of Paris
414
Megacity. Table 2 summarizes the calculated imprints over the four main supplying areas which contribute 62% of
415
the total protein supply of Paris Megacity. Overall, this agricultural area is estimated at about 2.5 million ha of
416
which approximately one-third are grassland areas, almost all located in the mixed crop and livestock farming
417
area. When these absolute numbers are reduced to the population of Paris Megacity, it appears that 0.26 ha is
418
required for this part of the food supply per inhabitant (62%). Of these, only 0.011 ha, less than 5%, is dedicated
419
to the supply of vegetal proteins, the remaining being mostly devoted to meat and milk production. The total
420
nitrogen imprint of these agricultural activities across these areas is estimated to be a surplus of 114 ktN/y with
421
15/34
about one-fourth of this surplus in grassland and a NH3 volatilization of 38 ktN/y. Yet it is necessary to take into422
account that environmental consequences of the N surplus on arable land and on grasslands are significantly
423
different. On arable land, about 70% of the N surplus ends up in the hydrosystem (Billen et al., 2013). In contrast,
424
N inputs contributing to the N surplus in grassland, below a threshold of 100 kgN/ha/y, keep accumulating in the
425
soil organic matter pool (Billen et al., 2013). Accordingly, the surplus observed in grassland should not necessarily
426
be viewed as a negative environmental impact, as it accompanies the increase of the soil organic matter pool.
427
The P eroded from those areas feeding Paris Megacity is estimated to reach 3.2 ktP/y with 95% derived from
428
arable land. However, it is difficult to determine the amount of P reaching the surface water because eroded
429
particles can accumulate in downhill and riparian sectors.
430
More specifically, it appears that the mixed crop and livestock farming area is the most costly in terms of the
431
surface required to feed Paris as well as of N and P fertilizers and N surplus on arable land. However, this area is
432
almost self-sufficient since it requires low net imports of feed from other regions to sustain its livestock production.
433
In contrast, the intensive livestock farming area imports a substantial amount of feed from South America, making
434
these two areas part of a same system. With this in mind, it appears that the environmental imprint of Paris
435
Megacity is not so different for both systems and is higher in terms of P surplus on arable lands over the intensive
436
livestock farming/soybean cultivation regions.
437
438
Table 2. Estimation of the environmental imprint of Paris Megacity over its main supplying areas.
439
Category
Central Paris Basin
Great West South America
Great East and
similar* Total Surface, ha Cropland Grassland 109 206 - 384 098 116 778 271 940 - 652 620 840 686 1 417 863 957 464 N fertilizers, ktN/y Cropland
Grassland 16 0.1 17 3.8 16 - 36 25 85 29 Feed import, ktN/y Livestock - 36 - 4.2 40 NH3 emission, ktN/y Livestock - 14 - 24 38
N surplus, ktN/y Cropland Grassland 4.7 0.5 26 2.8 18 - 26 30 74 33 P fertilizers, ktP/y Cropland
Grassland 1.5 0.5 1.9 0.1 7.8 - 3.7 2.9 11 3.5 Soil P accumulation
(or depletion), ktP/y
Cropland Grassland -1.2 - 5.1 0.1 0.7 - 1.7 1.9 6.3 2 Feed import, ktP/y Livestock - 5.6 - 1.4 7.0 Feed additives, ktP/y Livestock - 5.7 - 7.1 12.8 P erosion, ktP/y Cropland
Grassland 0.5 - 1.1 0.03 No value 1.4 0.2 3.0 0.23
440
16/34
*All French mixed crop and livestock farming regions contributing more than 1% of the animal food supply of Paris Megacity.
441
442
To summarize, Figure 5 shows the main flows of N and P resources mobilized and/or lost to the environment
443
attributable to the animal and vegetal food supply of Paris Megacity.
444
Figure 5.
445
446
3.2 Food waste flows in Paris Megacity
447
3.2.1. Waste generation in the food transformation industry
448
Wastes are generated along the entire supply chain from agriculture production to the final urban consumer. The
449
largest proportion of these wastes concerns the meat slaughtering and cutting stage.
450
The transformation of living animals into edible products generates a huge amount of waste evaluated at 1.1 kgN
451
per kgN in edible form for N and 8.2 kgP per kgP for P. The very high level of waste generated in terms of P is
452
related to the high P content of bones. This represents a per capita production of slaughtering and cutting wastes
453
for Paris Megacity of 3.9 kgN/cap/y and 0.8 kgP/cap/y, respectively.
454
455
3.2.2. Food waste at the retail and consumer level
456
The data on food commodity availability (INSEE), expressed in kgN/cap/y, have been stable since 1990 after an
457
overall increase of the values since the 1950s, especially for animal products. Compared to these, the food
458
ingestion data collected by AFSSA (2009) show a per capita consumption approximately 35% lower when
459
expressed in N or P. This difference can be attributed to waste production between the retail and the final
460
ingestion stage. Evaluation of these losses per food commodity group (Table 3) shows figures varying from 19%
461
for cereals to 50% for fruits and vegetables (in terms of N content). Overall, this leads to a per capita domestic
462
waste generation of 2.4 kgN/cap/y and 0.24 kgP/cap/y (excluding bones).
463
464
465
466
467
468
469
470
471
Table 3. N and P composition of food supply per capita (INSEE, 2001) and actual consumption (AFSSA, 2009).
472
17/34
Supply kgN/cap/y (% of total supply) Consumption kgN/cap/y (% of total consumption) Losses kgN/cap/y (% of total losses) Supply kgP/cap/y (% of total supply) Consumption kgP/cap/y (% of total consumption) Losses kgP/cap/y (% of total losses) Seafood 0.7 0.3 0.4 0.05 0.02 0.03Dairy and eggs 1.7 1.0 0.7 0.21 0.13 0.08
Meat 2.8 2.1 0.7 0.18 0.14 0.04
Fruits & vegetables 0.7 0.4 0.3 0.11 0.05 0.06
Cereals 1.3 1.1 0.2 0.11 0.09 0.02
Total animal 5.3 (72) 3.5 (71) 1.8 (75) 0.45 (67) 0.29 (67) 0.16 (67) Total vegetal 2.0 (28) 1.4 (29) 0.6 (25) 0.22 (33) 0.14 (33) 0.08 (33)
Total 7.3 4.9 2.4 0.67 0.43 0.24
473
3.2.3 Food waste management
474
The N and P food waste flows in Paris Megacity are illustrated in Figure 6a and b. Apart from bone collection and
475
other recovery of animal waste, the main form of reuse is represented as on-site food waste disposal by
476
households. According to ADEME (2008), this on-site disposal mainly takes the form of animal feeding (pets and
477
wild animals). Since excretions of urban animals are seldom recovered, animal feeding ultimately adds to the
478
environmental losses of N and P in the city. Composting food waste is a minor form of on-site reuse. It is of
479
course more common in the parts with the lowest population density. Only about 100 collective composters were
480
counted in the Paris city center in 2012 (www.paris.fr, compost section). We can therefore assume that less than
481
1% of household food waste is composted in Paris Megacity’s densest areas. However, when food waste is
482
composted, it is used for garden food production in two cases out of three, which therefore contributes to effective
483
N and P recycling. Food production inside Paris Megacity is nevertheless considered negligible.
484
In the end, more than 80% of food waste is collected by municipalities together with other residual waste.
485
Whereas green waste from the garden is often collected separately, only one waste treatment plant, located in
486
Saint-Ouen-l’Aumône, receives source separated food waste and composts it in Paris Megacity (ORDIF, 2014).
487
Three other waste treatment plants in Paris Megacity carry out mechanical-biological sorting of residual waste for
488
composting or methanization. However, they receive less than 1% of the total Paris Megacity food waste
489
production.
490
In Figure 6a and b, economic activities represent all places where food waste is handled out of the households:
491
markets, supermarkets, restaurants, canteens, bakeries, etc. (except for activities leading to bone collection as
492
specified in section 2.3.2). The Rungis International Market, reportedly the largest market of agricultural products
493
in the world, performs food waste composting or methanization, but this accounts for less than 1% of Paris
494
Megacity food waste production. Except for collection of bones within butchers, other economic activities mostly
495
rely on mixed residual waste collection for food waste disposal.
496
Finally, incineration is the prevailing destination of Paris Megacity food waste. It entails negligible releases of
497
reactive N and P in the environment, but it does not achieve any form of N & P reuse. N content in food waste
498
18/34
turns back into the atmosphere as N2. P stays in the bottom ash and is stabilized in clinker. Clinker is mostly used499
as construction material, which does not allow specific P reuse.
500
501
Figure 6.
502
503
3.3 Wastewater flows in Paris Megacity
504
Compiled results of N & P flows related to human metabolism and wastewater management are presented in
505
Figure 7a, b. Apart from P stocking in bones, N & P ingestion overwhelmingly ends up in wastewater and 98% of
506
it is collected by sewer networks. The impact of commuting people is very small: the balance is in favor of people
507
coming daily to Paris Megacity to work, with more than one-third coming from outside the Ile-de-France region,
508
but most of their N & P excretion takes place at home and their final contribution to N & P flows in Paris Megacity
509
is around 1%. The largest impact comes from the inhabitants of Paris Megacity leaving the city for holidays, which
510
on average accounts for 26 days per person per year, i.e., 7% of Paris Megacity inhabitants are absent on a
511
yearly basis. Tourists coming to Paris Megacity do not offset these departures and increase the population of
512
Paris Megacity by only 4%. In the end, the population census in Paris Megacity is evaluated at 10.6 million
513
inhabitants, but only 9.8 million inhabitants over 3 years old actually excrete N & P on this territory as an annual
514
average.
515
Direct dry weather discharges from the sewer network to rivers that are identified in the sanitation master plan of
516
the SIAAP area are very low and account for only 25,000 population equivalents. Most losses occur during rain
517
events from combined sewer overflows and are estimated to around 3% of total inputs.
518
The proportion of P collected in the sewers that is not related to excretion or food waste is much higher than for N,
519
mainly because of the use of P in detergents. It accounts for 30% of the total collected phosphorus in 2013, i.e.,
520
0.17 kgP/cap/y. In the last 10 years, this figure has been steadily decreasing by about 0.03 gP/cap/y due to bans
521
of P in detergents. It is expected to continue decreasing with a new limitation on P in dishwashers that will come
522
into effect in 2017 by application of EU regulation No. 259/2012 of the European Parliament and of the Council of
523
14 March 2012. Total P discharge in the rivers represents 18% of total P entering the networks, but only half of
524
the sludge is directly spread on agricultural land or composted. The other half is incinerated in various facilities
525
and P is not recovered from incineration ashes.
526
N is mostly emitted from wastewater treatment plants in the form of gas, predominantly N2, but also in small
527
proportions in the form of N2O. Kampschreur et al. (2009) reported a considerable range of uncertainty regarding
528
N2O emissions in wastewater treatment plants, varying from 0.05% to 25% of N-load. Recent measurements at
529
Achères wastewater treatment plant lead to a 2% ratio. N recycling to agriculture is negligible. Total N discharge
530
in the river from the area’s wastewater treatment plants respects the UWWT Directive regulatory threshold of
531
30%, but the effective global rate of N river discharge from the wastewater system is about 38%. For a megacity
532
19/34
like Paris, this means that the metabolic N of about 4 million people is discharged daily into the Seine River in a533
reactive form (mostly NO3-).
534
535
Figure 7.
536
537
3.4 Overview of the nitrogen and phosphorus imprint of human metabolism in Paris Megacity
538
The results on the biogeochemical imprint of human metabolism in Paris Megacity from all three subsystems of
539
agro-food production, waste management and wastewater management are compiled and summarized in Figure
540
8a and b. The imprint for other agricultural regions than the four supply areas studied was deduced by
541
extrapolation, considering the same characteristics for these regions as for their corresponding studied
542
counterpart. N and P loads to the wastewater management that are not directly related to food and excretion were
543
also removed and subsequent flows proportionally recalculated. They allow a general vision of this imprint that
544
contributes to characterizing a socioecological regime (Fischer-Kowalski and Haberl, 2007) as discussed in
545
section 4.2.546
547
Figure 8.548
549
20/34
4. Discussion
550
4.1 Quality of results and uncertainties
551
The majority of the flow accounts are based on local data, mostly provided by French administration surveys and
552
inventories. This method presents the advantage and the originality of providing an accurate overview of the
553
biogeochemical imprint of human metabolism in Paris Megacity rather than a theoretical estimation of its imprint
554
based on literature data. This advantage is counterbalanced by two main drawbacks: (i) the high dependence on
555
the reliability of the locally available data and (ii) the low availability of results expressed in N and P content in
556
local data.
557
558
The uncertainties concerning the GRAFS flows are extensively discussed in Le Noë et al., 2017. In the present
559
study, the P imprint of Paris Megacity has been calculated on the basis of the N imprint by using of N/P ratios. It
560
leads to a slightly unbalanced P budget showing a 21% to 38% gap between inputs and outputs on figure 5 and
561
figure 8.
562
Regarding our N & P flow calculations in the waste management subsystems, their reliability is difficult to
563
establish. Most data on food waste are given in kilograms of food waste, but our approach is based on N and P to
564
trace the actual nutrients contained in food necessary for human metabolism. Figures in kilograms of food waste
565
are difficult to interpret given the variability of the moisture in food waste (some of the collected studies take
566
liquids into accounts and others exclude them). Moreover, it is difficult to accurately analyze the composition of a
567
trash bin and its specific content in food waste (ADEME et al., 2010; Syctom data). All types of waste are usually
568
mixed in residual waste bins and it is difficult to sort them again. However, Syctom data enable the calculation of
569
N and P content of a sample of collected waste bins and we found values of 1.9 kgN/cap/y and 0.35 kgP/cap/y. If
570
we consider that most N and P comes from food waste, these values tend to show a correct estimation for N and
571
P collected in waste bins. Data on P could not be cross-checked with local analysis of bottom ash since this
572
element is not measured on Syctom ash. Calculated values of N and P losses between the slaughter/cutting and
573
packaging steps are taken into account in the GRAFS representation, but the fate of these flows remains
574
uncertain. Yet a complete analysis of P recovery and recycling from waste is provided by Senthilkumar et al.
575
(2014). This study was conducted at the national scale, so it is difficult to convert it to local food waste
576
management considerations.
577
Application of the literature values on P content in bottom ash in France (Aouad et al., 2006) gives a total
578
production of 0.24 kgP/cap/y for Paris Megacity, as compared to 0.31 kgP/cap/y in our calculations. N can
579
unfortunately not be measured after combustion since it eventually goes back to the atmosphere as N2.
580
581
21/34
N and P excretion values based on AFSSA (2009) ingestion data are compatible with literature values on the582
excretions of Westerners (Larsen et al., 2013, chap. 17) with a 4% difference on N values but a higher 25%
583
difference on P values.
584
Finally, data on wastewater seem to be the most reliable since N and P are actually measured by wastewater
585
operators as monitoring variables. Uncertainties on the values of losses in the sewer network are the most difficult
586
to estimate. Dry and wet weather losses are given by the sanitation master plan of the SIAAP area, but it is by
587
nature very difficult to estimate the losses that are not known by the wastewater authorities. In particular, two
588
sources of losses have not been taken into account in these calculations: ground infiltration of N and P from
589
leaking sewers and discharges by the smallest sewers. However, the good correlation between N and P
590
originating from human excretion and N and P arriving at the wastewater treatment plant tends to confirm that
591
estimated losses by the sewer network of Paris Megacity are acceptable.
592
Interannual variability of quantities of N per capita received by the SIAAP in recent years is quite low (±5%) and
593
2013 is in the middle of this variability range. The decrease of P values is known to stem from the limitation of P
594
use in detergent and confirms the validity of the measured values.
595
As a whole, the data used in this study come from a variety of sources with some more reliable than others and,
596
according to Courtonne et al. (2015), can be classified as such: water quality measurements > official statistics
597
available for the long term (e.g., agricultural data) > N and P content coefficient > recent declaration-based
598
statistics (e.g., biowastes).
599
600
4.2 The main characteristics of the water-agro-food socioecological regime of Paris Megacity
601
4.2.1 A minimized local imprint on Paris Megacity area
602
The local imprint calculated through the discharge of N and P on Paris Megacity area is minimized by intensive
603
treatment units. P in incinerated food waste ash is stabilized in construction materials and food waste N mainly
604
goes back to the atmosphere as harmless N2. Less than 20% of the P excreted by human metabolism ends up in
605
the Seine, which is compatible with international regulations applied to the Seine. Given the population of Paris
606
Megacity, it still represents an imprint in absolute figures of 1.3 106 kgP losses per year. N releases from the
607
wastewater system account for 38% of human excreted N. Although its main form is nitrate, which does not
608
contribute to major local disruptions in the Seine inside Paris Megacity, N released as ammonium and nitrites are
609
still at high levels compared to the expected level for good ecological potential (Romero et al. 2016), as required
610
by the WFD.
611
The wastewater authorities of Paris Megacity are currently undertaking or scheduling complementary intensive
612
pollution mitigation works. The Seine in the Paris city center only has a monthly minimum flow with a 5-year return
613
period of 94 m3/s (DRIEE-IF, 2014), which leaves only 830 L/cap/day of dilution capacity. The WFD threshold of
614
0.5 mgNH4+/L in the Seine River thus requires at least 98% efficiency in reduced N removal. Despite reaching the