HAL Id: hal-00973057
https://hal-sciencespo.archives-ouvertes.fr/hal-00973057
Preprint submitted on 3 Apr 2014
HAL is a multi-disciplinary open access archive for the deposit and dissemination of sci-entific research documents, whether they are pub-lished or not. The documents may come from teaching and research institutions in France or abroad, or from public or private research centers.
L’archive ouverte pluridisciplinaire HAL, est destinée au dépôt et à la diffusion de documents scientifiques de niveau recherche, publiés ou non, émanant des établissements d’enseignement et de recherche français ou étrangers, des laboratoires publics ou privés.
Productivity and Market Selection of French
Manufacturing Firms in the Nineties
Flora Bellone, Patrick Musso, Lionel Nesta, Michel Quéré
To cite this version:
Flora Bellone, Patrick Musso, Lionel Nesta, Michel Quéré. Productivity and Market Selection of French Manufacturing Firms in the Nineties. 2006. �hal-00973057�
Productivity and Market Selection of French
Manufacturing Firms in the Nineties
N° 2006-04
Février 2006
Flora Bellone Patrick Musso Lionel Nesta Michel QuéréProductivity and Market Selection of French
Manufacturing Firms in the Nineties*
N° 2006-04 Février 2006 Flora Bellone+*♣ Patrick Musso*♣ Lionel Nesta♣* Michel Quéré*♣ *
CNRS-GREDEG, 250 rue Albert Einstein, Valbonne – Sophia Antipolis, 06560 France.
+
University of Nice-Sophia-Antipolis, Avenue Doyen Trotabas, 06050 NICE Cedex 1
♣ OFCE-DRIC, 250 rue Albert Einstein, Valbonne – Sophia Antipolis, 06560 France
Abstract: This paper analyses post-entry and pre-exit performance of French firms using a dataset covering 14 manufacturing industries over the period 1990-2002. The main focus is on market selection mechanisms looking at total factor productivity levels of entrants and exitors relative to incumbent firms. Entrants are found to outperform incumbents, while exitors are less efficient than their surviving counterparts. We nonetheless found key distinguishable features of exit patterns between young and mature firms. Young exiting firms do not display productivity disadvantage relative to incumbent firms. By contrast, mature exiting firms display large and persistent productivity disadvantage relative to their surviving counterparts (shadow of death effect). The determinants of exit differ for entrants and incumbents. Productive inefficiency is a key determinant of the exit of mature firms but not entrants.
JEL Codes: D24, L11, L60.
1. Introduction
In market-based economies, firms are continuously subject to market selection forces. At all time, firms must make sure to be profitable enough in order to remain on the market. The determinants of the relative abilities of firms to survive on competitive markets are diverse and complex. In this paper we focus on productive efficiency criteria and investigate if productivity differences between firms are a key determinant of their relative ability to survive. The link between productive firm heterogeneity and industrial dynamics (entry, exit and reallocation of market shares) have successfully been integrated into the standard general equilibrium framework (Jovanovic, 1982) which, in turn, helps to discuss the relationship between industry characteristics, technology, and firm’s productivity distribution (Ericsson et Pakes, 1990, Hopenayn, 1992). These models are now confronting empirical data due to the increasing availability of Longitudinal Micro-datasets (LMDs) in a large variety of countries (see Bartelsman and Doms 2000 and Tybout 2001 for recent surveys).
Our paper adds to this literature using a dataset for French Manufacturing firms over the period 1990-2002. We compute measures of Total Factor Productivity (TFP) for all French firms above 20 employees operating in manufacturing industries. We follow the productive performance of entering, continuing, and exiting firms over time in order to address the issue of the efficiency of market selection mechanisms. On main issue is to investigate to which extent efficiency criteria play a similar selection role at different stage of a firm life. Behind this hypothesis, lies the idea that several competitive games co-exist within a same courtyard. More specifically, the competition that prevails between incumbents and entrants may not involve the same selection mechanisms than the competition that prevails among incumbent themselves.
The paper is organized as follows. Section 2 presents the literature background. Section 3 discusses issues involved in building our longitudinal data set. In Section 4, we focus on young firms and describe the relationship between productivity firm heterogeneity and post-entry performances. In Section 5, we do a similar exercise on mature firms in describing the relationship between productivity firm heterogeneity and pre-exit performances. In Section 6, duration models are further developed to investigate how the determinants of the hazard of exit vary at different stages of the life of a firm. Section 7 concludes.
2. Literature background
Recently, comprehensive and large plant- and firm-level datasets have been made available in a large variety of countries to address the issue of the contribution of plant and firm turnover to the productivity growth of manufacturing industries. A non-exhaustive list of contributions includes Baily et al. (1993), Haltiwanger (1997), Foster et al. (2001) for the United States, Griliches and Regev (1995) for Israel, Liu and Tybout (1996) and Eslava et al. (2003) for Chile and Colombia, Hahn (2000) and Awe, Chen and Roberts (2001) for South Korea and Taiwan, and Nishimura, Nakajima and Kiyota (2005) for Japan. Furthermore, Scarpetta et al. (2002) and Bartelsman et al. (2003) provide comparisons of the contribution of turnover to productivity growth within 10 countries including France1. From this literature, new stylized facts on entry and exit patterns and related implications for the analysis of industrial dynamics have emerged.
Basically, it has been shown that exiting firms were usually concentrated in the lowest part of the productivity distribution, suggesting that markets were contributing to aggregate productivity in rightly selecting against inefficient firms. Evidence of this natural selection
mechanism (NSM)2 has been found in a large variety of countries. More surprisingly , such
evidence has even been found in the case of developing countries, even though sources of markets distortion can be thought of as particularly prevalent in those countries (see Tybout (2000) for a survey of empirical evidence on the developing World).
Nonetheless, market selection processes may work more or less efficiently across countries, industries and over time depending on a potentially large variety of factors. For instance, Scarpetta et al. (2002) argue that, on average, firms tend to exit with better relative productivity levels in downturn times and in mature and/or restructuring industries. Nishimura, Nakajima and Kiyota (2005) advocate that natural market selection mechanisms no longer work in severe recessions as indicated by the fact that, over the last decade in the recessive Japanese economy, mature unproductive Japanese firms staid in the market while younger efficient ones exited. Awe, Chung and Roberts (2002) compare data for Taiwan and South Korea from 1983 to 1993, a period of rapid economic expansion for both those economies. They conclude that institutions in Taiwan have, nonetheless, been more effective in supporting the market selection process against unproductive firms. Consequently, plant and
1
Others countries are the United States, Germany, Italy, United Kingdom, Canada, Denmark, Finland, Netherlands and Portugal. 90
2
firm turnover have much more contributed to the productivity growth of the Taiwanese manufacturing industries compared to the Korean ones.
Our paper pursues this line of empirical research by reporting new evidence on France. It proposes to relate firm productivity (TFP) and entry and exit patterns in French manufacturing industries over the 1990-2002 period. In order to organise this empirical investigation, we rely on some empirical implications derived from the recent literature on stochastic dynamic industry equilibria with heterogeneous firms.
The starting point of this literature is the seminal paper by Jovanovic (1982). In this model of “passive learning” (see also Hopenhayn, 1992), firms are endowed at birth with a time invariant profitability parameter, which determines the distribution of its future profit stream. A central feature of the model is that a new firm does not know what its relative efficiency is (its cost function), but rather discovers it through the process of Bayesian learning from its actual post-entry profit realizations. By continually updating such learning, the firm decides to expand, contract, or exit. In this model, learning is said to be passive because information is obtained as a costless by-product of operating and also because learning does not affect the actual productivity of the firm. It simply “reveals” the pre-determined and time-invariant relative efficiency of the firm.
By contrast, in “active learning” models such as Ericson and Pakes (1995) (see also Olley and Pakes, 1996; and Pakes and Ericson, 1998), it is assumed that the firm knows the current value of the parameter that determines the distribution of its profits, but that this value changes over time in response to the stochastic outcomes of the firm own investments, and those of other actors in the same oligopoly market. The firm grows if successful, shrinks or exits if unsuccessful. In this model, learning is said to be active not only because it requires specific efforts but also because it allows the firm to improve its relative performance.
While these two basic models are rich in their implications for firm level dynamics from the aggregate point of view, they are very complex dynamical systems. The main purpose of Hopenhayn (1992) is to provide a simpler framework by assuming that the perfectly competitive industry is in a stationary equilibrium. The model of industry dynamics become then more tractable and some interesting analysis of comparative static can be performed. Its main prediction is that firm turnover is negatively related to entry costs and, in turn, that low firm turnover is correlated with large productivity gaps between exiting and surviving firms. However, due to the absence of price competition effects, market size has no effect on entry and exit rates. An extension of the model to an imperfectly competitive market with monopolistic competition is considered in Asplund and Nocke (2003). The model generates
implications of sunk costs and market size on firm exit and the size distribution of surviving firms.
These new theoretical models have started to be confronted to empirical tests in the middle on the nineties (i.e. quite contemporaneously with the literature on the micro-foundations of aggregate productivity growth surveyed above). In particular, Pakes and Ericson (1998) study the empirical implications of the passive and active learning models in great depth and proposed quite general nonparametric tests of alternative models of firm dynamics3; their empirical study (on a eight-year panel of Wisconsin firms) suggests that the passive learning model fits the retailing sector well, while manufacturing shows patterns that support the existence of active learning. Abbring and Campbell (2004) propose alternative tests after accounting for heterogeneity across firms’ pre-entry scale decisions and transitory shocks observed only by entrepreneurs, but they do not find any evidence of entrepreneurial learning for Texan bars.
Other papers propose more general comparative analyses encompassing several manufacturing industries. The Baldwin and Rafiquzzaman (1995) paper uses Canadian plant level data over the 1970-89 period to investigate to which extent the improvements in the performance of any entry cohort are the result of a pure selection process that culls out the (pre-determined) most inefficient entrants or of an evolutionary learning process that allows survivors to improve their productivity performance relative to incumbent firms. Their main conclusion is that both pure selection and evolutionary learning affect post-entry performance, but selection per se is a more important contributor to the overall growth of a cohort.
Using Spanish firm-level data, Farinas and Ruano (2005) test the implications of the Hopenayn (1992) model. They find that the productivity distribution of continuing firms stochastically dominates the distributions of entering and exiting firms. Moreover, the group of failing members of any entry cohort has lower productivity than the group of surviving members of the same entry cohort. Finally, they find that the post-entry productivity level of entering firms grows more rapidly than the productivity of incumbent firms, although this pattern is not always highly significant. This pattern is not solely consistent with a pure selection process as the one at work in the Hopenayn (1992) model but may also result from learning effects playing a role through investment, exploitation of scale economies, etc.
Bhattacharjee (2005) proposes an hazard regression model for firm exit, with a modification to accommodate age-varying covariate effects, which allows to confront
3
Actually they built their tests in using the fact that the passive learning model differs from from the active learning model in that the stochastic process generating the size of a firm is non-ergodic.
different theoretical models in a unified framework. More specifically, the proposed hazard regression models can accommodate negative effects of initial size that increase to zero with age (active learning model), negative initial size effects that may increase with age, but stay permanently negative (passive learning model), conditional and unconditional hazard rates that decrease with age at higher ages, and adverse effects of macroeconomic shocks that decrease with age of the firm. Using UK firm data, they conclude that their dataset is mostly consistent with the active learning model as the effect of initial size is significantly negative for a young firm and falls to zero with age.
We propose to investigate these issues further from a French case study by emphasising both common and divergent predictions which emerge from the passive and the active learning models about post-entry and pre-exit dynamics. Our methodology to compute productivity indexes is close to the one used in the Farinas and Ruano (2005) paper. Our focus is more in line with the Baldwin and Rafiquzzaman (1995) paper as we shed some lights on the relative importance of pure selection and active learning in shaping post-entry patterns. We add however to this paper in extending the analysis to the pre-exit patterns of mature firms and in emphasising the role of imperfect competition in shaping both post-entry and pre-exit selection processes. Finally, our paper is also close to Bhattacharjee (2005) in that we develop duration models and investigate how selection processes impact firms at different stages of their life. We however use explicit measures of firm relative productivity (and not size as a proxy of efficiency) to discuss the differences in the relative efficiency of firms. Finally, in putting the focus on the distinction between young and mature firms we also come close to the literature that emphasised the distinction between small and large firms (Audrescht, 2005)4.
3. A comprehensive dataset on French manufacturing firms
3.1. Data sources
The firm data set used in this paper is collected by the French Ministry of Industry (SESSI).
The French Census of Manufacturing (called EAE5) is a unique census collecting information
about inputs and outputs of all individual firms of more than 20 employees. This census allows us to trace quite extensively the performance of firms over time. Compared to the existing literature, an interesting feature is that data are directly collected at the firm level, not
4
Farinas and Ruano (2005) also distinguish between large firm and small firms but their underlying theoretical model (the Hopenayn (1992) one) rules out any independent impact of the size of the firms on their relative performances.
5
at the plant level. This means that we are dealing with firm (not plant) turnover. This has the advantage of avoiding potential spurious effects when assessing the specific role of market selection for productivity growth. Indeed, a plant closure is never the direct consequence of a market selection process. It is the direct consequence of a firm decision. It is likely that a firm decides to close a plant because the latter is not productive enough. This selection process is not however a pure market selection process. It is internally organized by the firm and then depends both on the ability of the firm to restructure and on the capacity of the market to constrain firms to get rid of unproductive units. In order to assess properly the contribution of market selection (not the ones of firms' internal capabilities) in promoting productivity growth, it is therefore better to consider firm turnover and not plant turnover.
Additional industry-level data, mainly used in productivity computations, come from the INSEE database (French System of National Accounts). These data are presented in detail in the Annex of this paper.
3.2. Entry and exit patterns
We rely on the following standard definition for entrants, continuing and exiting firms: an entrant is a firm existing in the reference year t but not in t-1; An exiting firm is a firm existing in the reference year t but not in t + 1; A continuing firm is a firm existing in the reference year t and t + 1 and t - 16. Applied to our dataset, these definitions induce a few re-entry phenomena, essentially due to the +20 employees threshold effect7. This effect induces an overestimation of firm turnover rates. However, as only the smallest firms in the sample are concerned, it may not bias so much the inputs or output-weighted entry and exit rates.
According to these definitions, the dataset exhibits average firm entry and exit rates of
about 9 and 10 %, respectively. The firm turnover rate8 averages then 18 % per year with a
slightly decreasing trend over the period of investigation (see Table 1 & Table 2). These numbers are slightly lower than the ones reported for France by Bartelsman, Scarpetta and Schivardi (2003). Their firm turnover rate for manufacturing is around 24% by year in the period 1989-1994 which ranks France as a relatively high turnover country in comparison with other OECD countries.
6
In accordance to the OCDE definition (See Bartelsman Scarpetta and Schivardi (2003)), firms existing only one year are considered as “one year firms” and are neither counted as entrants or as exiters.
7
For instance, a firm decreases its number of workers and goes out of the range of the French census but still exists in the market.
8
Table 1. Entry and exit by year
Year Entrant Continuing Exiting Turnover rate 1990 1 887 19 351 1 738 18.7 1991 2 130 19 181 2 057 21.8 1992 1 683 18 896 2 415 21.7 1993 1 157 18 295 2 284 18.8 1994 1 961 17 785 1 667 20.4 1995 1 511 17 816 1 930 19.3 1996 1 644 17 679 1 648 18.6 1997 1 626 17 828 1 495 17.5 1998 1 374 18 007 1 447 15.7 1999 1 304 17 911 1 470 15.5 2000 1 345 17 758 1 457 15.8 2001 1 464 17 617 1 486 16.7
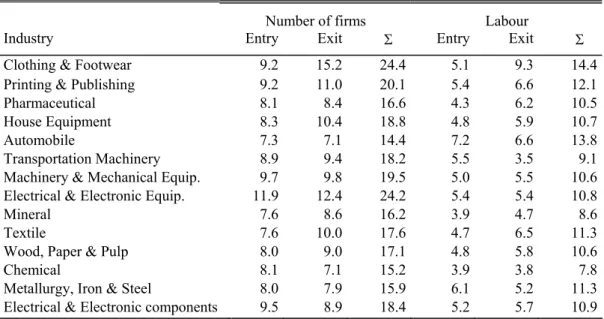
Another feature of our dataset, quite in line with the existing literature, is that industries significantly differ according to their turnover rates. Table 2 shows the average of annual turnover rates for each of our 14 two-digit level industries. There is quite a large variability in these numbers across industries with higher firm turnovers occurring in clothing & footwear, printing & publishing, and the electrical & electronic equipment and smaller ones in the automobile, chemical industries, mineral industries, and metallurgy.
Table 2. Turnover rate by industry
Number of firms Labour
Industry Entry Exit Σ Entry Exit Σ Clothing & Footwear 9.2 15.2 24.4 5.1 9.3 14.4 Printing & Publishing 9.2 11.0 20.1 5.4 6.6 12.1
Pharmaceutical 8.1 8.4 16.6 4.3 6.2 10.5
House Equipment 8.3 10.4 18.8 4.8 5.9 10.7
Automobile 7.3 7.1 14.4 7.2 6.6 13.8
Transportation Machinery 8.9 9.4 18.2 5.5 3.5 9.1 Machinery & Mechanical Equip. 9.7 9.8 19.5 5.0 5.5 10.6 Electrical & Electronic Equip. 11.9 12.4 24.2 5.4 5.4 10.8
Mineral 7.6 8.6 16.2 3.9 4.7 8.6
Textile 7.6 10.0 17.6 4.7 6.5 11.3
Wood, Paper & Pulp 8.0 9.0 17.1 4.8 5.8 10.6
Chemical 8.1 7.1 15.2 3.9 3.8 7.8
Metallurgy, Iron & Steel 8.0 7.9 15.9 6.1 5.2 11.3 Electrical & Electronic components 9.5 8.9 18.4 5.2 5.7 10.9
3.3. Productivity measurement
Following Caves, Christensen and Diewert (1982) and Good, Nadiri and Sickles (1997), the total factor productivity index for firm i at time t is measured in the following way:
(
)
t it it t 1 2 N nit nt nit nt n 1 t N n n 1 n n 1 2 n 1 ln TFP ln Y ln Y ln Y ln Y 1 (S S ) (ln X ln X ) 2 1 (S S ) (ln X ln X ) 2 τ τ− τ= = τ τ− τ τ− τ= = = − + − − + − − + −∑
∑
∑∑
where denotes the real gross output produced by the firm i at time t using the set of inputs (labour, capital and materials). S is the cost share of input X in the total cost. The symbols with upper bar are corresponding measures for the reference point (the hypothetical firm). They are computed as the arithmetic means of the corresponding firm level variables over all firms in year t. Subscripts τ and n are indices for time and inputs, respectively. This methodology is particularly well suited for comparisons within firm-level panel data sets as it guarantees the transitivity of any comparison between two firm-year observations by expressing each firm's input and output as deviations from a single reference point for each year.
it
Y
nit
X nit nit
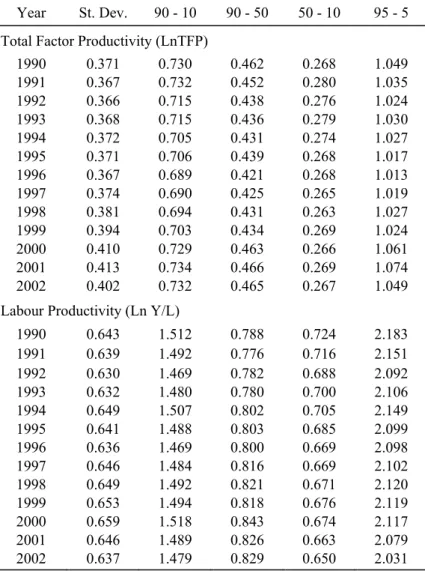
The first characteristic our dataset shares with the firm-level productivity literature is the degree of heterogeneity among firm’s productivity levels. Table 3 presents several measures of this heterogeneity. The first column reports, for each year, the standard deviation of productivity levels computed on the whole database. The second column shows the difference of the log of productivity for the firm at the 90th percentile and the log of productivity for the firm at the 10th percentile (the 90-10 differential). These numbers suggest a large variation in productivity. The spread in productivity between the firm at the top decile and the one at the first decile is about 70 % for the TFP and around 150 % for labour productivity. The 90-50, 50-10 and 95-5 differentials are shown in the next columns. Note that all of these productivity spreads are fairly stable over time, suggesting a persistent heterogeneity in firm productivity levels.
Table 3. Variability in Productivity
Year St. Dev. 90 - 10 90 - 50 50 - 10 95 - 5 Total Factor Productivity (LnTFP)
1990 0.371 0.730 0.462 0.268 1.049 1991 0.367 0.732 0.452 0.280 1.035 1992 0.366 0.715 0.438 0.276 1.024 1993 0.368 0.715 0.436 0.279 1.030 1994 0.372 0.705 0.431 0.274 1.027 1995 0.371 0.706 0.439 0.268 1.017 1996 0.367 0.689 0.421 0.268 1.013 1997 0.374 0.690 0.425 0.265 1.019 1998 0.381 0.694 0.431 0.263 1.027 1999 0.394 0.703 0.434 0.269 1.024 2000 0.410 0.729 0.463 0.266 1.061 2001 0.413 0.734 0.466 0.269 1.074 2002 0.402 0.732 0.465 0.267 1.049 Labour Productivity (Ln Y/L)
1990 0.643 1.512 0.788 0.724 2.183 1991 0.639 1.492 0.776 0.716 2.151 1992 0.630 1.469 0.782 0.688 2.092 1993 0.632 1.480 0.780 0.700 2.106 1994 0.649 1.507 0.802 0.705 2.149 1995 0.641 1.488 0.803 0.685 2.099 1996 0.636 1.469 0.800 0.669 2.098 1997 0.646 1.484 0.816 0.669 2.102 1998 0.649 1.492 0.821 0.671 2.120 1999 0.653 1.494 0.818 0.676 2.119 2000 0.659 1.518 0.843 0.674 2.117 2001 0.646 1.489 0.826 0.663 2.079 2002 0.637 1.479 0.829 0.650 2.031 Note: Standard deviation and percentile differences for LnTFP and LnY/L.
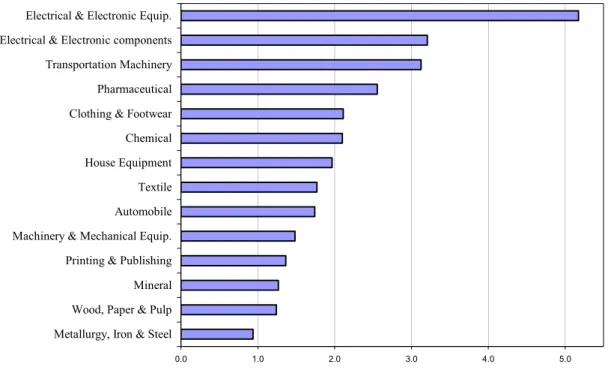
For some part, this heterogeneity reflects the contrasting performance of French manufacturing industries during the 1990-2002 period. Figure 1 below portrays the average annual growth rates of the TFP for each of our 14 industries. These productivity indexes are computed by aggregating individual TFP indexes as follows:
I,t i,t i,t
i
ln TFP = θ
∑
ln TFPwhere is the share of the ith firm in the overall gross output of the 2-digit level industry to which it belongs and lnTFPi,t is the productivity index for firm i.
i,t
Figure 1. Industry TFP growth (average annual growth rates)
0.0 1.0 2.0 3.0 4.0 5.0
Metallurgy, Iron & Steel Wood, Paper & Pulp Mineral Printing & Publishing Machinery & Mechanical Equip. Automobile Textile House Equipment Chemical Clothing & Footwear Pharmaceutical Transportation Machinery Electrical & Electronic components Electrical & Electronic Equip.
Clearly, inter-industries differences contribute to the heterogeneity in firm’s productivity distribution. However, they explain only a small part of it. After controlling for the industry, firm heterogeneity remains high. This suggests that some firms are intrinsically more productive than others and it is worthwhile to investigate further how those differences in firms’ productivity relate to entry and exit patterns both at the aggregate (whole manufacturing) and at the industry level.
4. Post-entry performance
Using the previously emphasised distinction between passive and active learning models of industrial dynamics and considering that imperfect competition is likely to prevail on manufacturing goods markets, one can identify at least three different types of learning involved by entry. First, entry can reveal to new firms information about their relative
abilities at birth. If ability at birth is the only source of firm heterogeneity9, post entry selection will induce that only the firms which will reveal themselves to be endowed with high enough efficiency levels will survive. Second, entry can reveal or produce knowledge about how to produce more efficiently. If this type of learning is pre-dominant, surviving
entrants will be the ones which are the most skilled to progress10. These abilities can or
9
This extreme assumption prevails for instance in the Jovanovic 1982 model.
10
This type of learning is the one which is at work in the Ericson and Pakes (1992) model. It is also emphasised in evolutionary models in which new firms are assumed to be less experienced in terms of routines and best practices and have to grasp them after entry.
cannot be related with initial abilities in relative efficiency (i.e. abilities at birth). Third, entry can reveal or produce knowledge about “how to struggle” on imperfect competitive markets. If this type of learning is pre-dominant, technological abilities at birth or abilities to catch-up best practices after entry are not as important as the ability to face reactive strategies
developed by powerful incumbent competitors11. According to this view, surviving entrants
will be the ones which will succeed in overcoming their initial strategic disadvantage relative to incumbents firms.
In this Section, we shed some lights on the relative importance of these three types of learning while describing the post-entry performance of new entrants. We proceed in three main steps. First, we trace in time the average productivity (TFP) of each entry cohorts relative to incumbents firms. Second, we discriminate further between successful and unsuccessful entrants and compare their productivity levels not only among themselves but also between themselves and the incumbent firms. Finally, we examine how these productivity gaps are related to changes in the relative size and profitability for the two types of entrants: successful ones and unsuccessful ones. Catch up
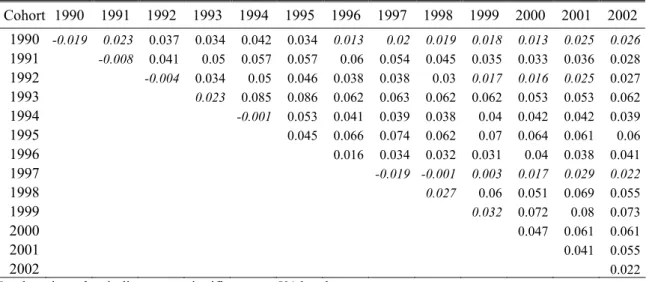
Table 4 summarizes the first step. It traces in time the average productivity of entry cohorts relative to incumbents firms. For instance, the first line reports the average productivity of the 1990 entry cohort in 1990, 1991, 1992, etc., relative to the productivity of incumbent firms in the corresponding year. In this Table, the population of incumbent firms is defined as the population of firm born before 1990 and surviving during all the period of investigation12. A negative number means that new entrants have a productivity disadvantage relative to incumbent firms while a positive number reveals a productivity advantage13.
11
This last type of learning may be especially important if competitive threats from existing firms change along the post-entry period. For instance, it can be the case that incumbents also lack from precise information about the actual threat the new entrants offer to existing firms. Incumbents may then have to wait after entry and the early maturation process to device reactive strategies in order to cope with the new competitive threat due to emerging adolescent entrants.
12
While our investigation focuses on the 1990-2002 period, we can trace back the presence of a firm since 1984.
13
The relative productivity of entrants is computed in two steps. First, the relative TFP index of each new entrant is computed as the difference between individual TFP indexes (measured in log) and the average TFP index of their incumbent counterparts (i.e. incumbent firms which belong to the same 2-digit industry). Second, the relative productivity of the entry cohort is defined as the un-weighted average of the relative individual TFP indexes.
Table 4. TFP level of entrants relative to incumbent firms by entry cohort (log difference) Cohort 1990 1991 1992 1993 1994 1995 1996 1997 1998 1999 2000 2001 2002 1990 -0.019 0.023 0.037 0.034 0.042 0.034 0.013 0.02 0.019 0.018 0.013 0.025 0.026 1991 -0.008 0.041 0.05 0.057 0.057 0.06 0.054 0.045 0.035 0.033 0.036 0.028 1992 -0.004 0.034 0.05 0.046 0.038 0.038 0.03 0.017 0.016 0.025 0.027 1993 0.023 0.085 0.086 0.062 0.063 0.062 0.062 0.053 0.053 0.062 1994 -0.001 0.053 0.041 0.039 0.038 0.04 0.042 0.042 0.039 1995 0.045 0.066 0.074 0.062 0.07 0.064 0.061 0.06 1996 0.016 0.034 0.032 0.031 0.04 0.038 0.041 1997 -0.019 -0.001 0.003 0.017 0.029 0.022 1998 0.027 0.06 0.051 0.069 0.055 1999 0.032 0.072 0.08 0.073 2000 0.047 0.061 0.061 2001 0.041 0.055 2002 0.022
Numbers in italics indicate non-significance at 5% level
The first important result emerging from Table 4 is that new entrants exhibit higher productivity records compared to incumbent firms. This result holds for each entry cohort from 1990 to 2002 and for almost all years of observation except, times to times, the very first year of entry. Moreover, it is noticeable that the few times the difference is negative (for instance the first year of the 1992 1994 and 1997 entry cohorts), the difference is not significant. In contrast, as soon as the difference turns to be at the advantage of entering firms (usually the second year of entry), it is also, almost everywhere, significant at the 0.05 level.
The observation that new entrants outperform incumbent firms contrasts with the earlier paper by Baldwin and Rafiquzzaman (1995) and with the recent one by Farinas and Ruano (2005) despite they use a similar methodology to compute relative productivity indexes. One explanation could be that our dataset is restricted to firms employing at least 20 employees. We then observe young firms rather than “true” new entrants. Nonetheless, our firm survival rates in the first years of existence are quite similar to what is usually found in post-entry analyses. Moreover, our results are consistent with other studies as the earlier one by Griliches and Regev (1995) on Israelian firms, and also the Dysney, Haskel and Heden (2003) study on UK data. This last paper also shows that new entrants outperform continuing firms.
If the French dataset does not support the idea that entering firms suffer from a productivity disadvantage relative to incumbent firms, it is consistent with a vintage hypothesis according to which new firms embody better technology than older ones14.
14
The underlying argument behind the vintage hypothesis is that a best practice frontier, which evolves over time and which is exogenous to the industry, is exclusively available for new firms (Jovanovic and Greenwood, 2001; Dwyer, 1998)
This interpretation is further suggested in Table 4, as the productivity advantage of new firms over incumbents increases with the cohort age. For instance, if one computes the average of the productivity advantage of new firms over five years after birth, it is about 2,9 % for the 5 oldest entry cohorts and about 5,3% for the 5 youngest entry cohorts. Moreover, this advantage is statistically significant from the very birth of entrants in the case of the 3 youngest entry cohorts (2000, 2001, 2002) and not in the case of the older cohorts.
The fact that young firms outperform incumbent firms is puzzling for the theory and especially for the evolutionary learning view of post-entry selection process according to which productivity improvements of entry cohorts are driven by technological or best practice catching-up of entering firms. It is also at odds with the idea that new firms cope with a productivity disadvantage due to scale inefficiencies. The observation that entrants outperform incumbents in terms of productivity is consistent with the idea that incumbents benefit from some advantages over entrants. Indeed, despite this productivity disadvantage, mature firms do not exit the market. This reveals some degree of imperfect competition on French manufacturing good markets.
Table 4 in itself does not allow further discriminating between a natural selection view of post-entry dynamics and a competitive selection view. Indeed, both types of selection process can still underlie the productivity improvements of any entry cohort in Table 1. For instance, the sharp increase in the relative productivity of entrants just after entry could be underlined by an intensive natural selection process against relative inefficient entrants (i.e. entrants whose productivity advantage at birth is not high enough to overcome some given initial disadvantages). Alternatively, differences in relative productivity at birth between entrants may not be as important as their ability to grow enough to cope efficiently with the reactive strategies that incumbent firms may put in motion as soon as they have precise enough information on the productivity advantage of the new entrants.
To further discriminate between both views, Table 5 below distinguishes between successful entrants (firms which survive more than 5 years) and unsuccessful or failing entrants (firms which failed within 5 years after their entry).
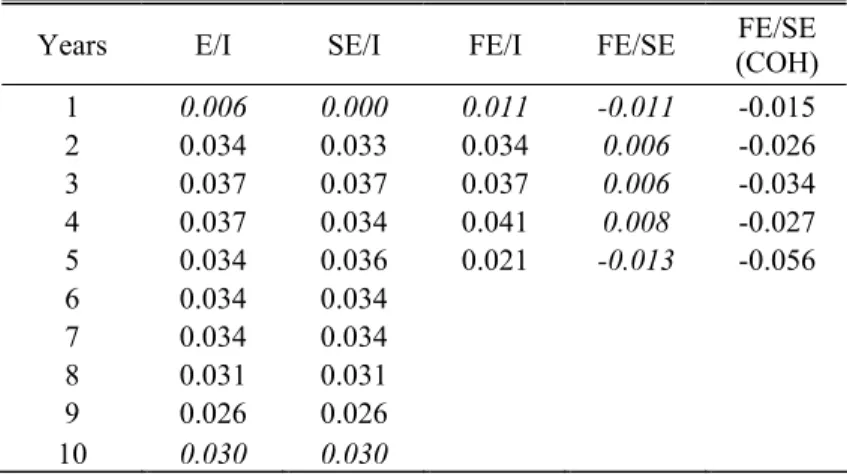
Table 5. Relative TFP by the number of years after entry (log difference)
Years E/I SE/I FE/I FE/SE FE/SE (COH) 1 0.006 0.000 0.011 -0.011 -0.015 2 0.034 0.033 0.034 0.006 -0.026 3 0.037 0.037 0.037 0.006 -0.034 4 0.037 0.034 0.041 0.008 -0.027 5 0.034 0.036 0.021 -0.013 -0.056 6 0.034 0.034 7 0.034 0.034 8 0.031 0.031 9 0.026 0.026 10 0.030 0.030
E= entrants; I = Incumbents, SE= surviving entrants, FE = failing entrants, COH: by cohort
Numbers in italics indicate non-significance at 5% level
In this Table, entry cohorts are pooled in order to put the emphasis on general trends in the maturation process of new firms. In this perspective, the first Column (E/I) which reports the TFP differences between all entrants and incumbent firms, simply resumes the general trend which already emerged from Table 4 about each entry cohort. The two next Columns (SE/I and FE/I) allow comparing the productivity gaps of, respectively, successful and failing entrants relative to incumbent firms. Finally the two last Columns in Table 5 show TFP differences between entrants themselves. Simple TFP differences are reported in Column FE/SE while TFP differences controlled by cohort are summarized in Column FE/SE (CHO).
The first important result from Table 5 is that both successful and unsuccessful entrants outperform incumbent firms. Moreover, both of them “reveal themselves” to be more productive than incumbents as soon as year 2 after entry. Finally, both of them maintain their productivity advantage over years 3 and 4. It is only in year 5 (i.e the last year of exit for a failing entrants) that the average productivity advantage of unsuccessful entrants over incumbent firms fall behind the own advantage of successful entrants.
This result questions the hypothesis of a harsh pure selection mechanism just after entry. Indeed, if such a process was occurring, then one should observe a stronger revealed productivity advantage for successful entrants compared to unsuccessful ones. The competitive view according to which new firms have to learn how to compete on imperfect competitive markets is then the most plausible view in accordance to the basic stylised facts that emerges from the first three Columns of Table 5.
If we turn now to the last Columns, additional insights can be given on the performance of successful entrants relative to unsuccessful ones. While no TFP differences emerge at first sight (see Column SE/FE), successful entrants reveal themselves to be actually more
productive than unsuccessful ones when TFP differences are controlled by the cohort (i.e. when the comparison involves only entrants of the same entry-cohort).
This productivity advantage of successful entrants over unsuccessful entrants may indicate that a pure natural selection mechanism is nonetheless at work. As this natural selection mechanism is not driven by the market competition with incumbent firms, it has to come from elsewhere. One hypothesis is that it comes from the competition that prevails between entrants themselves. This hypothesis is further investigated in Duration models in Section 7 below.
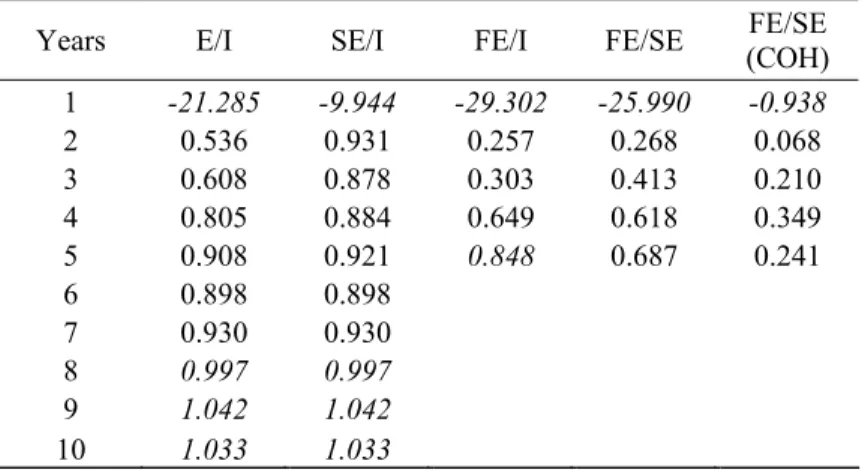
In order to go one step further, we also consider in Table 3 the maturation process of new entrants looking at their relative growth in terms of employment and profitability. Both indexes may give us more insights on the ability of some entrants (the surviving ones) to compete successfully against some others (their failing counterparts) and to grow rapidly enough to survive to the reactive strategies of incumbents.
Table 6a and 6b are built alike Table 5 except that relative profitability and size indexes are ratio and not differences. Consequently, a number equal to 1 in this Table (not to 0 as in Table 5) means identical performance. Once more, entry cohorts are pooled to put the emphasis on general trends and successful entrants (SE) versus failing entrants (FE) are compared no only among themselves but also between themselves and incumbent firms (I). In the last Column, COH means that the relative performance is controlled by the cohort.
Table 6a reports relative profitability indexes for the different population of firms. At the firm level, profitability is measured by the ratio of operating-cash flow on sales. At the population level, relative indexes correspond to the un-weighted average of the relative individual indexes.
While the profitability of entrants as a whole (E) apparently follow a regular catching-up process towards the profitability level of incumbents firms (1 means equal performance), the pictures changes radically when one discriminates between the two sub-populations of successful entrants (SE) and failing entrants (FE).
Table 6. Relative performances by the number of years after entry (ratios) Table 6a. Relative Profitability
Years E/I SE/I FE/I FE/SE FE/SE (COH) 1 -21.285 -9.944 -29.302 -25.990 -0.938 2 0.536 0.931 0.257 0.268 0.068 3 0.608 0.878 0.303 0.413 0.210 4 0.805 0.884 0.649 0.618 0.349 5 0.908 0.921 0.848 0.687 0.241 6 0.898 0.898 7 0.930 0.930 8 0.997 0.997 9 1.042 1.042 10 1.033 1.033
Table 6b. Relative Employment
Years E/I SE/I FE/I FE/SE FE/SE (COH) 1 0.470 0.514 0.438 0.783 0.753 2 0.485 0.534 0.450 0.795 0.729 3 0.539 0.555 0.520 0.904 0.777 4 0.552 0.569 0.520 0.891 0.807 5 0.562 0.573 0.515 0.877 0.736 6 0.574 0.574 7 0.586 0.586 8 0.632 0.632 9 0.660 0.660 10 0.677 0.677 E= entrants; I = Incumbents, SE= surviving entrants, FE = failing entrants, COH: by cohort
Numbers in italics indicate non-significance at 5% level
On the one hand, successful entrants catch up quite instantaneously to the profitability level of incumbent firms. On the other hand, failing entrants also catch up but at a much slower rate. Note that the mechanism underlying the catching up process of the FE population is clearly due to a selection process (i.e. the exit of the least profitable firms within 3 years after entry). Unsuccessful entrants that survive until age 4 and 5 do not exhibit similar weak relative performances (65 and 88 % of the profitability of incumbent firms respectively). This suggests that those firms were catching up, not falling behind, but this process wasn’t strong or fast enough to allow them to survive to the competition of the rest (young surviving firms and incumbents).
Table 6b reports the relative employment levels of the different population of firms. Once more, the dynamics of E/I is a catching-up dynamics. Note however, that new entrants remains relatively small compared to incumbent firms even 10 years after their entry. This feature is quite consistent with the existing literature on post-entry performance especially the one focusing on European countries. In contrast, successful US entrants are characterised by
much higher growth rates after entry (see Bartelsman, Schivardi and Scarpetta, 2005 for a recent comparative analysis of firm demography between Europe and US).
If we now consider the sub-population of SE and FE, two main results emerge. First, it appears that initial size of failing entrants is significantly smaller than the initial size of successful entrants. This may indicate that failing entrants suffer somehow from their relative smaller size and that this occurs despite their size disadvantage does not translate into a productivity disadvantage relative to their incumbent counterparts. Note, nonetheless, that the relative smallness of FE relative to SE is positively correlated with a productivity disadvantage. The second important result is that FE experience lower growth rates compared to SE but still follow a catching up process towards the employment level of incumbent firms. Once more, this leads us to conclude that FE do not survive mainly because they do not grow fast enough to struggle efficiently against their incumbent counterparts.
In summary, the analysis of post-entry performances on French manufacturing goods industries reveals that market selection processes are complex. They do not simply resume to
a natural selection process15 according to which new entrants exit when they reveal
themselves not able to reach the minimum productivity level required to become an incumbent firm. Moreover, different competitive games seem to co-exist between the different actors in the market. Specifically, while the competition between entrants and incumbents clearly involve something else than a pure selection mechanism (i.e. a selection only based on productivity differentials), the competition among entrants themselves seems to be more directly tied to differences in productive efficiency.
5. Pre-exit performances of mature firms.
In this Section, we take advantage of the time series dimension of our data set in order to investigate about the pre-exit performance of mature firms. If exit cohorts exhibit lower performance than their surviving counterparts in the year of market exit, one can wonder about how this phenomenon is achieved, i.e. how exit cohorts performance evolve in the years prior to exit. Griliches and Regev (1995) pointed out the existence of what they called a “shadow of death” effect which refers to the observation that a performance gap between exiting and surviving firms exists in the years before the exiting year. Few studies are addressing that issue and they can even reach contradicting results (see Wagner 1999 and Almus, 2002 on German data sets). Most of those empirical studies are addressing that shadow of death effect by using the evolution of employment growth rate as the main
15
indicator. We pursue this investigation in looking at two performance indicators beyond size/employment, namely TFP and profitability. At least, labour productivity is also documented in the Tables further but mainly as a sort of control variable.
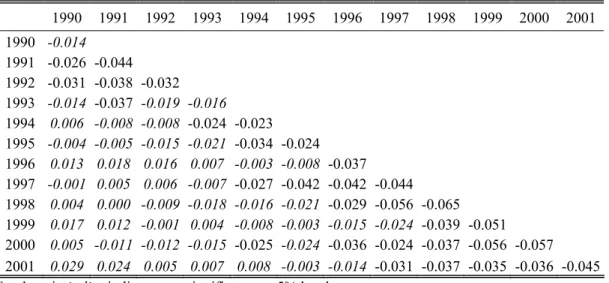
Let us start the discussion by Table 7 which displays the relative TFP performance of exiting cohorts as, instead of employment growth rates, we are considering TFP as a more informative performance indicator.
The reference population in each Column are firms of more than five years that are in the data base on the overall period (from 1990 to 2001). Then, each line of numbers expresses the evolution of the relative TFP difference between each exit cohort (from 1990 to 2001) and that population of incumbents.
Table 7. Pre-exit Performance of Exiting Firms (relative TFP)
1990 1991 1992 1993 1994 1995 1996 1997 1998 1999 2000 2001 1990 -0.014 1991 -0.026 -0.044 1992 -0.031 -0.038 -0.032 1993 -0.014 -0.037 -0.019 -0.016 1994 0.006 -0.008 -0.008 -0.024 -0.023 1995 -0.004 -0.005 -0.015 -0.021 -0.034 -0.024 1996 0.013 0.018 0.016 0.007 -0.003 -0.008 -0.037 1997 -0.001 0.005 0.006 -0.007 -0.027 -0.042 -0.042 -0.044 1998 0.004 0.000 -0.009 -0.018 -0.016 -0.021 -0.029 -0.056 -0.065 1999 0.017 0.012 -0.001 0.004 -0.008 -0.003 -0.015 -0.024 -0.039 -0.051 2000 0.005 -0.011 -0.012 -0.015 -0.025 -0.024 -0.036 -0.024 -0.037 -0.056 -0.057 2001 0.029 0.024 0.005 0.007 0.008 -0.003 -0.014 -0.031 -0.037 -0.035 -0.036 -0.045 Numbers in italics indicate non-significance at 5% level
There are two major results. The one is that all exit cohorts are less performing than the surviving firms far beyond the exit year. Except the 1996 exit cohort for which that lower performance is appearing only three years before the exit date, that relative TFP differential occurs far before the exit date (even ten years before for the 2000 exit cohort). The other is that this observation is significant in most of the cohorts not only at the exit date but in the years prior to exit. Moreover, that gap tends to gradually increase when we get closer to the exit date. In that respect, as far as TFP is concerned, we found the existence of a shadow of death effect in almost all exit cohorts. These results are quite similar to those exhibited in Kiyota (2005).The hypothesis that exiting firms perform lower productivity than the surviving ones not only the year of the exit but also some times before exit is almost confirmed over the overall period (1990-2001).
Now, let us improve that result by adding in the discussion two other performance indicators, size and profitability. Here, we pooled the exiting firms and develop a population analysis comparing their relative performance to the surviving firms (again the more-than five years firms in the sample).
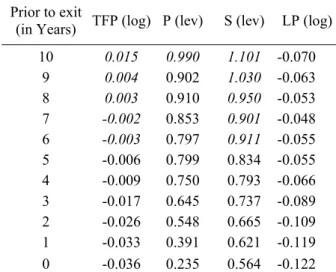
Table 8. TFP, Profitability and Size differences by number of years prior to exit
Prior to exit
(in Years) TFP (log) P (lev) S (lev) LP (log) 10 0.015 0.990 1.101 -0.070 9 0.004 0.902 1.030 -0.063 8 0.003 0.910 0.950 -0.053 7 -0.002 0.853 0.901 -0.048 6 -0.003 0.797 0.911 -0.055 5 -0.006 0.799 0.834 -0.055 4 -0.009 0.750 0.793 -0.066 3 -0.017 0.645 0.737 -0.089 2 -0.026 0.548 0.665 -0.109 1 -0.033 0.391 0.621 -0.119 0 -0.036 0.235 0.564 -0.122 Numbers in italics indicate non-significance at 5% level
A remarkable feature occurs which is the quite continuous decrease in the relative performance of exiting firms for each of the performance indicators in use. Relative TFP is gradually decreasing along the 10 years period before the exit date; it becomes negative seven years before the exit date even if this result is only significant five years before the exit date (bold numbers). Relative profitability and size are continuously decreasing and those indicators are significant 9 years and 6 years before the exit date, respectively. Moreover, the magnitude of relative profitability is quite higher than the ones of the two other performance indicators, and that magnitude also increases during the five years period prior to exit. As such, the evolution of firm profitability is probably the most relevant indicator to rely on firm exit mechanisms. Contrary to other contributions (see Van der Wiel, 1999), we found a remarkable similar trend among the three performance indicators in use to corroborate for the existence of a shadow of death effect from our data set. Finally, note that relative labour productivity is always negative. This can be thought of as an indication of a systematically weaker capital intensity of exiting firms, despite this could also be due to some composition effects, as we are discussing about a population of inter-sectoral firms.
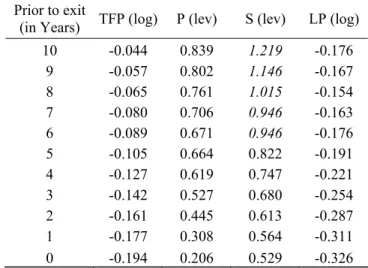
Moreover, those results are quite stable and robust. Table 9 provides the same information than the previous ones but the reference population is changed. Instead of using the overall mature firms in the sample, we apply a non parametric matching method similar to
Almus (2002) and compare exiting firms only to the sub-set of their most similar surviving counterparts. Actually, we match firms according to the following start-up characteristics: initial firm size, year of entry, industry classification at the 4digit, legal form and the initial number of establishments.
Table 9. TFP, Profitability and Size differences by number of years prior to exit (with matching)
Prior to exit
(in Years) TFP (log) P (lev) S (lev) LP (log) 10 -0.044 0.839 1.219 -0.176 9 -0.057 0.802 1.146 -0.167 8 -0.065 0.761 1.015 -0.154 7 -0.080 0.706 0.946 -0.163 6 -0.089 0.671 0.946 -0.176 5 -0.105 0.664 0.822 -0.191 4 -0.127 0.619 0.747 -0.221 3 -0.142 0.527 0.680 -0.254 2 -0.161 0.445 0.613 -0.287 1 -0.177 0.308 0.564 -0.311 0 -0.194 0.206 0.529 -0.326 Numbers in italics indicate non-significance at 5% level
The previous results are essentially affected in two ways. First, the matching method essentially improves the magnitudes in the decrease of performance of exiting firms, especially of their relative TFP growth rates. Second, it improves the significance of the results, at least for relative TFP and profitability. Relative size is not affected as far as the significance of that indicator is concerned.
At this stage, further discussion is needed about the relative importance of market selection. With regard to our performance indicators, it is noteworthy to emphasise how relative TFP to incumbents is not actually useful to discriminate between the population of failing and successful entrants in their post-entry behaviours. However, relative TFP gaps are significant as far as the pre-exit behaviours of exiting firms is concerned. Therefore, TFP can be thought of as a necessary but not sufficient condition to be fulfilled in order to stay on the market and further structural characteristics have also to be considered as far as explaining the market selection process is at central stake. In other words, market selection cannot be fully explained through a pure productive efficiency analysis.
Moreover, the existence of a quasi-systematic shadow of death effect can be interpreted in a twofold perspective: either it means that market selection is not effective enough and allows firms to survive whereas they should have left the market or, that market selection is efficient but allows firms to anticipate that they need to leave the market so as they react
gradually and adjust downward especially their employment level before actually leaving the market (Almus, 2002). Therefore, in the next Section, we focus the discussion about selection mechanisms as regards firms’ structural characteristics.
6. Market Selection and Firm Survival
6.1. Econometric Specification of the Duration Model
This Section presents the econometric model used to study the forces driving selection mechanisms for the population of firms above 20 employees in French manufacturing in the nineties. We estimate a duration model for grouped data following the approach first introduced by Prentice and Gloeckler (1978). Suppose there are firms i={1,…,N}, who enter the industry at time t=0. The hazard rate function for firm i at time t > 0 and t={1,…,T} is
assumed to take the proportional hazards form: λ λ
( )
exp( )
'βit o
it = t ⋅ X , where λo
( )
t is thebaseline hazard function and Xit is a series of time-varying covariates summarizing observed differences between firms. The discrete time formulation of the hazard of exit for firm i in time interval t is given by a complementary log logistic function such as
( )
X 1 exp{
exp(
X' (t))
}
ht it = − − itβ+θ , where θ(t) is the baseline hazard function relating the
hazard rate ht
(
Xit)
at the tth interval with the spell duration (Jenkins, 1995).This model is the discrete time counterpart of the Cox’s proportional hazard model for continuous time (see Meyer, 1990). It can be extended to account for unobserved but systematic differences between firms. Suppose that unobserved heterogeneity is described by a random variable i independent of Xit. The proportional hazards form with unobserved heterogeneity can now be written as λit =λo
( )
t ⋅εi⋅exp( )
Xit'β =λo( )
t ⋅exp(
Xit'β +logεi)
.Assuming that i is Gamma distributed with mean one and variance ν, the log-likelihood
function is written:
(
1)
log log 1∑
= − ⋅ + ⋅ = N i i i i i A c B c L where(
)
( )v t j it i i t X v A / 1 1 ' ) ( exp 1 − = ⎥⎦ ⎤ ⎢ ⎣ ⎡ + + =∑
β θ and(
)
( ) . 1 if , 1 or 1 if , ) ( exp 1 / 1 1 1 ' = − = > ⎥ ⎦ ⎤ ⎢ ⎣ ⎡ + + = − − =∑
i i i v t j it i t A t t X v B i θ βwhere ci is an indicator variable taking unity for firms exiting the market, 0 otherwise. The
parameter ν and β are to be estimated. Note that the proportional hazards form without
heterogeneity (λit =λo
( )
t ⋅exp( )
Xit'β ) is the limiting case as ν → 0. The relevance of theestimated unobserved heterogeneity is tested directly by the significance of parameter ν.
Besides, we also perform a likelihood ratio test between the unrestricted model (with unobserved heterogeneity) and the restricted model (without unobserved heterogeneity). The reported estimates are chosen from the LR test. We use originally two specifications for the discrete time proportional hazard model: (i) a flexible parametric specification for the baseline hazard function is a polynomial in duration; (ii) a log(time) specification for duration dependence, comparable to a Weibull model for continuous time duration models. Because the results do not differ significantly, we report the flexible parametric specification only.
We expect the hazard of exit to depend primarily on firm performance. However, we do not expect all performance variables to have a similar effect, depending on whether a firm is new to the market (age ≤ 5) or an incumbent (age°> 5). We define firm performance in terms of profitability, productivity and size. First, we expect profitability and size to boost survival for all types of firms, i.e. to impact negatively on the hazard of exit. The reason for this is that profitability is both the utmost condition and the chief objective for firms to survive and expand their activities. Additionally, we expect size to play a similar role, allowing us to grasp effects such as scale economies (other than those accounted for in the measure of productivity), scope economies, and lastly the stability of internally-generated funds, allowing large firms to spread the fixed costs of innovative activities into a wider spectrum of sales. The role of productivity is more ambiguous. Imagine that market competition for incumbents and entrants differ in systematic ways. Following Audretsch et al. (1999), incumbents could well compete on prices whereas entrants compete on product in specific market niches. Should this depict competition adequately for both entrants and incumbents, one would expect productivity to matter essentially on commodity markets, i.e. for incumbents, whereas this should not be necessarily the case for entrants. Therefore, we expect productivity to deter firm exit for incumbents, i.e. boost firm survival, whereas we expect no particular effect for entrants. Lastly, firm age is included as an additional proxy for firm performance.16.
We include a set of control variables in terms of industry structures and year of entry (vintage) which may steer firm exit beyond and above the presumably chief role of firm performance. The work of Gort and Klepper (1982), the more recent series of Klepper’s work
16
We also introduce the squared value of age in order to account for possible non linearity in the effect of age on the hazard of exit. Although interesting per se and reported below, we use more as a control variable and do not intend to comment on such parameters.
(1996; 2002) and Argarwal and Audretsch (2001) implies that the dynamics of industry is likely to affect firm exit. The stylised fact goes as follows. In early stages of the industry, competition is mainly based on product innovation. Both firm entry and firm exit are frequent, although entry dominates over exit. When the industry is mature, process innovation dominates so that price competition plays a major role in dictating firm exit. One should therefore control for such effect. To do so, we follow Mata and Portugal (1994) and define a series of additional variables as follows. First, entry represents a threat for incumbents, so that in industries with a high entry rate, we would expect firm lifetime to be shorter, i.e. we expect a positive sign on firm exit. We control further for the size of entrants to control for an ex post (and indirect) measure of barriers to entry. In industries with a high entrant size, barriers to entry are higher so that we expect firm lifetime to be longer (negative sign on firm exit). We control for industry structures by measuring the size of the industry (computed as the sum of sales by firm belonging to the industry) and the Herfindahl concentration index (defined as the sum of the squared market shares). Interpreting them as an indirect measure of industry maturity, we expect both measures to relate negatively to firm exit. In addition to Mata and Portugal, we compute the mean value of sectoral productivity to control for systematic differences in TFP levels across industries. The intuition here is that industries with high TFP levels may be associated with high turnover rates, selecting out firms with high productivity levels with respect to the rest of the economy. Ignoring this issue could produce an over-estimation of the TFP coefficient. Lastly, we control for vintage effects by including a series of binary variables indicating entry year.
In order to estimate the model, it is necessary to re-organise the data set in such a way that rather than the firm being the unit of analysis, we use the spells at risk. Entrants at the right-hand side of the datasets (year 2002) have been discarded from the analysis. All explanatory variables are entered in logs, so that estimated coefficients can be interpreted as the change in the discrete hazard rate for one percent change in the associated covariate. Because firms may have negative profitability values, we add to the vector of independent variable a dummy variable set to unity if the firm witness negative profitability, 0 otherwise, setting artificially the log value of their negative profitability to zero.
6.2. Results on Firm Duration
Table 10 reports the results for different specifications (Columns 1 to 4) and by decomposing the population of firms into incumbents that were operating already in 1984 (the start of the dataset) and entrants, that is, firms that have entered the market 1990 or after (Columns 5 and 6). The objective of such decomposition is to investigate whether the market selection forces
operate equally over these two types of firms. All models originally control for unobserved
heterogeneity as specified above. However, when the estimated variance of i is not
significant, Table 10 reports the results from our estimations for the restricted model only. Looking at the LR test, we find that the unrestricted models (accounting for unobserved heterogeneity) is preferred to the restricted specification (without unobserved heterogeneity) in 5 of the 6 specifications. Only for incumbents (Column 6) the restricted model is chosen. Unobserved heterogeneity is significant in only 3 cases (Columns 1, 3 and 5). Accounting for entry cohorts wipes out the effect of parameter ν, suggesting that a great deal of firm specific attributes is collinear with the year of entry. We opt for specification (3) for the estimations of the determinant of exit by type of firms (Columns 5 and 6).
Looking first at the whole population (Column 1), we find that both size and profitability have a negative impact on the hazard of exit. As stressed earlier, this should be expected. Large firms are likely to enjoy stronger financial resources and more stable revenues. Second, the effect of profitability on the hazard of exit is particularly large, suggesting that the probability of exit is very sensitive to small variations in firm profitability. Consistently, firms witnessing negative profitability are more likely to exit the industry. This should come as no surprise: profitable firms ought to remain on the market, whereas small departures from profitability may have dramatic consequences for firm survival. These results hold strongly across alternative specifications displayed in Columns 2 to 4.
Table 10. Firm Performance and Hazard of Exit in French Manufacturing Discrete Time Duration Model
Polynomial Baseline Hazard Function
ALL ALL ALL ALL E I
(1) (2) (3) (4) (5) (6) TFP (Log) 0.003 0.028 0.016 0.014 0.059 -0.143 [0.017] [0.018] [0.018] [0.018] [0.024]** [0.058]** Size (Log) -0.494 -0.495 -0.427 -0.424 -0.488 -0.341 [0.010]*** [0.011]*** [0.010]*** [0.011]*** [0.019]*** [0.021]*** Profitability (Log) -1.91 -1.933 -1.892 -1.884 -0.165 -0.112 [0.143]*** [0.143]*** [0.142]*** [0.143]*** [0.011]*** [0.022]*** Profitability < 0 (Dummy) 0.683 0.665 0.65 0.648 -0.716 0.100 [0.019]*** [0.019]*** [0.019]*** [0.019]*** [0.094]*** [0.193] Time -0.056 -0.058 0.105 0.129 0.198 0.537 [0.008]*** [0.008]*** [0.009]*** [0.011]*** [0.078]** [0.077]*** Time × Time -0.002 -0.002 -0.011 -0.012 -0.017 -0.036 [0.001]*** [0.001]*** [0.001]*** [0.001]*** [0.013] [0.004]*** Number of entrants (Log) -0.028 0.054 0.037 -0.014 -0.125
[0.019] [0.016]*** [0.016]** [0.023] [0.046]***
Mean size of entrants (Log) -0.017 0.006 0.003 -0.072 -0.056 [0.032] [0.020] [0.041] [0.036]** [0.060] Size of industry (Log) -0.205 -0.282 -0.265 -0.164 -0.037
[0.022]*** [0.017]*** [0.017]*** [0.023]*** [0.052] Herfindahl (Log) 0.009 0.042 0.034 0.048 -0.051 [0.013] [0.012]*** [0.016]** [0.009]*** [0.032] TFP industry average 0.006 -0.156 -0.118 0.169 0.039 [0.054] [0.053]*** [0.054]** [0.072]** [0.150] Age (Log) -0.589 -0.645 -0.443 [0.030]*** [0.033]*** [0.121]***
Age (Log) * Age (Log) 0.093 0.091 -0.046
[0.012]*** [0.016]*** [0.085] Cohort No No No Yes No No Constant 3.415 7.731 8.062 7.846 6.933 0.504 [0.111]*** [0.447]*** [0.378]*** [0.725]*** [0.509]*** [0.998] Variance of ν (Log) -13.812 -14.136 -13.599 -14.029 -13.125 -15.162 [7.855]* [11.917] [6.654]** [0.000] [7.551]* [-] Log Likelihood -74,589.2 -74,442.1 -73,911.7 -73,848.9 -26,411.3 -11,710.6 LR test 12,594.8*** 12,595.5*** 12,301.5*** 12,211.2*** 4,702.4*** 0.001 Observations 282,137 282,137 282,137 282,137 71,172 58,947
We find no significant effect of productivity on the hazard of exit across all specifications (Columns 1 to 4). This is consistent with our results on post-entry performance, where we find that failing entrants do not have significantly lower levels of total factor productivity.
Still, these results are at odds with our descriptive findings on pre-exit performance, where exitors’ productivity levels are significantly lower already five years before exit. What is happening is that controlling for other variables such as size and profitability wipes out the significance of productivity: TFP is neither a significant nor a sufficient explanation for firm exit. In fact, one may well conjecture that what is worth exploring is not so much the effect of productivity on firm exit. Instead, the investigation of the relationship between profitability and productivity, i.e. the causality and its direction, may prove more fruitful.
In Column (2), we include the vector of variables describing the sectoral characteristics: (the log of) the number of entrants; (the log of) the mean size of entrants; (the log of) the size of the industry; (the log of) the Herfindahl index and the mean value of sectoral TFP (computed as the arithmetic value of the log levels of firm TFP, by year and industry). Across all specification, (Columns 2 to 4) the size of industry has a negative effect on the hazard of exit.
There are two alternative, perhaps opposite, interpretations for this. First, large sectors (in terms of sales) offer a wide range of unexplored but available market opportunities which are yet to be exploited. This would allow all types of firms to benefit from first mover advantage from these unexplored niches. It is not clear whether incumbents or entrants are better able to seize such opportunities, for this depends on initial sunk costs, barriers to entry, the minimum efficient scale and the technological competencies needed to fulfil these niches.
The second takes the opposite path. In this case, industry size acts as proxy for the maturity of industry. With little or no room for additional entrants, all incumbent firms operate near or at equilibrium, so that the industry turnover rate is low. Thus the observed coefficient could also indicate industry maturity. It is not easy to say which effect dominates, but we will come back to this issue when we investigate the stability of the selection mechanisms by distinguishing entrants from mature firms.
Pushing further the analysis of the influence of industry characteristics on market selection, we observe a significant and positive effect of the Herfindahl index on the hazard of exit. This suggests that concentrated industries boost the selection of firms. This should be expected: processes of industrial concentration naturally translate into a lower number of firms by boosting firm exit. Lastly, average sectoral TFP, although not significant in Column (2), becomes significant and negative in Columns (3) and (4). This is contradictory to the observation that sectoral productivity growth is associated with higher firm turnover, i.e. firm entry on and firm exit from the market. One possible explanation is that high productivity growth rates are associated with many technological opportunities, the exploitation of which
could boost firm survival. More generally, our results call for a finer investigation regarding the effect of firm performance, industry structures on the hazard of exit, by firm type.
Columns (5) and (6) display the estimated coefficients for both entrants, defined as those firms having entered our dataset between 1990 and 2001, and incumbents, defined as those firms that were present from the starting date in 1984. As a consequence, no parameter estimate for the effect of age on firm survival is reported for incumbents. Two main results emerge from the last two Columns of Table 10. First, if both size and profitability have a significant and negative effect on the hazard of exit, we find evidence of a divergent effect of productivity on firm exit.17 For incumbents, productivity is negatively associated with the hazard of exit, suggesting that for incumbents, moves away from productive efficiency are particularly painful and may translate into a lower profitability, and eventually into exit from the market. For entrants, our expectation was that TFP would play no particular role for entrants. Instead, we find that more productive firms are more likely to exit. This is somewhat striking, and our proposed interpretation should be taken with great caution. Imagine that entrants position themselves primarily on the high quality end of markets, necessitating continuous investment in upstream research and development and more risky positioning on the market. In this sense, high initial TFP can be associated with high risk and consequently higher hazard exit rates.
More generally, our findings suggest the existence of a two-tier market structure. The first layer is that of rather stable large firms, i.e. incumbents, for which competition is mainly based on price competition, implying that departures from productive efficiency may prove harmful. Such firms are not very sensitive to market structures18, the reason being that they themselves define the bulk of the industry. The negative and significant sign of the number of entrants suggest that it is not entry per se that threaten the survival of incumbent firms. It rather might be the successful growing adolescents which put threat on mature firms. The near significance and negative sign of Herfindahl is worth noting: it could reveal behaviour of collusion amongst large firms, which are aimed at prolonging preferential market position, in highly concentrated markets. This fine and stable market structure differs from the second, more turbulent, layer. Entrants compete on products and are subjugated to industry structures. With the exception of the number of entrants, all industry characteristics have a significant effect on firm exit. The mean size of entrants and industry size are negatively associated with the hazard of exit. This pleads in favour of the idea that large sectors offer a wide range of
17
Interestingly, we note that the significance of TFP is lower that those for size and profitability, implying that TFP, although important, is not the prime driver of firm duration.
18