HAL Id: hal-02818053
https://hal.inrae.fr/hal-02818053
Preprint submitted on 6 Jun 2020
HAL is a multi-disciplinary open access
archive for the deposit and dissemination of sci-entific research documents, whether they are pub-lished or not. The documents may come from teaching and research institutions in France or abroad, or from public or private research centers.
L’archive ouverte pluridisciplinaire HAL, est destinée au dépôt et à la diffusion de documents scientifiques de niveau recherche, publiés ou non, émanant des établissements d’enseignement et de recherche français ou étrangers, des laboratoires publics ou privés.
Which firms have a soft loan? Managers’ believes in a
cross-country survey in transition economies
Celine Bignebat, Fabian Gouret
To cite this version:
Celine Bignebat, Fabian Gouret. Which firms have a soft loan? Managers’ believes in a cross-country survey in transition economies. 2006. �hal-02818053�
Associé :
N° 3 / 2006
Which Firms Have a Soft Loan ?
Managers’ Believes in a Cross-Country Survey
in Transition Economies
C. BIGNEBAT, F. GOURET
Which Firms Have a Soft Loan? Managers' Believes in a Cross-Country
Survey in Transition Economies
1Céline Bignebat
INRA, Institut National de la Recherche Agronomique ; UMR MOISA, Marchés Organisation Institutions et Stratégies d’Acteurs ;
Montpellier, France
bignebat@ensam.inra.fr
Fabian Gouret
Centre d'Economie de la Sorbonne, UMR8174, ROSES ;
Université Paris 1 Panthéon-Sorbonne, Maison des Sciences Economiques ; Paris, FRANCE,
Fabian.Gouret@malix.univ-paris1.fr
Abstract
This paper is an empirical work grounded in the soft budget constraint literature. A loan is soft when a bank cannot commit to hold an enterprise to a fixed initial budget and/or the timing of repayment. Using data collected by the EBRD (BEEPS 2002) in 26 transition economies, we analyze the determinants of managers' expectations to have a soft loan. We show that managers' believes integrate some of the decision criteria of the banks: managers' expectations to have soft loans are lower when the initial financing requires collateral, higher for big firms and higher when firms had recently experienced financial distress.
Keywords: Soft budget constraint, Eastern Europe.
Quelles firmes ont un prêt lâche? Les croyances des managers dans les économies en transition Résumé
Ce papier empirique s'inscrit dans la littérature sur la contrainte budgétaire lâche. Un prêt est lâche quand la banque ne peut pas s'engager, de manière crédible, à maintenir le prêt à un certain montant et/ou à certaines échéances. A l'aide de données collectées par la BERD (BEEPS 2002) dans 26 pays en transition, on analyse les croyances des managers d'obtenir un prêt lâche. Les managers intègrent dans leurs croyances les critères de décision des banques. Les anticipations d'avoir un prêt lâche sont plus faibles quand le financement engage un collatéral. Les grandes firmes et les firmes qui ont connu des difficultés financières ont, elles, des anticipations plus élevées.
Mots Clefs : Contrainte budgétaire lâche, Europe de l'Est.
1
Introduction
The term “soft budget constraint” (SBC1) was first introduced by Kornai (1979)
to illuminate economic behavior in socialist economies. It is now widely used to describe similar phenomena in post-socialist, developed and developing countries2.
The concept alludes to a situation in which a loss-making firm is bailed out (by a government, a bank or an other institution). Furthermore, the expectation of the decision-maker as to whether the firm will be bailed out in case of trouble is at the heart of the syndrome because this expectation affects his behavior (Kornai, 1979; 1998a). The SBC syndrome is acknowledged to be an obstacle to the restructuring of loss-making firms, the efficient use of inputs and macroeconomic stability (Dewa-tripont and Roland, 2000). However, despite considerable progress in the last decade to give theoretical explanations to the SBC syndrome3, empirical research on the
determinants of SBC is still in its infancy (Djankov and Murrell, 2002; Kornai et al., 2003). It is due to the fact that the notion of softness is difficult to operationalize. In line with the works of Kornai, an empirical measure has to capture the expec-tations of managers to be bailed out in case of trouble. Thus, SBC theorists argue that e.g. subsidization of loss-making firms is not identical to SBC.4 Furthermore,
SBC theorists often argue that empirical works are not closely grounded in theory (Kornai et al., 2003).
This empirical paper follows the line of research initiated by Dewatripont and Maskin (1995) by considering that the SBC syndrome occurs when a funding source (in our case banks) cannot commit to keep an enterprise to a fixed initial budget and/or to maintain the timing of repayment specified by the contract. Indeed,
despite the fact that the bank understands ex post that the firm should not have been financed initially, it might be optimal to refinance it because an initial injection is sunk. If it is the case, we say that the firm has a soft loan. We use a data set of nearly 4500 loan applicants in 26 transition economies in which there is a selection process from the banks among applicants. Firms which obtain a loan might expect that if they fall behind in the repayment of their loan, the bank will extend the term of the loan or will be ready to wait without beginning legal proceedings to take possession of the collateral; this occurs because an initial injection of funds is sunk. We analyze the determinants of the managers’ expectations to have a soft loan: we use a censored bivariate probit, because some projects were not financed by the banks. The selection equation, i.e. to be granted a loan or not, is important because it determines the capacity of the banks to apply accurate credit assessment. Adequate lending criteria for the selection of projects allow the banks to decrease the SBC syndrome.
Consequently, our paper contributes to the progress of the SBC literature in at least two ways. First, our empirical work is linked to the line of research initiated by Dewatripont and Maskin (1995) which see the SBC as a commitment problem. Furthermore, the framework allows to test other motives proposed by the literature, like political motives of keeping workers employed. Second, our paper clearly follows the idea that the SBC is related to decision-makers’ expectations. Until now, only Anderson et al. (2000) elicit directly managers’ expectations. They focus on the expectations of managers concerning state aid in case of financial difficulties by investigating a data set of 200 Mongolian firms. They examine various causes of soft budgets in addition to state ownership but they do not consider the commitment
problem as such.5
However, our paper has also two caveats. First, we focus on loan as a mean of softening. Nevertheless, loans are not the unique mean of softening the BC. There are various means of rescue (fiscal means like subsidies or tax concessions, credit means like loans or trade credit), and when one mean of softening is restricted, like loans, another may come to the fore, e.g. tax concessions. Consequently and following this example, observing only loans or managers’ expectations to have soft loans can generate misleading conclusions if the major mean of softening is based on subsidies. However, various authors (e.g., Berglof and Roland, 1998; Dewatripont and Roland, 2000) note that governments have drastically reduced subsidies to firms in transition economies and loss-making firms are mostly bailed out via bank loans. Furthermore, various empirical works have shown that the banking sector does not seem to apply accurate credit assessment in transition economies. Banks tended to give preferences to distressed firms to allocate credit during the nineties6. Second, if our paper clearly
follows the idea that SBC is related to the firm decision-makers’ expectations, the legitimacy to take expectations rather than facts into account might be questioned. Thus, our study has the same disadvantage than Anderson et al. (2000). However, given the paucity of empirical works on SBC, our analysis might offer significant new insights. Furthermore, we highlight that the SBC syndrome is related to managers’ expectations which, in turn, are formed upon the basis of their own experience and that of other firms in the economy (Kornai, 1979; Kornai et al., 2003).
The remainder of the paper is structured as follows. Section 2 describes our framework. It permits to highlight the determinants of the SBC that we will test. Section 3 presents our econometric methodology. Section 4 presents the data and
results. Finally section 5 concludes.
2
To Have a Soft Loan or Not?
This section borrows from Kornai et al. (2003) and Boyes et al. (1989) and presents the main aspects of our framework.
Assume that a firm submits a project to a bank in period t. The bank can decide to grant a loan of an amount l1 or to denied it. If funded, the project can yield a
gross monetary return of Rg > l1 within the period t. It can also be defaulted. In
such a case the bank has two possibilities:
• it could begin legal proceedings to take possession of the collateral of a value Col.
• alternatively, the bank could refinance the project by injecting an additional
capital of l2, extend the term of the loan or do nothing and wait to obtain an
expected gross return of Rp in t + 1. In such a case, the loan is said to be soft.
If the project is defaulted, the firm manager will have a soft loan if:
Rp− l2 > Col (1)
When condition 1 is satisfied, the loan is soft because the bank prefers to refinance the project by injecting the additional capital, or to extend the term of the loan, or to do nothing and wait. Thus, for a firm which has obtained a loan in t, the lower the collateral, the higher the probability of having a soft loan. Our data set allows to test the following implication (see section 4 for a presentation of the data):
Testable Implication 1 For a firm which has obtained a loan, manager’s
expec-tation to have a soft loan is lower when the initial financing requires collateral.
However, note that the firm has a soft loan if and only if the bank has not been able to select good applicants in the first step. The loan can be repaid or defaulted (in such a situation the loan is soft or not). Then, each loan yields two possible outcomes that can be described by a Bernouilli trial:
π = Rg− l1 with probability p
max{Rp− l2; Col} − l1 with probability (1 − p)
(2)
Following the literature on credit scoring (Boyes et al., 1989), the bank establishes a credit approval for each firm applicant if it knows all the parameters of this trial. Hence, a loan is granted only to those firms with probabilities of success p such that:
p > l1− max{Rp− l2; Col} Rg − max{Rp − l2; Col}
≡ ¯p (3)
The firm has a soft loan if p > ¯p and Rp− l2 > Col. One can see that the SBC is, in
statistical inference terminology, a type II error: the bank fails to reject the initial funding of poor projects. Hence, the capacity of the bank to apply accurate credit assessment in the first step is crucial because it can reduce the SBC problem.
The framework developed above can be extended to include different possible causes of the SBC syndrome identified by the theoretical literature. First, the bank’s ownership structure might matter. If a private bank is presumably in the business of maximizing profit, it is not the case of a state-owned bank. The latter maximizes social welfare or political benefit of keeping firm workers employed. Assume that
the bank is state-owned and denote E the external effect of a project (E > 0). A state-owned bank will refinance a project if Rp+ E − l2 > Col. This condition is
less demanding than Rp− l2 > Col; thus we obtain the second testable implication:
Testable Implication 2 A manager who has obtained a loan from a state-owned
bank has a higher expectation to have a soft loan than a manager who has obtained a loan from a private bank.
However, the following remark is necessary. The game sketched above is com-posed of two players: a firm manager and a bank. Now, let’s assume that there is a third player, the government, and that the bank is private. In such a case, if the firm is a political capital for the government (the firm is state-owned, too big to fail, or a monopoly7), even a private bank might extend the term of the loan to the firm
or wait and do nothing because the private bank expects the government will be the ultimate guarantor of the firm in case of trouble.
Testable Implication 3 A firm which is a political capital for the government has
a higher probability to have a soft loan, even if granted by a private bank, than a firm which is not a political capital and vice versa. Furthermore, a firm which is a political capital is more able to obtain a loan than a firm which is not because the bank might expect that the firm which is a political capital has a ultimate guarantor, i.e. the government, in case of trouble.
3
Econometric Methodology
3.1
A bivariate qualitative dependent variable model with
censoring
Given the model sketched above and the data at our disposal (that we will de-scribe in the next section), expectations to have a soft loan are censored since banks do not grant a loan to all the applicants because of a selection process. Conse-quently the bivariate probit with censoring is the natural tool for our estimations. This econometric model was first explored by Van de Ven and Van Praag (1981).8
Suppose that Y∗
i is a continuous latent variable reflecting the degree of softness
of the budget constraint of enterprise i. Thus, we have:
Yi∗ = X1iβ + ²1i (4)
with X1i a vector of observed observations, including the variables considered as
po-tential determinants of managers’ expectations: the collateral, the degree of market power, the size and the ownership of the firm. We will call this equation the Sof t equation. We consider the binary response of enterprise i about the expectation to have a soft loan or not:
Sof ti = 1 if Yi∗ > 0 (5)
Sof ti = 0 if Yi∗ ≤ 0 (6)
received a credit are observed. To put this in a familiar context, the selection equation is:
Loani = (Ziγ + ²2i > 0) (7)
with Loani = 1 if the firm i obtains a loan, 0 otherwise. Zi includes traditional
variables of credit scoring models: the firm’s and manager’s characteristics. Finally, note that V ar(²1i) = V ar(²2i) = 1 (this assumption is the standard normalization
for probit selection equation) and Cov(²1i, ²2i) = ρ. The selection equation, called
the Loan equation, is fundamental since the capacity of the banking system to apply accurate lending criteria is crucial. If Loan = 1 and Sof t = 1, the manager obtains a soft loan. Thus the probability that a manager obtains a soft loan is the bivariate probability P rob(Sof t = 1, Loan = 1).
The likelihood function is:
L = Y i∈S Sof ti=1 Φ2(X1iβ, Ziγ; ρ) Y i∈S Sof ti=0 Φ2(−X1iβ, Ziγ; −ρ) Y i6∈S Φ(−Ziγ) (8)
where S is the set of observations for which Sof ti is observed. Φ and Φ2 are the
stan-dard cumulative normal and the cumulative bivariate normal distribution function, respectively.
4
Estimation Results
4.1
Data and Model Specification
The data used in this paper are drawn from the Business Enivronmment and En-terprise Performance Survey (BEEPS), developed jointly by the World Bank (WB)
and the European Bank for Reconstruction and Development (EBRD). It is a sur-vey of 6367 firms in 26 transition economies9, as well as in Turkey, conducted in
the first half of 2002. It was collected on the basis of face-to-face interviews with owners, managers or finance officers through site visits by surveyors trained accord-ing to a standardized methodology. The sample was structured to be representative of each countries with specific quotas placed on size, sector, ownership and export orientation (MEMRB, 2002; Hellman and Kaufman, 2002). We have restricted our sample to firms in transition economies, i.e. we drop firms located in Turkey (511 observations).
-Insert table
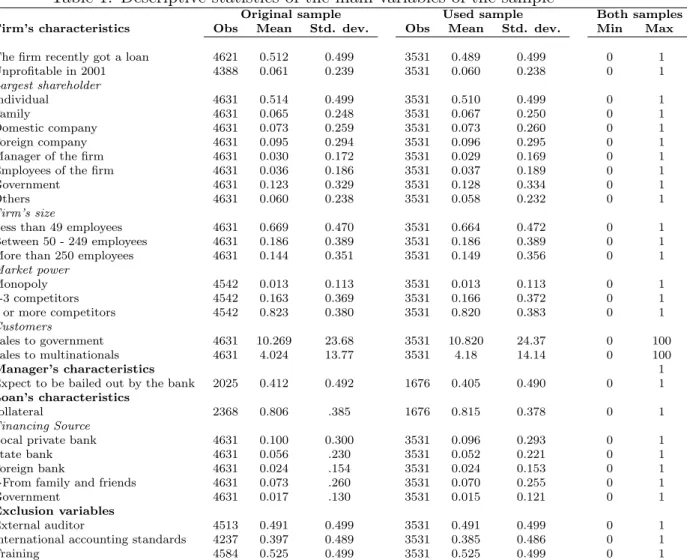
1-The BEEPS data set includes some particulary interesting questions dealing with SBC. Table 1 provides the descriptive statistics of the main variables of interest. It especially provides the two following crucial informations:
• If the firm has obtained a loan recently or not (the Loan variable).
• And if the firm has obtained a loan, does the firm expect to have a soft loan
(the Sof t variable).
Concerning the Loan variable, we do not know directly from the data set if the firms which do not have a loan ask for it or not. Like in traditional credit scoring models (Boyes et al., 1989; Greene, 1992), we consider only firms which are loan applicants. However, we know from the survey if the firm faces major obstacles to get a financing from banks. Consequently, we drop of the survey all the firms without loans which consider not to have major difficulties to be granted a loan
(1225 firms, Turkish firms excluded). Thus, we consider that the applicants are the firms which are granted a loan (2368) and those firms which do not have a loan and whom access to financing from banks is an obstacle (2253). Consequently, we have 4621 loan applicants10. The lost of observations caused by missing answers is
around 23% of the original sample. But we believe that this does not bias our results because the summary statistics of the original and the used sample look very similar (table 1).
The Sof t variable reflects the expectations of managers concerning the bank’s reaction if they fall behind in their bank repayments. More precisely, the question is the following:
Now I would like to ask you a hypothetical question. If your firm were to fall behind in its bank repayments, which of the following would best describe how you would expect the bank to react? [1] Do nothing, [2] Extend the term of the loan without changing the condition, [3] Extend the term of the loan but increase the interest rate, [4] Begin legal proceedings to take possession of assets, [5] Don’t know.
-Insert table
2-Concerning the answers, none of the managers answer that [5] they do not know. We assume that Sof ti = 1 if the manager of the firm i expects that [1] the bank
will do nothing or [2] the bank extend the term of the loan without changing the condition. Indeed, in these two cases, the loan is soft. Sof ti = 0 if the manager of
the firm i expects that [3] the bank will extend the term of the loan but increase the interest rate, or [4] the bank will begin legal proceedings to take possession
possession of assets. Considering that Sof ti = 0 when the manager of the firm i
expects [3] is defensible, but admittedly arbitrary. Furthermore, answer [3] is the answer the most often quoted (see table 2). Consequently, we have also considered that Sof ti = 1 if the manager answers [3] but the results are qualitatively the same.
Following the framework of section 2, there are at least five sets of regressors of the Sof t equation in which we are mainly interested. The variables of special interest are the following:
• We consider the variable Col to test implication 1, with Col = 1 if the initial
financing required collateral, 0 otherwise.
• For implication 2, we consider a set of dummy variables that reflects the
own-ership type of the main financial source of the firms. However, we note that the BEEPS data set does not specify if the loan in consideration came from the main financial source of the firm. Consequently, the results obtained will be only indicative. It might not reflect perfectly if the ownership of the funding source influences a manager’s expectation to have a soft loan.
• For implication 3, we first consider a set of dummy variables that depicts the
type of the firm’s main shareholder. We especially expect that the manager of state firm has a higher probability to contractual arrangements such as term’s extension. Furthermore, state firms might be a political capital and the banks will rather grant a loan to them because they expect the government plays as a ultimate guarantor.
• Second, we also consider a set of dummy variables that describe the firm’s size.
(small) firms. Furthermore, the bigger (smaller) the firm, the higher (lower) the probability that it is a political capital for the government, and thus the higher is the probability to obtain a loan in a first step.
• Third, a set of dummy variables standing for the firm’s market power is
intro-duced.
We will also introduce various control variables that might explain managers’ expectations. First, we consider a dummy variable indicating if the firm had financial difficulties in the recent past or not. If the firm had been unprofitable, it means that it has been helped out, and the survival of the firm breaks away from its financial situation. Thus, “the manager of the firm may feel that the probability
has grown that his firm would also survive despite a financial failure caused by a wrong investment” (Kornai, 1979, p.807). We will also control for the firm’s and
manager’s characteristics: age and education of the manager, sector of activity and the percentage of sales by customers (the government, multinationals or others).
The right-hand side variables of the loan equation are, like in a traditional scoring model, variables reflecting the characteristics of the firm and its manager. Thus they are mainly the same than those of the Sof t equation. However, identification of the parameters of the Sof t equation necessitates exclusion restrictions. These variables would ideally influence the Loan equation, but not the Sof t equation. We propose the following exclusion variables:
• A dummy variable (IAS) equal to 1 if the firm uses international accounting
standards, 0 otherwise.
statement reviewed by an external auditor, 0 otherwise.
• A dummy variable (T raining) equal to 1 if some employees received training
in 2001 (managers or workers).
These exclusion variables can influence the bank’s decision to grant a loan to the firm. Indeed, using international accounting standards, having an external auditor reviewing annual financial statement or offering formal training to employees can be perceived by the bank as a signal of a firm trying to adapt to the rules of a market economy. Consequently, a bank is more disposed to grant a loan to such a firm. However, there is no logical or theoretical explanations which can directly link these variables to the fact to have a soft loan or not (and none of them is statistically significant when we include them in a probit estimation of the Sof t equation).
Finally we will use a set of dummy variables called Macro to control for dif-ferences in the quality of the banking system of the 26 countries. The quality of the banking system is reflected by the variable “Banking reform” of the EBRD in 2001. This variable comes from 1 to 4.33. However, this variable is ordinal but not cardinal. A score of 4 for a country does not mean that it has made twice as much progress in banking reform than a country scoring 2. To overcome this problem, we transform the “banking reform” (BR) indicator into three dummy variables. The variable Macro1 takes the value 1 if the BR indicator is greater than 3, 0 otherwise. The variables Macro2 = 1 if BR ∈]2, 3], 0 otherwise and Macro3 = 1 if BR ∈ [1, 2], 0 otherwise.
4.2
Results
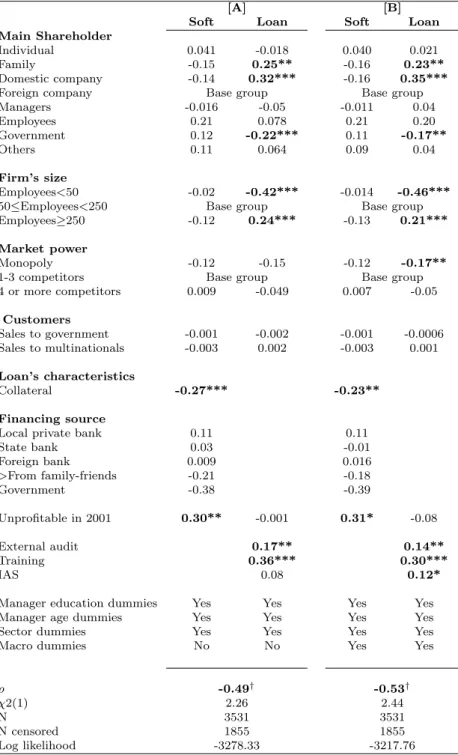
The bivariate censored probit estimates for the loan granting decision (Loan) and the expectation to have a soft loan (Sof t) are presented in table 3. In all the specifications, we control for autocorrelation by clustering the bivariate censored probit at the country-level. Contrary to specification [B], specification [A] does not control for differences in the financial environment of 26 countries through the
Macro dummy variables. In table 4, we present the marginal effects (or discrete
changes for dummy variables) at the mean values of some important variables for the probability of obtaining a loan, i.e. it presents ∂P rob[Loan=1|X]∂X , with X = X1 ∪ Z. The marginal effects of column [A] in table 4 correspond to the results of the selection equation Loan of specification [A] in table 3 and so on. In table 5, we present the marginal effects of some explanatory variables on manager’s expectations at the means values, conditional to the obtention of a loan, i.e. ∂P rob[Sof t|Loan=1,X]∂X . Finally, table 6 presents the marginal effects of change in X on the probability to obtain a soft loan, i.e. ∂P rob[Sof t=1,Loan=1]∂X .
-Insert tables 3, 4, 5 and
6-The collateral-testable implication
1-In line with the framework presented in section 2, firms’ managers whom initial financing required collateral are less likely to expect to have a soft loan. A firm whom initial financing required collateral is 9.7 − 11.2% less likely to expect to have a soft loan when it has obtained previously a loan (table 5).
2-Surprisingly, we do not find any statistical positive relation between the fact that a bank is state-owned and expectations to have a soft loan. Furthermore there is no difference whatever the ownership of the funding sources. This result is perhaps due to the fact that we do not really know if the main financing source is the bank which grants the loan.
The size of the firm-testable implication
3-The larger the firm, the more likely to obtain a loan. Table 4 indicates that firms with more than 250 employees are 8.65-9.63% more likely to obtain a loan than firms which have between 50 and 250 employees ceteris paribus. Firms with less than 50 employees are 16.83 − 18.15% less likely to obtain a loan than firms which employ between 50 and 250 employees. Now, what is the influence of the firm’s size on managers expectations to have an extension, conditional to the fact that they have obtained a loan? When they have obtained a loan, the expectations of firms with less than 50 employees are 6.6 − 7.57% less important than bigger firms (table 5). And, firms with less than 50 employees are 9.93 − 10.91% less likely to obtain a soft loan than the others (table 6). These results suggest that large firms constitute probably a political capital for the government. Consequently, the banks prefer to select big firms’ loan applicants as they know that the government is a ultimate guarantor in case of financial trouble.
Ownership of the firm-testable implication
3-The results concerning the firm ownership contrast with those obtained for the size. First, state-owned enterprises are 6.8 − 8.6% less likely to obtain a loan than foreign firms (table 4). Furthermore, a state manager who obtains a loan is not more likely to expect the bank will help in case of trouble (table 5). It seems that
state-owned ownership per se does not constitute a reason for the government to rescue firms. On the contrary, when firms are owned by employees, firms are 8.1% more likely to obtain a loan when we control for the financial macroeconomic environment (specification [B], table 4). Furthermore, a firm owned by employees is 12.3% more likely to expect to have a soft loan when it has a loan (table 5).
These results, apparently paradoxical, might be explained by various elements. On the one hand, many authors highlight that governments have drastically reduced subsidies to SOE, especially in Hungary and Poland (Aghion & Blanchard, 1994; Pinto et al., 1993). On the other hand, various authors highlight that policymakers gave away firms’ ownership and control to employees to lean on them for supporting reforms, especially in CIS countries (Stern in Hirschler, 2000; Kornai, 2001). Thus, these governments couldn’t do anything but help them in case of trouble through an extension of the terms of repayment (if the government controls the bank), or subsidies. Otherwise, the political capital that the governments obtained would have been lost.
In line with these remarks, it seems that the results concerning employee own-ership obtained when we use all the sample are driven by CIS data. In fact, we estimated specification [B] by dropping the observations of CIS and non-CIS at a time11. When we considered only firms in CIS, firms owned by employees are 10.8%
more likely to obtain a loan (at the 5% level) than foreign companies. Furthermore, they are 20.2% more likely to expect to have a soft loan when having a loan. On the contrary, in the non-CIS countries, firms owned by employees are not more likely to obtain a loan and do not have different expectations than the base group12.
3-Firms which enjoy market power, i.e. having less than 4 competitors, are 6%-7% less likely to obtain a loan (table 4). Furthermore, the competition environment does not seem to influence managers’expectations (table 5).
Past firm’s performance
Firms which were unprofitable in 2001 are not more likely to obtain a loan. Thus, results might suggest that there is an amelioration of the banking system because various authors have shown that banks tended to give preferences to distressed firms to allocate credit during the nineties in transition countries (Bonin and Schaffer, 1995; Brana et al., 1999; Coricelli and Djankov, 2001). However, managers of firms which were in financial distress in 2001 and who obtain a loan are more likely to believe that the bank will not engage legal proceedings if they fall behind in their repayment. Considering the firms that obtained a loan, those which were unprof-itable in 2001 are 12 − 13.15% more likely to believe that they have a soft loan than those which were profitable in 2001 (table 4).
Lastly, the estimate of ρ that maximizes the bivariate probit likelihood presented in equation 8 is negative and significantly different from 0 in both specifications (see table 3) at the 15% level. It suggests that unexplained tendencies to grant a credit are associated with a lower frequencies of managers’ expectations to have a soft loan. To check the robustness of these results, we repeated the estimations for various sub-samples and control variables (not reported). We first repeated the regressions for various sub-samples. We estimated the same specifications by dropping all the observations of one country at a time. Second, we divided the data set into the CIS and the non-CIS countries. Results were qualitatively the same, except for the “employee ownership variable” as mentioned previously. Third, we also introduced
country dummy variables instead of the Macro dummies. Results were identical. Lastly, the Sof t variable reflects the expectations of managers concerning the bank’s reaction in case of trouble. We highlighted in subsection 4.1 that we considered
Sof t = 0 when managers expect [4] that the bank will begin legal proceedings to
take possession of assets and also when [3] the bank will extend the term of the loan but increase the interest rate. Considering that Sof t = 0 when managers answer [3] is arbitrary; thus we also considered that Sof t = 1 when managers answer [3]. Results were broadly the same. The main difference concerns the collateral variable. If we consider Sof t = 1 when managers answer [1], [2] or [3], we conclude at the 5% level of significance that firms whom initial financing required collateral are 4.97% less likely to expect to have a soft loan when it get a loan (contrary to 9.7 − 11.2% obtained previously).13
5
Conclusion
This empirical paper considers that the SBC syndrome occurs when a funding source (in our case banks) cannot commit to hold an enterprise to a fixed initial budget and/or the timing of repayment. Four results seem to be robust. First, managers’ expectations to have a soft loan are lower when the initial financing re-quires collateral. Second, the probability to obtain a loan as well as the probability to expect a soft loan are higher for large firms. The third conclusion is not trivial: managers of state firm don’t exhibit different expectations than managers of other firms and have a lower probability to obtain a loan. Finally, managers of firms which were in financial distress in the past history are more likely to believe that the bank
will not engage in legal proceedings.
We conclude with two words of caution. First, concerning the no significance of the ownership of banks, our results are no more than suggestive because we do not really know if the main financing source is the bank which grants the loan. Second, we assumed in the paper that Sof t really measures soft budgets, i.e. expectations are perfect. But it might reflect manager’s erroneous expectations. Nevertheless, the dependent variable examined in our paper reflects an important element of reality as highlighted by Anderson et al (2000). Even if expectations are erroneous, it is expectations that lead to inefficient enterprise decisions. These two remarks highlight that we need more surveys specifically designed for studying the determinants of the SBC phenomenon. It might open a wide field for further research.
Notes
1HBC and BC stand respectively for hard budget constraint and budget constraint.
2For example Huang and Xu (1998) believe that the SBC in the banking sector of East Asia
have played an important role in the financial crisis of the late nineties.
3See Kornai et al. (2003) for a review of theoretical explanations of the SBC syndrome.
4For example, Qian and Roland (1998) remarks that “Subsidization of loss-making firms is
often an indicator of soft budget constraints. However, subsidies are not identical to soft budget constraints. There are cases in which firms receive subsidies but do not expect to be bailed in cases of bad financial performance.”
5Two other important empirical papers provide indirect confirmation that SBC is incorporated
in managers’ expectations. Using a sample of several hundred Chinese state firms over the period 1980-1994, Li and Liang (1998) show that losses were especially due to labor redundancy. It confirms indirectly that managers were convinced to be perpetually rescued. In a panel data set of Italian state-owned firms interviewed from 1977 to 1993, Bertero and Rondi (2000) indirectly show that managers’ expectations evolved at the end of the 1980s: state firms responded to the decrease of subsidies and bank loans (probably due to the European Union pressure in order to reduce state aid and to accelerate privatization programs) by increasing productivity and reducing overmanning.
6See, to name but a few examples, Bonin and Schaffer (1995) and Schaffer (1998) for Hungary,
Brana et al. (1999) for Russia, Coricelli and Djankov (2001) for Romania.
7As argued by Kornai (1998a), a firm which enjoys market power might be a political capital
because the liquidation of its assets may upset other firms as well, and precipitate a serious loss for the society.
8See also Boyes et al. (1989) and Greene (1992) who applied the same econometric model to
credit scoring.
9Albania, Armenia, Azerbaijan, Belarus, Bosnia, Bulgaria, Croatia, Czech Republic, Estonia,
Georgia, Hungary, Kazakhstan, Kyrgyzstan, Latvia, Lithuania, Macedonia, Moldova, Poland, Ro-mania, Russia, Slovakia, Slovenia, Tajikistan, Ukraine, Uzbekistan, Yugoslavia.
10The initial data set is composed from 6367 firms. We dropped first 511 Turkish firms. We also
dropped 1225 firms which were not loan applicants. Finally, 10 officials do not answer if they have obtained a loan recently or not.
11Results are not reported but available upon request.
12Differences also occur for family firms: it is apparently easier for a family firm in non-CIS
countries to obtain a loan than in CIS countries. In both cases, expectations to have a soft loan is identical to the base group.
13Remember that [1] means that the manager expects that the bank will do nothing if the firm
falls behind in its bank repayment and [2] the bank will extend the term of the loan. We also conclude that managers of firms which were in financial distress in 2001 and who obtain a loan are not more likely to believe that the bank will not engage legal proceedings. In fact, this change in the results occurs because, when we also consider that Sof t = 1 when managers answer [3], the percentage of firms for which Sof t = 1 that are in financial trouble is largely reduced. If we consider that Sof t = 1 when managers answer [1] and [2], 8.8% of these firms were in trouble in 2001. If we consider that Sof t = 1 when managers answer [1], [2] and [3], 6.6% of these firms were in trouble in 2001 (89/1340). This difference of 2.2 points is due to the fact that only 4.5% of the 663 firms answering [3] were in financial difficulties in 2001.
References
Aghion, P., Blanchard, O. (1994). On the Speed of Transition in Central Europe,
NBER Macroeconomics Annual, MIT Press, Cambridge, 283-320.
Anderson, J.H., Korsum, G., & Murrell, P. (2000). Which Enterprises (Believe They) Have Soft Budgets? Evidence on the Effects of Ownership and Decen-tralization in Mongolia. Journal of Comparative Economics, 28(2), 219-246. Berglof, E., Roland, G. (1998). Soft Budget Constraints and Banking in Transition
Economies. Journal of Comparative Economics, 26(1), 18-40.
Bertero, E., Rondi, L. (2000). Financial Pressure and the Behaviour of Public Enterprises under Soft and Hard Budget Constraints: Evidence from Italian Panel Data. Journal of Public Economics, 75(1), 73-98.
Bonin, J.P., Schaffer, M. (1995). Banks, Firms, Bad Debts and Bankruptcy in Hungary 1991-94. CEPR Discussion Paper 234.
Boyes, W.J., Hoffman, D.L., & Low, S.A. (1989). An Econometric Analysis of the Bank Credit Scoring Problem. Journal of Econometrics, 40(1), 3-14.
Brana, S., Maurel, M., & Sgard, J. (1999). Enterprise Adjustment and the Role of Band Credit in Russia: Evidence from a Qualitative Survey. Comparative
Economic Studies, 41(4), 47-69.
Coricelli, F., Djankov, S. (2001). Hardened Budgets and Enterprise Restructuring: Theory and Application to Romania. Journal of Comparative Economics, 29(4), 749-763.
Dewatripont, M., Maskin, E. (1995). Credit and Efficiency in Centralized and Decentralized Economies. The Review of Economic Studies, 62(4), 541-555. Dewatripont, M., Roland, G. (2000). Soft Budget Constraints, Transition and
Financial Systems. Journal of Institutional and Theoretical Economics, 156, 245-260.
Djankov S., Murrell P., (2002). Enterprise Restructuring in Transition: A Quanti-tative Survey. Journal of Economic Literature, 40(3), 739-792.
Greene, W.H. (1992). A Statistical Model for Credit Scoring. WP EC 92-29, New York University, Department of Economics, Stern School of Business.
Greene, W.H. (2000). Econometric Analysis, Fourth edition, Prentice Hall, New Jersey.
Hellman, J.S., Kaufmann, D. (2002). The Inequality of Influence. Social Science Research Network, http://ssrn.com/abstract=386901.
Hirschler, R. (2000). Ten Years Transition: Recalling the Events of a Historic Decade with World Bank Chief Economist Nicholas Stern. Beyond Transition, 11.
Huang, H., Xu, C. (1998). Financial Institutions and the Financial Crises in the East Asia. The European Economic Review, 43(4/6), 903-914.
Kornai, J. (1979). Resource-Constrained Versus Demand-Constrained Systems.
Kornai, J. (1998a). Legal Obligation, Non-Compliance and Soft Budget Constraint. In Newman, P. (ed.). The New Palgrave: Dictionary of Economics and the
Law, London, Macmillan, 533-539.
Kornai, J. (2001). Hardening the Budget Constraint: The Experience of the Post-Socialist Countries. European Economic Review 45(9), 1573-1599.
Kornai, J., Maskin E. & Roland G. (2003). Understanding the Budget Constraint.
Journal of Economic Litterature, 41(4), 1095-1136.
Li, D.D., Liang, M. (1998). Causes of the Soft Budget Constraint: Evidence on Three Explanations. Journal of Comparative Economics, 26(1), 104-116. MEMRB Custom Research Worldwide (2002). The Business Environment and
En-terprise Performance Survey-2002: A Brief Report on Observations, Experi-ences and Methodology from the Survey. EBRD-World Bank BEEPs Dataset, http://www.ebrd.com/pubs/econo/beepsr02.pdf.
Pinto, B., Belka, M., & Krajewski S. (1993). Transforming State Enterprises in Poland: Evidence on Adjustment By Manufacturing Firms. Brookings Papers
on Economic Activity, 1, 213-269.
Qian, Y., Roland, G. (1998). Federalism and the Soft Budget Constraint. The
American Economic Review, 88(5), 1143-1162.
Schaffer, M. (1998). Do Firms in Transition Have Soft Budget Constraints? A Re-consideration of Concepts and Evidence. Journal of Comparative Economics, 26(1), 80-103.
Van de Ven, W.P.M.M., Van Praag, B.M.S. (1981). The Demand for Deductibles in Private Health Insurance: A Probit Model with Sample Selection. Journal
Table 1: Descriptive statistics of the main variables of the sample
Original sample Used sample Both samples Firm’s characteristics Obs Mean Std. dev. Obs Mean Std. dev. Min Max The firm recently got a loan 4621 0.512 0.499 3531 0.489 0.499 0 1 Unprofitable in 2001 4388 0.061 0.239 3531 0.060 0.238 0 1 Largest shareholder Individual 4631 0.514 0.499 3531 0.510 0.499 0 1 Family 4631 0.065 0.248 3531 0.067 0.250 0 1 Domestic company 4631 0.073 0.259 3531 0.073 0.260 0 1 Foreign company 4631 0.095 0.294 3531 0.096 0.295 0 1 Manager of the firm 4631 0.030 0.172 3531 0.029 0.169 0 1 Employees of the firm 4631 0.036 0.186 3531 0.037 0.189 0 1 Government 4631 0.123 0.329 3531 0.128 0.334 0 1 Others 4631 0.060 0.238 3531 0.058 0.232 0 1
Firm’s size
Less than 49 employees 4631 0.669 0.470 3531 0.664 0.472 0 1 Between 50 - 249 employees 4631 0.186 0.389 3531 0.186 0.389 0 1 More than 250 employees 4631 0.144 0.351 3531 0.149 0.356 0 1
Market power Monopoly 4542 0.013 0.113 3531 0.013 0.113 0 1 1-3 competitors 4542 0.163 0.369 3531 0.166 0.372 0 1 4 or more competitors 4542 0.823 0.380 3531 0.820 0.383 0 1 Customers Sales to government 4631 10.269 23.68 3531 10.820 24.37 0 100 Sales to multinationals 4631 4.024 13.77 3531 4.18 14.14 0 100 Manager’s characteristics 1
Expect to be bailed out by the bank 2025 0.412 0.492 1676 0.405 0.490 0 1 Loan’s characteristics
collateral 2368 0.806 .385 1676 0.815 0.378 0 1
Financing Source
Local private bank 4631 0.100 0.300 3531 0.096 0.293 0 1 State bank 4631 0.056 .230 3531 0.052 0.221 0 1 Foreign bank 4631 0.024 .154 3531 0.024 0.153 0 1
>From family and friends 4631 0.073 .260 3531 0.070 0.255 0 1
Government 4631 0.017 .130 3531 0.015 0.121 0 1 Exclusion variables
External auditor 4513 0.491 0.499 3531 0.491 0.499 0 1 International accounting standards 4237 0.397 0.489 3531 0.385 0.486 0 1 Training 4584 0.525 0.499 3531 0.525 0.499 0 1
Table 2: Enterprise officials were asked the following question: If your firm were to fall behind in its bank repayments, which of the following would best describe how you would expect the bank to react? - Total sample
Total sample Used sample Number Percent Number Percent
[1] Do nothing 106 5.23 84 5.01
[2] Extend the term of the loan without changing the condition 729 36.00 593 35.42 [3] Extend the term of the loan but increase the interest rate 800 39.51 663 39.54 [4] Begin legal proceedings to take possession possession of assets 390 19.26 336 20.03
Total 2,025 100.00 1676 100
Table 3: Bivariate censored probit estimates
[A] [B]
Soft Loan Soft Loan Main Shareholder
Individual 0.041 -0.018 0.040 0.021 Family -0.15 0.25** -0.16 0.23** Domestic company -0.14 0.32*** -0.16 0.35*** Foreign company Base group Base group Managers -0.016 -0.05 -0.011 0.04 Employees 0.21 0.078 0.21 0.20 Government 0.12 -0.22*** 0.11 -0.17** Others 0.11 0.064 0.09 0.04 Firm’s size Employees<50 -0.02 -0.42*** -0.014 -0.46*** 50≤Employees<250 Base group Base group Employees≥250 -0.12 0.24*** -0.13 0.21*** Market power
Monopoly -0.12 -0.15 -0.12 -0.17** 1-3 competitors Base group Base group 4 or more competitors 0.009 -0.049 0.007 -0.05 Customers Sales to government -0.001 -0.002 -0.001 -0.0006 Sales to multinationals -0.003 0.002 -0.003 0.001 Loan’s characteristics Collateral -0.27*** -0.23** Financing source
Local private bank 0.11 0.11
State bank 0.03 -0.01 Foreign bank 0.009 0.016 >From family-friends -0.21 -0.18 Government -0.38 -0.39 Unprofitable in 2001 0.30** -0.001 0.31* -0.08 External audit 0.17** 0.14** Training 0.36*** 0.30*** IAS 0.08 0.12*
Manager education dummies Yes Yes Yes Yes Manager age dummies Yes Yes Yes Yes Sector dummies Yes Yes Yes Yes
Macro dummies No No Yes Yes
ρ -0.49† -0.53†
χ2(1) 2.26 2.44
N 3531 3531
N censored 1855 1855
Log likelihood -3278.33 -3217.76 Notes: † , ∗, ∗∗ and ∗ ∗ ∗ represent 10, 5 and 1% significance, respectively. Standard errors are clustered by country in the three specifications.
Table 4: Some marginal effects of change in X for the probability to obtain a loan ∂P rob[Loan=1|X]∂X
[A] [B] dP rob[Loan=1|X] dX Std. Err. dP rob[Loan=1|X] dX Std. Err. Main Shareholder Individual -0.007 0.023 0.008 0.024 Family 0.099** 0.045 0.094** 0.041 Domestic company 0.130*** 0.032 0.139*** 0.033
Foreign company Base group Base group
Managers -0.02 0.081 0.015 0.082 Employees 0.031 0.051 0.081* 0.042 Government -0.086*** 0.028 -0.068** 0.029 Others 0.025 0.056 0.018 0.046 Firm’s size Employees<50 -0.168*** 0.020 -0.18*** 0.016
50 ≤Employees< 250 Base group Base group
Employees≥250 0.096*** 0.022 0.086*** 0.020
Market power
Monopoly -0.06* 0.032 -0.07** 0.032
1-3 competitors Base group Base group
4 or more competitors -0.009 0.023 -0.020 0.022
Unprofitable in 2001 -0.004 0.054 -0.003 0.04
Notes: †, *, ** and *** represent 10, 5 and 1% significance, respectively. The estimators are marginal effects at the means values. The estimators presented in column [A] are associated with the selection equation (Loan) of the bivariate probit with censoring presented in column [A] of table 3. Column [B] is likewise.
Table 5: Some marginal effects of change in X for the probability of expecting to have a soft loan given that the firm has obtained a loan: ∂P rob[Sof t|Loan=1,X]∂X
[A] [B] dP rob[Sof t|Loan=1,X] dX Std. Err. dP rob[Sof t|Loan=1,X] dX Std. Err. Main Shareholder Individual 0.015 0.031 0.020 0.032 Family -0.032 0.060 -0.034 0.061 Domestic company -0.017 0.045 -0.016 0.046
Foreign company Base group Base group
Managers -0.014 0.076 0.001 0.080 Employees 0.103 0.072 0.123* 0.067 Government 0.019 0.066 0.022 0.066 Others 0.055 0.049 0.047 0.054 Firm’s size Employees<50 -0.066** 0.0329 -0.075** 0.031
50 ≤Employees< 250 Base group Base group
Employees≥250 -0.021 0.0323 -0.021 0.033
Market power
Monopoly -0.071 0.108 -0.079 0.104
1-3 competitors Base group Base group
4 or more competitors 0.0005 0.03 -0.004 0.032
Loan’s characteristics
Collateral -0.112*** 0.032 -0.097*** 0.032
Unprofitable in 2001 0.131** 0.052 0.122* 0.064
Notes: †, *, ** and *** represent 10, 5 and 1% significance, respectively. The estimators are marginal effects at the means values. The estimators presented in column [A] are associated with the bivariate probit with censoring presented in column [A] of table 3. Column [B] is likewise.
Table 6: Some marginal effects of change in X for the probability to have a soft loan: ∂P rob[Sof t=1,Loan=1]∂X
[A] [B] dP rob[Sof t,Loan=1] dX Std. Err. dP rob[Sof t,Loan=1] dX Std. Err. Main Shareholder Individual 0.004 0.0176 0.013 0.018 Family 0.02 0.035 0.016 0.036 Domestic company 0.039 0.027 0.043 0.030
Foreign company Base group Base group
Managers -0.014 0.05 0.006 0.052 Employees 0.064 0.046 0.098*** 0.037 Government -0.025 0.025 -0.016 0.024 Others 0.037 0.03 0.03 0.029 Firm’s size Employees<50 -0.10*** 0.014 -0.109*** 0.013
<=Employees<250 Base group Base group
Employees>=250 0.025 0.02 0.021 0.020
Market power
Monopoly -0.053 0.042 -0.058† 0.04
1-3 competitors Base group Base group
4 or more competitors -0.003 0.015 -0.009 0.017
Loan’s characteristics
Collateral -0.053*** 0.018 -0.047*** 0.017
Unprofitable in 2001 0.062** 0.028 0.041† 0.028
Notes: †, *, ** and *** represent 15, 10, 5 and 1% significance, respectively. The estimators are marginal effects at the mean values. The estimators presented in column [A] are associated with the bivariate probit with censoring presented in column [A] of table 3. Column [B] is likewise.

![Table 4: Some marginal effects of change in X for the probability to obtain a loan ∂P rob[Loan=1|X]](https://thumb-eu.123doks.com/thumbv2/123doknet/13078061.384618/32.892.148.698.420.843/table-marginal-effects-change-probability-obtain-loan-loan.webp)
![Table 5: Some marginal effects of change in X for the probability of expecting to have a soft loan given that the firm has obtained a loan: ∂P rob[Sof t|Loan=1,X]](https://thumb-eu.123doks.com/thumbv2/123doknet/13078061.384618/33.892.220.770.394.872/table-marginal-effects-change-probability-expecting-given-obtained.webp)
![Table 6: Some marginal effects of change in X for the probability to have a soft loan: ∂P rob[Sof t=1,Loan=1]](https://thumb-eu.123doks.com/thumbv2/123doknet/13078061.384618/34.892.138.749.397.874/table-marginal-effects-change-probability-soft-loan-loan.webp)
