HAL Id: hal-02944249
https://hal.archives-ouvertes.fr/hal-02944249
Submitted on 26 Nov 2020
HAL is a multi-disciplinary open access
archive for the deposit and dissemination of
sci-entific research documents, whether they are
pub-lished or not. The documents may come from
teaching and research institutions in France or
abroad, or from public or private research centers.
L’archive ouverte pluridisciplinaire HAL, est
destinée au dépôt et à la diffusion de documents
scientifiques de niveau recherche, publiés ou non,
émanant des établissements d’enseignement et de
recherche français ou étrangers, des laboratoires
publics ou privés.
Natalia Rubanova, Guillaume Pinna, Jeremie Kropp, Anna Campalans, Juan
Pablo Radicella, Anna Polesskaya, Annick Harel-Bellan, Nadya Morozova
To cite this version:
Natalia Rubanova, Guillaume Pinna, Jeremie Kropp, Anna Campalans, Juan Pablo Radicella, et al..
MasterPATH: network analysis of functional genomics screening data. BMC genomics, 2020, 21 (1),
pp.632. �10.1186/s12864-020-07047-2�. �hal-02944249�
M E T H O D O L O G Y A R T I C L E
Open Access
MasterPATH: network analysis of functional
genomics screening data
Natalia Rubanova
1,2,3*, Guillaume Pinna
4, Jeremie Kropp
1, Anna Campalans
5,6,7, Juan Pablo Radicella
5,6,7,
Anna Polesskaya
8, Annick Harel-Bellan
1and Nadya Morozova
1,4Abstract
Background: Functional genomics employs several experimental approaches to investigate gene functions. High-throughput techniques, such as loss-of-function screening and transcriptome profiling, allow to identify lists of genes potentially involved in biological processes of interest (so called hit list). Several computational methods exist to analyze and interpret such lists, the most widespread of which aim either at investigating of significantly
enriched biological processes, or at extracting significantly represented subnetworks.
Results: Here we propose a novel network analysis method and corresponding computational software that employs the shortest path approach and centrality measure to discover members of molecular pathways leading to the studied phenotype, based on functional genomics screening data. The method works on integrated
interactomes that consist of both directed and undirected networks– HIPPIE, SIGNOR, SignaLink, TFactS, KEGG, TransmiR, miRTarBase. The method finds nodes and short simple paths with significant high centrality in subnetworks induced by the hit genes and by so-called final implementers– the genes that are involved in molecular events responsible for final phenotypic realization of the biological processes of interest. We present the application of the method to the data from miRNA loss-of-function screen and transcriptome profiling of terminal human muscle differentiation process and to the gene loss-of-function screen exploring the genes that regulates human oxidative DNA damage recognition. The analysis highlighted the possible role of several known myogenesis regulatory miRNAs (miR-1, miR-125b, miR-216a) and their targets (AR, NR3C1, ARRB1, ITSN1, VAV3, TDGF1), as well as linked two major regulatory molecules of skeletal myogenesis, MYOD and SMAD3, to their previously known muscle-related targets (TGFB1, CDC42, CTCF) and also to a number of proteins such as C-KIT that have not been previously studied in the context of muscle differentiation. The analysis also showed the role of the interaction between H3 and SETDB1 proteins for oxidative DNA damage recognition.
Conclusion: The current work provides a systematic methodology to discover members of molecular pathways in integrated networks using functional genomics screening data. It also offers a valuable instrument to explain the appearance of a set of genes, previously not associated with the process of interest, in the hit list of each particular functional genomics screening.
Keywords: Network analysis, Molecular pathway, Centrality, Loss-of-function screening, Muscle differentiation, DNA repair
© The Author(s). 2020 Open Access This article is licensed under a Creative Commons Attribution 4.0 International License, which permits use, sharing, adaptation, distribution and reproduction in any medium or format, as long as you give appropriate credit to the original author(s) and the source, provide a link to the Creative Commons licence, and indicate if changes were made. The images or other third party material in this article are included in the article's Creative Commons licence, unless indicated otherwise in a credit line to the material. If material is not included in the article's Creative Commons licence and your intended use is not permitted by statutory regulation or exceeds the permitted use, you will need to obtain permission directly from the copyright holder. To view a copy of this licence, visithttp://creativecommons.org/licenses/by/4.0/. The Creative Commons Public Domain Dedication waiver (http://creativecommons.org/publicdomain/zero/1.0/) applies to the data made available in this article, unless otherwise stated in a credit line to the data.
* Correspondence:nrubanova@ihes.fr
1Institut des Hautes Etudes Scientifiques, Le Bois-Marie 35 rte de Chartres, 91440 Bures-sur-Yvette, France
2Université Paris Diderot, Paris, France
Background
Functional genomics employs diverse experimental ap-proaches to investigate gene functions. High-throughput techniques, such as loss-of-function screening and transcrip-tome profiling, allow the identification of specific sets of genes involved in biological processes of interest (so called hit list of genes). Genome-wide loss-of-function screenings exploit gene knock-down or knock-out at the scale of whole genomes. In the context of such screens, RNA interference [1–6], or CRISPR [7–9] libraries are systematically tested in cell-based assays specific to biological function of interest leading to the identification of the regulator genes [10]. Tran-scriptome profiling aims at profiling mRNA expression levels, e. g. in 2 or more conditions, and at identifying those genes that are up or down regulated. The most widespread techniques for transcriptome profiling are DNA microarrays and RNA-seq techniques [11,12].
Numerous computational methods for interpretation of functional genomics data sets, inferring molecular machinery underlying a given biological process, have been developed in the past decade, and can be roughly grouped into two categories. The first category encom-passes pathways analysis methods, aiming at searching for statistical enrichment of genes with annotated bio-logical process or molecular functions. The classical rep-resentatives of the pathways analysis methods are Over Representation Analysis (ORA) methods, which use a statistical test to assess the enrichment of a list of genes in an annotated biological process, molecular function or canonical pathway. The most commonly used statis-tical tests are based on the hypergeometric, Fisher’s exact, chi-square, or binomial tests [13]. Several im-provements of the standard ORA were developed, in-cluding functional class scoring approaches that aim at detecting coordinated changes in pathways [13] and topology-based approaches that consider pathway top-ology, connectivity and interactome information [14,15]. The second category is network analysis methods which use molecular interaction networks as a support-ing information [16]. Such methods can help to find functionally related biological components in a func-tional genomics data set. This can be achieved in several ways: by introducing network-based scoring methods using e. g. “guilt by association” principle and informa-tion from both network topology and screening results [17]; by introducing the use of the connectivity of sub-graphs of protein-protein interaction networks [18]; by using network neighbor information [19]; by performing functional analysis that relies on assessing the clustering of selected nodes on the network [20]; by extracting the largest connected component of a subnetwork that is created from the optimal number of the top-ranked genes [21]. Another way to use molecular interaction networks is to find significantly enriched subnetworks
within a functional genomics data set. Even manual in-vestigation of such subnetworks can give biologically meaningful results [22, 23]. The molecular interactions networks can be integrated with other types of biological information to achieve higher network specificity: with canonical pathways [24,25]; with different types of regu-latory interactions [25–27]. Moreover, subnetworks can be analyzed for finding functional modules [28,29].
Here we present a novel network analysis method to analyze functional genomics data sets. The method uses the results of functional screening data to elucidate members of molecular pathways that contribute to the studied phenotype. In contrast to other network analysis methods that work on the level of subnetworks, our method searches for short paths and separate nodes spe-cific to a biological system. Moreover, it shows how hit genes can be associated with these specific paths and nodes. The method works on an integrated interactome (network of molecular interactions) of an organism under investigation. The main theoretical assumption underlying the algorithm is that an observed phenotypic effect of a gene knockdown/knockout, measured as a read-out of a loss-of-function screen, is a sum of the ef-fects of the gene silencing on all molecular pathways in-fluencing the realization of the phenotypic effect. This hypothesis explains the appearance in the hit list of each particular loss-of-function screen of a set of genes, previ-ously not associated with the process under investiga-tion, because a knockdown of each of these genes can trigger several particular molecular pathways, specific for this biological system. On the other hand, the method, built based on this hypothesis, is able to determine a set of the most important pathways in a particular biological system, using the list of hit genes from a genome-wide loss-of-function screen.
According to this theory, the shortest paths from all hit genes to so called final implementers (the genes that are involved in molecular events responsible for final phenotypic realization) are built within the integrated in-teractome network, and the corresponding subnetwork is extracted.
Next, centrality scores for each node (respective each linear path) in the subnetwork are calculated as the number of the shortest paths that pass through the node (respective the number of the shortest paths for which linear paths are subpaths). Then, the statistical signifi-cance of each centrality score is assessed by comparing it with centrality scores in subnetworks built from the shortest paths for randomly generated hit lists preserving the degree distribution of the initial hit list. We hypothesize that the nodes and the linear paths with sta-tistically significant centrality score can be considered as putative members of active molecular pathways leading to the studied phenotype.
The method works with the shortest paths approach to find connections between hit genes and final imple-menters. It can be expected that this approach can yield incomplete molecular paths especially if biologically meaningful molecular paths are long since current inter-actomes are known to be incomplete and contain false-positive interactions. In this case, high centrality scores will highlight those segments (nodes and linear paths) that are parts of many shortest paths between different pairs of the hit genes and the final implementers which increases the likelihood that particular segment is spe-cific to the studied phenotype.
Additionally, we demonstrate that being initially created for the analysis of loss-of-function screening results, the method can be well applied for analysis of the results ob-tained by other high-throughput approaches such as tran-scriptome profiling. Although, it should be noted that the main drawback of the transcriptome profiling is that this technique does not discriminate the mRNAs that are causal and consequential to the phenotype. Also, we show that if the current knowledge cannot provide the list of final implementers of the process investigated by screen-ing, the program can use a list of hit genes as a list of final implementers, and that putative molecular pathways ob-tained by this way have good confidence.
We illustrate the application of the method to the ana-lysis of the results of loss-of-function screening and transcriptome profiling of terminal muscle differenti-ation, and of the results of loss-of-function screening of a DNA repair process.
Results
MiRNA loss-of-function screen and transcriptome profiling of human muscle differentiation process
The screening data from the study by A. Polesskaya et al. [30] was taken as the hit list for terminal human skeletal muscle differentiation process. In this study, genome-wide miRNA loss-of-function screening on a late differentiating human muscle precursor cell line (LHCN) was performed in a two-step approach. The pri-mary screening was done in duplicate with a miRNA antisense inhibitors (Locked Nucleic Acids, LNA) library targeting 870 miRNAs and a readout assay that detects Myosin Heavy Chain (MHC) positive and multinucle-ated myotubes. Those miRNAs whose depletion resulted in differences to the negative control ≥2 standard devi-ation (SD) were selected for confirmdevi-ation in the second-ary screen. A total of 63 miRNAs (Table S1) whose depletion resulted in differences to the negative control ≥2 SD were confirmed in the secondary screen.
The transcriptome profiling data from the study by J. Kropp et al. [31] was taken as the second hit list for ter-minal human muscle differentiation process. Transcrip-tome profiling for proliferation and late differentiation
stages in LHCN cell line was performed using Affymetrix Human Gene 1.1 ST arrays [31]. A total of 571 genes (Table S2) were found to be differentially expressed genes with at least 2-fold change between late differentiation and proliferation stage.
As a list of final implementers of the process of human muscle differentiation were taken the proteins respon-sible for activation, inhibition, facilitating of fusion of myotubes and for the maturation of muscle fibers. Namely, we have selected two major regulatory cyto-kines that control the muscle size in vivo and in vitro (MSTN and IGF2), three key cytoskeletal proteins that form the contractile apparatus (ACTA1, MYH1, MYLP F), and six plasma membrane-associated proteins (ARF6, CD81, CD9, CDC42, EHD2, MYOF) that have been shown to control the skeletal muscle fusion by a number of different mechanisms [32–39]. Taken together, these final implementers represent key molecular mechanisms of terminal muscle differentiation.
We found 2609 shortest paths of 4 types of length (from 2 to 5 interactions) from each miRNA in the hit list from loss-of-function screening to each protein in the list of final implementers. The subnetwork constructed from these paths consists of 1063 nodes (384 of which are genes) and 2710 edges without duplicated edges. The centrality score and the p-value were calculated for each node and path in the subnetwork according the procedure described in the Methods section. 521 paths of length of 3 to 4 interactions, with centrality score≥ 3 and 519 nodes with centrality score≥ 3 were found at the false discovery rate (FDR) of 0.25. Analysis of the paths with high centrality scores had highlighted a possible role for a number of nuclear recep-tors (AR, NR3C1) in skeletal muscle differentiation, as well as suggested functions in myogenesis for such proteins as arrestin (ARRB1 and 2), intersectin (ITSN1), the Rho GTP exchange factor VAV3, and the teratocarcinoma-derived growth factor (TDGF1). Interestingly, while the IGF1 regu-latory role in myogenesis is very well studied, our approach allowed us to include the arrestin proteins in these path-ways, and thus to elaborate the known IGF1 network in skeletal muscle differentiation. The MEF2D, p300, CCND1 functions in differentiation have been abundantly demon-strated, and their presence among the results serves as a proof of efficiency of the analysis.
We found 47,714 shortest paths of 4 types of length (from 1 to 5 interactions) from each gene in the hit list from transcriptome profiling to each protein in the list of final implementers. The subnetwork constructed from these paths consists of 2847 nodes and 13,032 edges without duplicated edges. The centrality score and the p-value were calculated for each node and each path in the subnetwork. 905 paths of length of 3 to 4 interac-tions and centrality score≥ 3 and 149 nodes with cen-trality score≥ 3 were found at the FDR of 0.25. There
are 12 miRNAs among these 149 nodes. Three of them (hsa-mir-125b, hsa-mir-133a, hsa-mir-145) are the hit miRNAs in the loss-of-function screen. Five miRNAs with the highest centrality score are mir-125b, hsa-mir-371, hsa-mir-216a, hsa-mir-1, has-mir-224. These miRNAs, except for hsa-mir-371, were shown to be in-volved in muscle differentiation and/or proliferation [40–43]. Moreover, almost half of the 12 miRNAs are known to participate in terminal muscle differentiation, and potential roles in myogenesis could be predicted for other miRNAs in this list because they regulate cellular proliferation (such as miR-132, miR-145 or miR-224), as well as cardiac hypertrophy (miR-378). Interestingly, the majority of these miRNAs were not found in the original loss-of-function screen, most likely due to the redun-dancy of miRNA family members. Indeed, as the miR-NAs of the same family share the seed sequence, an efficient loss-of-function screen should have contained not only individual miRNA inhibitors, but also the inac-tivators of whole miRNA families, in order to avoid false negative results. In this sense, our analysis of these data has been important in supplementing a group of miRNA targets that could have been overlooked. This possibility is highlighted by the presence of known myogenesis regulatory miRNAs (miR-1, miR-216a) in the list result-ing from the analysis, whereas they have not been picked up by the original experimental screen.
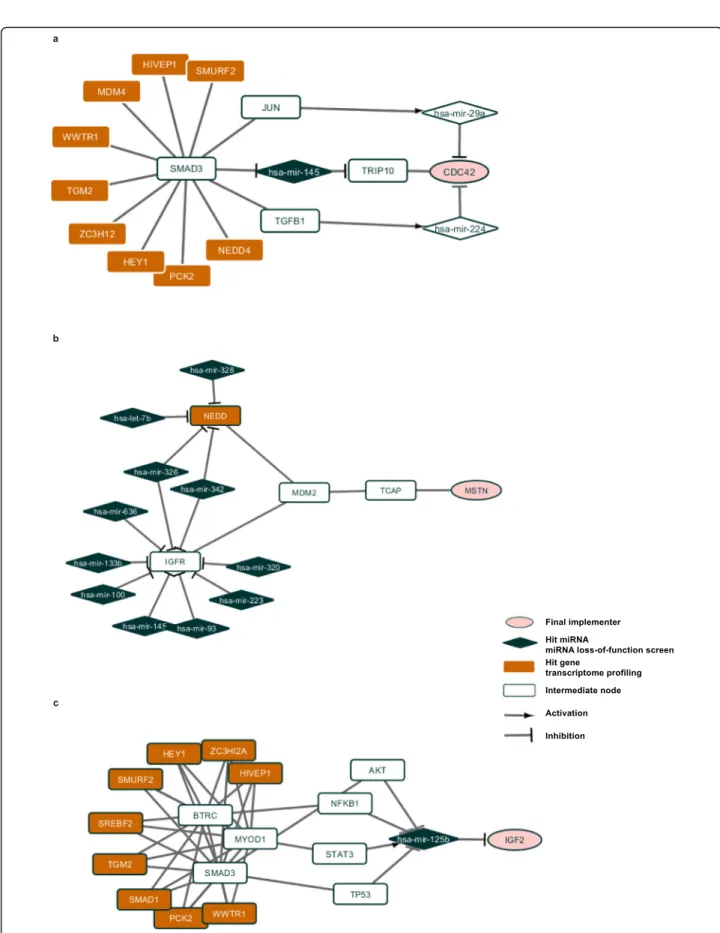
The analysis of paths allowed identification of poten-tially novel pathway in regulation of myogenesis, the clathrin-coated pathway regulatory protein AP2M1, and the EH-domain protein EHD2, which links the clathrin coated transport to actin cytoskeleton, and also binds to myoferlin, a factor promoting myotube fusion. Together with integrin subunits ITGA4 and ITGB1, the extracellu-lar matrix component fibronectin (FN1), and the protein chaperon HSP90, these proteins indicate a possible in-volvement of specific protein transport pathways in ter-minal myogenic differentiation. In addition, there is a possibility of involvement of beta-catenin (CTNNB1), C-KIT and PRKC in these processes. It should be noted that these three regulatory factors, while extensively studied in a multitude of biological models, have never been shown to be specifically implicated in skeletal myogenesis. Two major regulatory molecules of skeletal myogenesis, MYOD and SMAD3 (Fig.1 a, b), have been highlighted, together with their previously known muscle-related tar-gets (TGFB1, CDC42, CTCF). Also, they are linked to such proteins as C-KIT, that have not been previously studied in the context of muscle differentiation.
Next, we compared the lists of nodes and the lists of paths from two experiments. We found 37 nodes and 20 paths common for both loss-of-function screening and transcriptome profiling. Among the nodes with the high-est centrality score, two – IGF1R, E2F1 – have been
suggested to play key roles in the growth, development, and differentiation of skeletal muscle [44–46]. The path with the highest score consists of CDKN1A, MDM2, TCAP, MSTN proteins. The interaction between MDM2 and TCAP is known to be important for cardiac hyper-trophy [47], it was also shown that TCAP controls secre-tion of MSTN [48]. Our analysis shows that this path might be activated by the depletion of mir-17, hsa-mir-106a, hsa-mir-125a, hsa-mir-145, hsa-mir-93 (Fig.1c). It can also be noted that not only androgen receptor (AR), but also the estrogen receptor ESR1 can play a role in hu-man skeletal myogenesis. Interestingly, specific integrins (ITGB1) and adaptor proteins (CRKL) have also been found, confirming the importance of certain membrane/ adherence structures. Strikingly, both the receptor of acti-vated C kinase (RACK1), and the inhibitor of this kinase (YWHAB, a 14–3-3 protein), as well as multiple other protein-processing enzymes (casein kinase CSNK1A, acti-vator or protein secretion CHRM3) were found by the analysis, attracting the attention to the role of protein me-tabolism in myogenesis. It was also very interesting to see the chromosome breakpoint generation factor FRA11B among these potential novel factors that might impact on the differentiation of human myoblasts. This comparison has shown potentially novel paths originating from wellknown actors in muscle differentiation (such as IGF1R -RACK1 - CD81); and vice versa, has shown that previously unknown potential regulators of myogenesis, such as YWHAB or FRA11B, can act upon proteins that are well known to regulate myotube hypertrophy and/or fusion (IGF1R, CD81).
The fact that the comparison resulted only in a few number of paths might indicate, that although these ex-perimental systems study one biological process, they characterize the biological machinery at two different levels: transcriptional (transcriptome) and post-transcriptional (miRNAs).
We also found that 22 paths from the analysis of tran-scriptome profiling have miRNAs hits from the loss-of-function screening and 260 paths from the analysis of loss-of-function screening have hit genes from the tran-scriptome profiling on them. These are the paths from the analysis of transcriptome profiling that pass through hsa-mir-125b which controls IGF2 gene and the paths that pass through hsa-mir-145 that control TRIP10 pro-tein which, according to OMIM database, has highest expression in skeletal muscle [49] and interacts with CDC42 protein. Also, when analyzing these paths, one can notice the factors participating in at least three major cellular pathways, that, however, have not been extensively studied in skeletal muscle differentiation. These factors include beta-transduction repeat contain-ing protein (BTRC), which has a strong impact on both beta-catenin and NF-kappa B signaling, as well as the
Fig. 1 Subnetworks for human muscle differentiation process. Hit genes in miRNA loss-of-function screen are in dark blue, hit genes in transcriptome profiling are in orange, final implementers are in pink, intermediate genes and proteins are in white. a SMAD3-hsa-mir-145 subnetwork. b SMAD3, MYOD1 subnetwork. c MDM2-TCAP subnetwork
p53-related protein TP73, and, finally, the protein LRIG1 that has a strong negative effect on the expression of epidermal growth factor receptor. These pathways repre-sent promising new directions to follow in order to fur-ther understand the mechanics of skeletal myogenesis.
Gene loss-of-function screen to identify genes regulating human oxidative DNA damage recognition
OGG1 is a DNA glycosylase that initiates the repair of 8-oxoG, a major base modification induced by oxidative stress. The induction of 8-oxoG results in the recruitment of OGG1 and the subsequent enzymes of the Base Excision Re-pair (BER) pathway to chromatin to perform reRe-pair [50–52]. A“druggable” loss of function siRNA screening (only genes from druggable part of the genome were targeted), using 3 independent siRNAs per gene, was performed on genetically engineered HeLa cells that stably express OGG1-GFP fusion protein [53–55]. The intensity of chromatin-bound OGG1-GFP was measured after inducing DNA damage. 18 of the obtained hit genes (Table S3) for which inactivation led to an impairment of recruitment were selected for further analysis.
All 18 hit genes were used as a list of final implemen-ters, since little is known about the proteins involved in the recruitment of OGG1 to chromatin. The analysis was performed in the protein-protein human interactome.
We identified 4876 shortest protein-protein paths (from 1 to 4 interactions) going from each gene product in the hit list to each gene product in the list of final im-plementers. The subnetwork constructed from these paths consists of 381 nodes and 1764 edges without du-plicated edges. The centrality score and the p-value were calculated for each node and path in the subnetwork ac-cording to the procedure described in the Method sec-tion. 396 paths with centrality score 3 of length of 3 interactions and no nodes were found at the FDR of 0.25.
Although no nodes were found at the selected FDR, we ex-amined the full list of nodes to see whether nodes with high centrality were shown to be associated with DNA damage rec-ognition process. Indeed, among nodes with the highest cen-trality score are ten H3 proteins: HIST1H3A, HIST1H3B, HIST1H3C, HIST1H3D, HIST1H3E, HIST1H3F, HIST1H3G, HIST1H3H, HIST1H3I, HIST1H3J. It is known that DNA damage is associated with higher level of chromatin mobility [56–58] and it was shown recently that the increase in chromatin mobility is governed by the proteasome-mediated degradation of core histones [59]. Other proteins with high centrality score are SETDB1 – a member of the SET1 family of proteins; WDR5– a core component of SET1 family complexes [60]; TP53BP1– a binding partner of the tumour suppressor protein p53. SETDB1 and WDR5 are as-sociated with post-translational histone modifications which allow recruitment of the chromatin-associated proteins and
protein complexes [61,62]. TP53BP1 protein is known to be an important regulator of the cellular response to DNA double-strand breaks [63]. The reason why none of these nodes survived multiple testing by FDR can be explained by the specific choice of the hit list used in the analysis. This means that many genes important for this biological system (OGG1 driven human oxidative DNA damage recognition process) were not targeted in the screening, while they can be present in the randomly generated hit lists thus yielding higher centrality scores for these nodes and increasing their p-values. As it shown below, this does not prevent the paths that were found at the selected FDR to pass through some of these nodes.
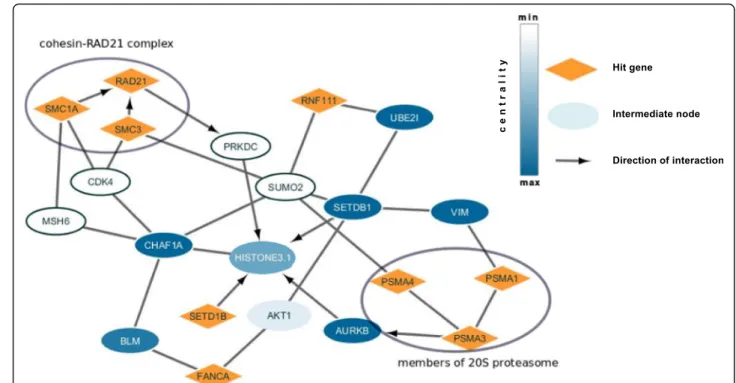
We examined the list of paths that were found at the se-lected FDR. Figure 2 presents a subnetwork visualized with Cytoscape software [64] for paths with centrality score 3. Figure 2 shows that the method identified two cohesin proteins SMC3 and SMC1A that interact with RAD21 protein to form cohesin-RAD21 complex [65], known to be enriched at DNA double-strand break sites and facilitating recombinational DNA repair [66]. It also shows possible mechanism of involvement of PSMA1, PSMA3, PSMA4 proteins, all members of the 20S prote-asome [67], through interaction with AURKB, Aurora Kinase B [68], which in turn interacts with histones H3 [69]. The path ends with histones H3 – SETDB1 inter-action. SETDB1 is a histone methyltransferase that specif-ically methylates histone H3 [61] and is also a member of the hit list. The arrows show the direction of the interac-tions inferred from literature. Considering them, histones H3 are the proteins where the signal from different mem-bers of the hit list converges and we hypothesize that his-tones H3 can be final implementers for this system.
Implementation
MasterPath is available as a docker container. The usage instructions are presented in the Supplementary note 1. The Java source code and full tables of the results pre-sented in the paper are available at the GitHub page
https://github.com/daggoo/masterPath.
Discussion
We used two different types of networks in our work. The first one was mixed directed and undirected network con-structed from PPI, transcriptional, post-transcriptional and metabolic data. The second network was undirected PPI network. PPI networks are the most common net-works used in network analysis, although they are known to be incomplete and biased towards the well-studied pro-teins. Incorporating transcriptional, post-transcriptional and metabolic data does not solve the issues associated with PPI networks, but adds information on direction, positive or negative effect of interactions and gives the ability to build heterogeneous paths.
The bias towards highly connected nodes or paths in the results that pass through highly connected nodes is controlled by generating random hit lists and performing multiple testing correction. As in Gene Set Enrichment Analysis [70], we used FDR threshold of 0.25 for pre-dicted paths and nodes. We consider it an appropriate FDR threshold for an exploratory analysis which aims at generating new hypothesis for further validation. Also, nodes (respective paths) with higher p-values can be considered. However, in this case, the value of a central-ity score and corresponding p-value can reflect not only specificity of a node (respective a path) for a biological process but can also be biased by high connectivity or incomplete hit gene list.
We used the following parameters for the analysis pre-sented in this work. For the integrated network: maximum path length to search for the shortest paths between hit genes and final implementers (Lmax, Methods section) was
5 interactions, the paths of length 3 to 4 interactions were examined, minimum centrality score was 3 for both paths and nodes. For the protein-protein interaction network: Lmax,was 4 interactions, the paths of length 2 to 3
interac-tions were examined, minimum centrality score was 3 for both paths and nodes. Lmax, was chosen to approximate
the average length of the shortest path in the networks (Table S4). We aimed at searching for the longest paths and considered paths one to two interactions shorter than Lmax. The use of the threshold for the centrality score of 3
can help to capture those situations when the hit list and
the list of final implementers contain a small subset of ele-ments that are connected only with each other in the net-work and thus cannot produce high centrality scores. It should be noted that these parameters can be changed based on the topology of the network in use.
Other important problems in network analysis are net-work specificity for the biological system of interest and lack of interaction information about certain members of a hit list. We used networks that represent global hu-man interactome with high-confidence experimentally validate interactions in our work. Nodes that are not present in a particular interactome (e. g. tissue specific interactome) can be excluded from the network, based e. g. on transcriptomic data, to create smaller but more specific networks. On the other hand, it is typical to have poorly studied hit genes in hit lists from functional screens that might not be present in the network. Low confidence or predicted interactions for such hit genes might be added to the network in this case, which is es-pecially important for interaction types other than protein-protein interactions.
Most of the protein-protein interactions in our global integrated network come from high confidence protein-protein interactions in HIPPIE database. HIPPIE con-tains interactions from widely used BioGRID [71], DIP [72], HPRD [73], IntAct [74], MINT [75] databases. All interactions in HIPPIE database have a confidence score which is calculated as a weighted sum of several parame-ters including number of studies in which an interaction
Fig. 2 Histones H3-SETDB1 subnetwork for oxidative DNA damage recognition screening. Hit genes are in orange, the intermediate proteins are in white or blue depending on the centrality score. Grey arrows show the direction of interactions that were taken from literature
was detected and the type of the experimental technique used to detect the interaction. The confidence score al-lows to filter out low confidence interactions. High con-fidence interactions from other databases (e. g. String [76]) or separate studies might be added to the network to improve network completeness and/or specificity for a particular biological system.
We introduced a notion of final implementer. We de-noted a final implementer as a molecule that is involved in events responsible for the development of the final realization of the phenotype in the biological process of interest. Modern molecular biology accumulated vast amount of knowledge and such molecules are known for some processes, e. g. caspase 3, caspase 6 and caspase 7 could be considered as final implementers for apoptosis. If these molecules are unknown, the members of the hit list can be used as a list of final implementers in the analysis on the PPI network. In this case, candidates for final imple-menters could be found by studying direction of the paths, as we demonstrated for human oxidative DNA damage rec-ognition process.
Conclusion
We presented a new exploratory network analysis method that employs the shortest path approach and centrality measure to uncover members of active molecular path-ways leading to a given phenotype, based on the results of functional screening. We illustrated the application of the method to the analysis of the results of transcriptome pro-filing and miRNA loss-of-function screening of human skeletal muscle differentiation process and of“druggable” loss-of-function screening of human DNA repair process.
Methods Databases
The human integrated interactome was constructed from 7 databases: Human Integrated Protein-Protein Interaction rEference (HIPPIE) [77], SIGNOR [78], Sig-naLink [79], TFactS [80], KEGG Metabolic Pathways [81], TransmiR [82], miRTarBase [83].
All databases contain experimentally validated interac-tions, except SignaLink database which contains a small number of predicted miRNA-mRNA interactions. We used only high confidence interactions from HIPPIE database. The confidence threshold was chosen accord-ing to HIPPIE documentation [84]. Since all the data-bases use different types of gene ID, we converted the ids to the HUGO gene nomenclature and used this no-menclature to construct human integrated network. SI-GNOR database contains some interactions that involve phenotypes, protein families and stimuli; however, we used only interactions between proteins, complexes and small molecules. Table 1summarizes the basic informa-tion about the databases. Table S4 summarizes
topological features of the integrated networks used in this work: integrated interactome constructed from all databases in Table1 and undirected proteprotein in-teractome constructed only from HIPPIE database in Table1.
Integrated interactome contains both directed and un-directed interactions. When the databases are merged to create the integrated network, duplicate interactions are removed. If there are both directed and undirected inter-action between any two nodes, only directed interinter-actions are kept in the integrated network (Fig.3a).
MasterPATH algorithm
The following notions are used in the mechanistic model of pathway construction. An unweighted graph G = (V, E) represents a network of molecular interactions. V are nodes that can be proteins, genes, small molecules or miRNAs. E are edges that represent molecular inter-action between the nodes. The interinter-actions can be di-rected or undidi-rected. The list of the hit genes is a subset of nodes H from V. The list of final implementers is a subset of nodes F from V. A simple linear path p in the graph G between a pair of nodes (v, u) is a sequence of edges that connect v and u: p(v, u) = (v, v1), (v1, v2) ... (vk,
u) where each vi∈ V and all viare distinct from one
an-other. Length L of the path p(v, u) is the number of edges in the path: p(v, u) = k + 1.
We distinguish 4 different types of paths:
1. protein-protein paths if all edges in the path represent protein-protein interactions;
2. transcriptional paths if there exist at least one edge in the path that represent transcriptional
interaction and all other edges represent protein-protein interactions;
3. miRNA paths if there exist at least one edge in the path that represent miRNA-mRNA interaction and all other edges represent either protein-protein or transcriptional interactions;
4. metabolic paths if there exist at least one edge in the path that represent enzymatic reaction and all other edges represent either protein-protein or transcriptional interactions or miRNA-mRNA interactions.
The algorithm of the method is the following (summa-rized in Fig.3b). For a given network G, hit list H, list of final implementers F the method finds for each pair of a hit gene and a final implementer (hi,fj) all the shortest
paths {pi} of four mentioned types of length less or equal
the maximum length Lmax (defined by the user) in the
network G. The search is done using breadth-first algo-rithm. The direction of the interactions but not the type of the interactions is taken into account during the
Table 1 Number of nodes, interactions and types of interactions in databases used to construct human integrated network. PPI: protein-protein interactions, TF: transcription factor
Database Nodes Interactions Types of nodes Types of interactions Direction of interactions HIPPIE (high confidence) 9368 41,520 proteins PPI undirected
SIGNOR 3977 13,129 proteins, complexes, small molecules PPI, enzymatic
directed, undirected SignaLink 3285 27,295 proteins, genes, miRNAs PPI,
miRNA-mRNA, TF-gene directed, undirected TFactS 2203 4312 TFs, genes TF-gene directed KEGG metabolic pathways 2921 8231 proteins,
small molecules
Enzymatic reactions directed TransmiR 324 647 TFs, miRNAs TF-miRNA directed miRTarBase 2269 3511 miRNAs, genes miRNA-mRNA directed
Fig. 3 a Undirected interactions are not included into the integrated network during merging of databases in case directed interactions exist between the same nodes. b Main steps of the MasterPath. Detailed description is presented in the Method section. c Direction of interactions is taken into account when paths are found using breadth-first algorithm. Only the first two paths will be considered between nodese and f by the method. It should be noted that the arrow represents here only the direction of the interaction but not the effect (e.g. activation or inhibition)
search (Fig. 3c). Then the centrality score is calculated for each node v as the number of the shortest paths {p} from all combinations of hit genes and final implemen-ters that pass through the node v: c(v) = | p ∈ {p}: v ∈ p |. The centrality score is calculated for each path q of length of several interactions as the number of the short-est paths {p} from all combinations of hit genes and final implementers for which q is a subpath: c(q) = | p ∈ {pi}: q
is a subpath of p |. Centrality score c(q) for path q is taken as 1 if all the paths that have q as a subpath are of the same type and between the same combination of a hit gene and a final implementer to discriminate paths that pass through highly connected nodes. After that, the statistical significance of the centrality scores is assessed. 10,000 random hit lists are sampled from the set of nodes in the network preserving or not preserving the degree distribution of the initial hit list. The prob-ability (p-valueNet) of getting a node v or a path q with specific centrality score by chance is calculated as a pro-portion of sampled hit lists for which a node or a short path has the same or greater centrality score. Next, p-valuesNet are adjusted for multiple testing using Benjamini-Hochberg procedure [85].
Supplementary information
Supplementary information accompanies this paper athttps://doi.org/10. 1186/s12864-020-07047-2.
Additional file 1: Supplementary note 1. Table S1. Hit genes for miRNA loss-of-function screen of human muscle differentiation process. Table S2. Hit genes for transcriptome profiling of human muscle differ-entiation process. Table S3. Hit genes for human oxidative DNA damage recognition loss-of-function screen. Table S4. Topological features of the integrated and PPI networks.
Abbreviations
FDR:False discovery rate; HIPPIE: Human integrated protein-protein inter-action reference database; HUGO: Human Genome Organisation; Id: Identifier; KEGG: Kyoto encyclopedia of genes and genomes; LHCN: Late differentiating human muscle precursor cell line; miRNA: microRNA; miRTarBase: database of microRNA - target interactions; mRNA: Messenger RNA; ORA: Over representation analysis; PPI: Protein–protein interaction; SIGNOR: Signaling network open resource database; siRNA: Small interfering RNA; TF: Transcription factor; TFactS: Transcription factor activity database; TransmiR: Database for transcription factor - microRNA regulations Acknowledgements
Not applicable. Authors’ contributions
NR developed the theory, performed computations, analyzed the results, and wrote the manuscript. GP contributed to the analysis of the results and to the final version of the manuscript. JK contributed to the analysis of the results of muscle differentiation screen. AC and JPR provided the results of “druggable” loss of function screen and contributed to the final version of the manuscript. AP provided the results of muscle differentiation screens and contributed to the final version of the manuscript. AHB contributed to the development of the theory and supervised the project. NM developed the theory, analyzed the results, wrote the manuscript, and supervised the project. All authors have read and approved the manuscript.
Funding
The work of Guillaume Pinna, Anna Campalans and Juan Pablo Radicella was supported by the“Fondation ARC pour la recherche sur le cancer” (PJ20151203141).
Availability of data and materials
The datasets generated during current study as well as the source code are available at the GitHub pagehttps://github.com/daggoo/masterPath. The datasets analyzed during current study are included in this published article’s supplementary information files and are available as a Supplementary File S1
in the reference publication [30],https://doi.org/10.1371/journal. pone.0071927.s004 and a Supplementary Table 1 in the reference publication [55],https://academic.oup.com/nar/advance-article/doi/10.1093/ nar/gkaa611/5876283#supplementary-data
Ethics approval and consent to participate Not applicable.
Consent for publication Not applicable. Competing interests
The authors declare that they have no competing interests. Author details
1
Institut des Hautes Etudes Scientifiques, Le Bois-Marie 35 rte de Chartres, 91440 Bures-sur-Yvette, France.2Université Paris Diderot, Paris, France. 3Skolkovo Institute of Science and Technology, Skolkovo, Russia.4Institute for Integrative Biology of the Cell (I2BC), CEA, CNRS, Univ. Paris-Sud, Université Paris-Saclay, 91198 Gif-sur-Yvette cedex, France.5Institute of Molecular and Cellular Radiobiology, Institut François Jacob, CEA, F-92265
Fontenay-aux-Roses, France.6INSERM, U967, bâtiment 56 PC 103 18 route du Panorama, BP6 92265 Fontenay-aux-Roses Cedex, France.7Université Paris Sud, U967, bâtiment 56 PC 103 18 route du Panorama, BP6 92265 Fontenay-aux-Roses Cedex, France.8Ecole Polytechnique, Université Paris-Saclay, CNRS UMR 7654, Laboratoire de Biochimie, Ecole Polytechnique, 91128 Palaiseau, France.
Received: 2 September 2019 Accepted: 1 September 2020 References
1. Sui G, Soohoo C, Affar EB, Gay F, Shi Y, Forrester WC, et al. A DNA vector-based RNAi technology to suppress gene expression in mammalian cells. Proc Natl Acad Sci. 2002;99:5515–20.https://doi.org/10.1073/pnas. 082117599.
2. Sen G, Wehrman TS, Myers JW, Blau HM. Restriction enzyme–generated siRNA (REGS) vectors and libraries. Nat Genet. 2004;36:183–9.https://doi.org/ 10.1038/ng1288.
3. Yu J-Y, DeRuiter SL, Turner DL. RNA interference by expression of short-interfering RNAs and hairpin RNAs in mammalian cells. Proc Natl Acad Sci. 2002;99:6047–52.https://doi.org/10.1073/pnas.092143499.
4. Chung N, Locco L, Huff KW, Bartz S, Linsley PS, Ferrer M, et al. An efficient and fully automated high-throughput transfection method for genome-scale siRNA screens. J Biomol Screen. 2008;13:142–8.https://doi.org/10.1177/ 1087057107312032.
5. Yang J-P, Fan W, Rogers C, Chatterton JE, Bliesath J, Liu G, et al. A novel RNAi library based on partially randomized consensus sequences of nuclear receptors: identifying the receptors involved in amyloidβ degradation. Genomics. 2006;88:282–92.https://doi.org/10.1016/j.ygeno.2006.03.010. 6. Hu G, Luo J. A primer on using pooled shRNA libraries for functional
genomic screens. Acta Biochim Biophys Sin. 2012;44:103–12.https://doi.org/ 10.1093/abbs/gmr116.
7. Shalem O, Sanjana NE, Zhang F. High-throughput functional genomics using CRISPR–Cas9. Nat Rev Genet. 2015;16:299–311.https://doi.org/10. 1038/nrg3899.
8. Wang T, Lander ES, Sabatini DM. Large-Scale Single Guide RNA Library Construction and Use for CRISPR–Cas9-Based Genetic Screens. Cold Spring Harb Protoc. 2016;2016:pdb.top086892.https://doi.org/10.1101/ pdb.top086892.
9. Wang T, Wei JJ, Sabatini DM, Lander ES. Genetic screens in human cells using the CRISPR-Cas9 system. Science. 2013;343:80–4.https://doi.org/10. 1126/science.1246981.
10. Mohr SE, Smith JA, Shamu CE, Neumüller RA, Perrimon N. RNAi screening comes of age: improved techniques and complementary approaches. Nat Rev Mol Cell Biol. 2014;15:591–600.https://doi.org/10.1038/nrm3860. 11. Lockhart DJ, Winzeler EA. Genomics, gene expression and DNA arrays.
Nature. 2000;405:827–36.https://doi.org/10.1038/35015701. 12. Lowe R, Shirley N, Bleackley M, Dolan S, Shafee T. Transcriptomics
technologies. PLoS Comput Biol. 2017;13:e1005457.https://doi.org/10.1371/ journal.pcbi.1005457.
13. Khatri P, Sirota M, Butte AJ. Ten years of pathway analysis: current approaches and outstanding challenges. PLoS Comput Biol. 2012;8: e1002375.https://doi.org/10.1371/journal.pcbi.1002375.
14. Bankhead A, Sach I, Ni C, LeMeur N, Kruger M, Ferrer M, et al. Knowledge based identification of essential signaling from genome-scale siRNA experiments. BMC Syst Biol. 2009;3.https://doi.org/10.1186/1752-0509-3-80. 15. Draghici S, Khatri P, Tarca AL, Amin K, Done A, Voichita C, et al. A systems
biology approach for pathway level analysis. Genome Res. 2007;17:1537–45.
https://doi.org/10.1101/gr.6202607.
16. Markowetz F. How to understand the cell by breaking it: network analysis of gene perturbation screens. PLoS Comput Biol. 2010;6:e1000655.https://doi. org/10.1371/journal.pcbi.1000655.
17. Wang L, Tu Z, Sun F. A network-based integrative approach to prioritize reliable hits from multiple genome-wide RNAi screens in drosophila. BMC Genomics. 2009;10:220.https://doi.org/10.1186/1471-2164-10-220. 18. Kaplow IM, Singh R, Friedman A, Bakal C, Perrimon N, Berger B. RNAiCut:
automated detection of significant genes from functional genomic screens. Nat Methods. 2009;6:476–7.https://doi.org/10.1038/nmeth0709-476. 19. Jiang P, Wang H, Li W, Zang C, Li B, Wong YJ, et al. Network analysis of
gene essentiality in functional genomics experiments. Genome Biol. 2015; 16.https://doi.org/10.1186/s13059-015-0808-9.
20. Cornish AJ, Markowetz F. SANTA: quantifying the functional content of molecular networks. PLoS Comput Biol. 2014;10:e1003808.https://doi.org/ 10.1371/journal.pcbi.1003808.
21. Kairov U, Karpenyuk T, Ramanculov E, Zinovyev A. Network analysis of gene lists for finding reproducible prognostic breast cancer gene signatures. Bioinformation. 2012;8:773–6.https://doi.org/10.6026/97320630008773. 22. Krishnan MN, Ng A, Sukumaran B, Gilfoy FD, Uchil PD, Sultana H, et al. RNA
interference screen for human genes associated with West Nile virus infection. Nature. 2008;455:242–5.https://doi.org/10.1038/nature07207. 23. Warner N, Burberry A, Pliakas M, McDonald C, Núñez G. A genome-wide
small interfering RNA (siRNA) screen reveals nuclear factor-κB (NF-κB)-independent regulators of NOD2-induced Interleukin-8 (IL-8) secretion. J Biol Chem. 2014;289:28213–24.https://doi.org/10.1074/jbc.m114.574756. 24. Tu Z, Argmann C, Wong KK, Mitnaul LJ, Edwards S, Sach IC, et al. Integrating siRNA
and protein-protein interaction data to identify an expanded insulin signaling network. Genome Res. 2009;19:1057–67.https://doi.org/10.1101/gr.087890.108. 25. Maeyer DD, Weytjens B, Renkens J, Raedt LD, Marchal K. PheNetic:
network-based interpretation of molecular profiling data. Nucleic Acids Res. 2015;43: W244–50.https://doi.org/10.1093/nar/gkv347.
26. Lan A, Smoly IY, Rapaport G, Lindquist S, Fraenkel E, Yeger-Lotem E. ResponseNet: revealing signaling and regulatory networks linking genetic and transcriptomic screening data. Nucleic Acids Res. 2011;39(suppl):W424– 9.https://doi.org/10.1093/nar/gkr359.
27. Nizard P, Ezan F, Bonnier D, Meur NL, Langouët S, Baffet G, et al. Integrative analysis of high-throughput RNAi screen data identifies the FER and CRKL tyrosine kinases as new regulators of the mitogenic ERK-dependent pathways in transformed cells. BMC Genomics. 2014;15:1169.https://doi.org/ 10.1186/1471-2164-15-1169.
28. Dittrich MT, Klau GW, Rosenwald A, Dandekar T, Muller T. Identifying functional modules in protein-protein interaction networks: an integrated exact approach. Bioinformatics. 2008;24:i223–31.https://doi.org/10.1093/ bioinformatics/btn161.
29. Mitra K, Carvunis A-R, Ramesh SK, Ideker T. Integrative approaches for finding modular structure in biological networks. Nat Rev Genet. 2013;14: 719–32.https://doi.org/10.1038/nrg3552.
30. Polesskaya A, Degerny C, Pinna G, Maury Y, Kratassiouk G, Mouly V, et al. Genome-wide exploration of miRNA function in mammalian muscle cell differentiation. PLoS One. 2013;8:e71927.https://doi.org/10.1371/journal. pone.0071927.
31. Kropp J, Degerny C, Morozova N, Pontis J, Harel-Bellan A, Polesskaya A. miR-98 delays skeletal muscle differentiation by down-regulating E2F5. Biochem J. 2015;466:85–93.https://doi.org/10.1042/bj20141175.
32. Lee S-J. Regulation of muscle mass by myostatin. Annu Rev Cell Dev Biol. 2004;20:61–86.https://doi.org/10.1146/annurev.cellbio.20.012103.135836. 33. Alzhanov DT, McInerney SF, Rotwein P. Long range interactions
RegulateIgf2Gene transcription during skeletal muscle differentiation. J Biol Chem. 2010;285:38969–77.https://doi.org/10.1074/jbc.m110.160986. 34. Gunning PW, Ferguson V, Brennan KJ, Hardeman EC. Alpha-skeletal actin
induces a subset of muscle genes independently of muscle differentiation and withdrawal from the cell cycle. J Cell Sci. 2001;114:513–24https://jcs. biologists.org/content/114/3/513.
35. Wang Y, Szczesna-Cordary D, Craig R, Diaz-Perez Z, Guzman G, Miller T, et al. Fast skeletal muscle regulatory light chain is required for fast and slow skeletal muscle development. FASEB J. 2007;21:2205–14.https://doi.org/10. 1096/fj.06-7538com.
36. Bourmoum M, Charles R, Claing A. The GTPase ARF6 controls ROS production to mediate angiotensin II-induced vascular smooth muscle cell proliferation. PLoS One. 2016;11:e0148097.https://doi.org/10.1371/journal.pone.0148097. 37. Tachibana I, Hemler ME. Role of Transmembrane 4 superfamily (Tm4sf)
proteins Cd9 and Cd81 in muscle cell fusion and Myotube maintenance. J Cell Biol. 1999;146:893–904.https://doi.org/10.1083/jcb.146.4.893.
38. Vasyutina E, Martarelli B, Brakebusch C, Wende H, Birchmeier C. The small G-proteins Rac1 and Cdc42 are essential for myoblast fusion in the mouse. Proc Natl Acad Sci. 2009;106:8935–40.https://doi.org/10.1073/pnas. 0902501106.
39. Doherty KR, Demonbreun AR, Wallace GQ, Cave A, Posey AD, Heretis K, et al. The Endocytic recycling protein EHD2 interacts with myoferlin to regulate myoblast fusion. J Biol Chem. 2008;283:20252–60.https://doi.org/ 10.1074/jbc.m802306200.
40. Callis TE, Chen J-F, Wang D-Z. MicroRNAs in skeletal and cardiac muscle development. DNA Cell Biol. 2007;26:219–25.https://doi.org/10.1089/dna. 2006.0556.
41. Winbanks CE, Wang B, Beyer C, Koh P, White L, Kantharidis P, et al. TGF-β regulates miR-206 and miR-29 to control myogenic differentiation through regulation of HDAC4. J Biol Chem. 2011;286:13805–14.https://doi.org/10. 1074/jbc.m110.192625.
42. Meyer SU, Thirion C, Polesskaya A, Bauersachs S, Kaiser S, Krause S, et al. TNF-α and IGF1 modify the microRNA signature in skeletal muscle cell differentiation. Cell Commun Signal. 2015;13:4.https://doi.org/10.1186/ s12964-015-0083-0.
43. Crist CG, Buckingham M. microRNAs gain magnitude in muscle. Cell Cycle. 2009;8:3627–8.https://doi.org/10.4161/cc.8.22.9960.
44. Fernández AM, Dupont J, Farrar RP, Lee S, Stannard B, Roith DL. Muscle-specific inactivation of the IGF-I receptor induces compensatory hyperplasia in skeletal muscle. J Clin Invest. 2002;109:347–55.https://doi.org/10.1172/jci13503. 45. Nakao R, Hirasaka K, Goto J, Ishidoh K, Yamada C, Ohno A, et al. Ubiquitin
ligase Cbl-b is a negative regulator for insulin-like growth factor 1 signaling during muscle atrophy caused by unloading. Mol Cell Biol. 2009;29:4798– 811.https://doi.org/10.1128/mcb.01347-08.
46. Zappia MP, Frolov MV. E2F function in muscle growth is necessary and sufficient for viability in drosophila. Nat Commun. 2016;7.https://doi.org/10. 1038/ncomms10509.
47. Tian L-F, Li H-Y, Jin B-F, Pan X, Man J-H, Zhang P-J, et al. MDM2 interacts with and downregulates a sarcomeric protein, TCAP. Biochem Biophys Res Commun. 2006;345:355–61.https://doi.org/10.1016/j.bbrc.2006.04.108. 48. Nicholas G, Thomas M, Langley B, Somers W, Patel K, Kemp CF, et al.
Titin-cap associates with, and regulates secretion of, Myostatin. J Cell Physiol. 2002;193:120–31.https://doi.org/10.1002/jcp.10158.
49. Online Mendelian Inheritance in Man, OMIM.https://omim.org/. Accessed July 2019.
50. Amouroux R, Campalans A, Epe B, Radicella JP. Oxidative stress triggers the preferential assembly of base excision repair complexes on open chromatin regions. Nucleic Acids Res. 2010;38:2878–90.https://doi.org/10.1093/nar/gkp1247. 51. Campalans A, Kortulewski T, Amouroux R, Menoni H, Vermeulen W,
Radicella JP. Distinct spatiotemporal patterns and PARP dependence of XRCC1 recruitment to single-strand break and base excision repair. Nucleic Acids Res. 2013;41:3115–29.https://doi.org/10.1093/nar/gkt025.
52. Campalans A, Moritz E, Kortulewski T, Biard D, Epe B, Radicella JP. Interaction with OGG1 is required for efficient recruitment of XRCC1 to base excision
repair and maintenance of genetic stability after exposure to oxidative stress. Mol Cell Biol. 2015;35:1648–58.https://doi.org/10.1128/mcb.00134-15. 53. Guyon L, Lajaunie C, Fer F, Bhajun R, Sulpice E, Pinna G, et al.Φ-score: A
cell-to-cell phenotypic scoring method for sensitive and selective hit discovery in cell-based assays; 2015. p. 5.https://doi.org/10.1038/srep14221. 54. Robinson S, Nevalainen J, Pinna G, Campalans A, Radicella JP, Guyon L.
Incorporating interaction networks into the determination of functionally related hit genes in genomic experiments with Markov random fields. Bioinformatics. 2017;33:i170–9.https://doi.org/10.1093/bioinformatics/btx244. 55. Lebraud E, Pinna G, Siberchicot C, Depagne J, Busso D, Fantini D, Irbah L,
Robeska E, Kratassiouk G, Ravanat J-L, Epe B, Radicella JP, Campalans A. Chromatin recruitment of OGG1 requires cohesin and mediator and is essential for efficient 8-oxoG removal. Nucleic Acids Res. gkaa611. doi:
https://doi.org/10.1093/nar/gkaa611.
56. Strzyz P. Histones have got to go. Nat Rev Mol Cell Biol. 2017;18:139.https:// doi.org/10.1038/nrm.2017.2.
57. Dion V, Kalck V, Horigome C, Towbin BD, Gasser SM. Increased mobility of double-strand breaks requires Mec1, Rad9 and the homologous recombination machinery. Nat Cell Biol. 2012;14:502–9.https://doi.org/10. 1038/ncb2465.
58. Miné-Hattab J, Rothstein R. Increased chromosome mobility facilitates homology search during recombination. Nat Cell Biol. 2012;14:510–7.
https://doi.org/10.1038/ncb2472.
59. Hauer MH, Seeber A, Singh V, Thierry R, Sack R, Amitai A, et al. Histone degradation in response to DNA damage enhances chromatin dynamics and recombination rates. Nat Struct Mol Biol. 2017;24:99–107.https://doi. org/10.1038/nsmb.3347.
60. Ruthenburg AJ, Wang W, Graybosch DM, Li H, Allis CD, Patel DJ, et al. Histone H3 recognition and presentation by the WDR5 module of the MLL1 complex. Nat Struct Mol Biol. 2006;13:704–12.https://doi.org/10.1038/nsmb1119. 61. Schultz DC, Ayyanathan K, Negorev D, Maul GG, Rauscher FJ. SETDB1: a novel
KAP-1-associated histone H3, lysine 9-specific methyltransferase that contributes to HP1-mediated silencing of euchromatic genes by KRAB zinc-finger proteins. Genes Dev. 2002;16:919–32.https://doi.org/10.1101/gad.973302.
62. Odho Z, Southall SM, Wilson JR. Characterization of a novel WDR5-binding site that recruits RbBP5 through a conserved motif to enhance methylation of histone H3 lysine 4 by mixed lineage leukemia Protein-1. J Biol Chem. 2010;285:32967–76.https://doi.org/10.1074/jbc.m110.159921.
63. Panier S, Boulton SJ. Double-strand break repair: 53BP1 comes into focus. Nat Rev Mol Cell Biol. 2013;15:7–18.https://doi.org/10.1038/nrm3719. 64. Shannon P, Markiel A, Ozier O, Baliga NS, Wang JT, Ramage D, et al. Cytoscape:
a software environment for integrated models of biomolecular interaction networks. Genome Res. 2003;13:2498–504.https://doi.org/10.1101/gr.1239303. 65. Losada A. Cohesin in cancer: chromosome segregation and beyond. Nat
Rev Cancer. 2014;14:389–93.https://doi.org/10.1038/nrc3743.
66. Watrin E, Peters J-M. The cohesin complex is required for the DNA damage-induced G2/M checkpoint in mammalian cells. EMBO J. 2009;28:2625–35.
https://doi.org/10.1038/emboj.2009.202.
67. Coux O, Tanaka K, Goldberg AL. Structure and functions of the 20S and 26S proteasomes. Annu Rev Biochem. 1996;65:801–47.https://doi.org/10.1146/ annurev.bi.65.070196.004101.
68. Shu F, Guo S, Dang Y, Qi M, Zhou G, Guo Z, et al. Human Aurora-B binds to a proteasomeα-subunit HC8 and undergoes degradation in a proteasome-dependent manner. Mol Cell Biochem. 2003;254:157–62.https://doi.org/10. 1023/A:1027317014159.
69. Crosio C, Fimia GM, Loury R, Kimura M, Okano Y, Zhou H, et al. Mitotic phosphorylation of histone H3: Spatio-temporal regulation by mammalian Aurora kinases. Mol Cell Biol. 2002;22:874–85.https://doi.org/10.1128/mcb. 22.3.874-885.2002.
70. Subramanian A, Tamayo P, Mootha VK, Mukherjee S, Ebert BL, Gillette MA, Paulovich A, Pomeroy SL, Golub TR, Lander ES, Mesirov JP. Gene set enrichment analysis: a knowledge-based approach for interpreting genome-wide expression profiles. Proc Natl Acad Sci. 2005;102(43):15545–50.https:// doi.org/10.1073/pnas.0506580102.
71. Stark C, Breitkreutz BJ, Reguly T, Boucher L, Breitkreutz A, Tyers M. BioGRID: a general repository for interaction datasets. Nucleic Acids Res. 2006; 34(Database issue):D535–9.
72. Salwinski L, Miller CS, Smith AJ, Pettit FK, Bowie JU, Eisenberg D. The database of interacting proteins: 2004 update. Nucleic Acids Res. 2004; 32(Database issue):D449–51.https://doi.org/10.1093/nar/gkh086.
73. Keshava Prasad TS, Goel R, Kandasamy K, et al. Human protein reference database--2009 update. Nucleic Acids Res. 2009;37(Database issue):D767–72.
https://doi.org/10.1093/nar/gkn892.
74. Orchard S, Ammari M, Aranda B, et al. The MIntAct project--IntAct as a common curation platform for 11 molecular interaction databases. Nucleic Acids Res. 2014; 42(Database issue):D358–63.https://doi.org/10.1093/nar/gkt1115.
75. Licata L, Briganti L, Peluso D, et al. MINT, the molecular interaction database: 2012 update. Nucleic Acids Res. 2012;40(Database issue):D857–61.https:// doi.org/10.1093/nar/gkr930.
76. Szklarczyk D, Gable AL, Lyon D, et al. STRING v11: protein-protein association networks with increased coverage, supporting functional discovery in genome-wide experimental datasets. Nucleic Acids Res. 2019; 47(D1):D607–13.https://doi.org/10.1093/nar/gky1131.
77. Schaefer MH, Fontaine J-F, Vinayagam A, Porras P, Wanker EE, Andrade-Navarro MA. HIPPIE: integrating protein interaction networks with experiment based quality scores. PLoS One. 2012;7:e31826.https://doi.org/ 10.1371/journal.pone.0031826.
78. Lo Surdo P, Calderone A, Cesareni G, Perfetto L. SIGNOR: a database of causal relationships between biological entities—a short guide to searching and browsing. Curr Protoc Bioinforma. 2017;58:8.23.1–8.23.16.https://doi. org/10.1002/cpbi.28.
79. Fazekas D, Koltai M, Türei D, Módos D, Pálfy M, Dúl Z, et al. SignaLink 2– a signaling pathway resource with multi-layered regulatory networks. BMC Syst Biol. 2013;7:7.https://doi.org/10.1186/1752-0509-7-7.
80. Essaghir A, Toffalini F, Knoops L, Kallin A, van Helden J, Demoulin J-B. Transcription factor regulation can be accurately predicted from the presence of target gene signatures in microarray gene expression data. Nucleic Acids Res. 2010;38:e120.https://doi.org/10.1093/nar/gkq149. 81. Ogata H, Goto S, Sato K, Fujibuchi W, Bono H, Kanehisa M. KEGG: Kyoto
encyclopedia of genes and genomes. Nucleic Acids Res. 1999;27:29–34.
https://doi.org/10.1093/nar/27.1.29.
82. Wang J, Lu M, Qiu C, Cui Q. TransmiR: a transcription factor–microRNA regulation database. Nucleic Acids Res. 2009;38(suppl_1):D119–22.https:// doi.org/10.1093/nar/gkp803.
83. Hsu S-D, Lin F-M, Wu W-Y, Liang C, Huang W-C, Chan W-L, et al. miRTarBase: a database curates experimentally validated microRNA–target interactions. Nucleic Acids Res. 2010;39(suppl_1):D163–9.https://doi.org/10. 1093/nar/gkq1107.
84. HIPPIE Howto. http://cbdm-01.zdv.uni-mainz.de/~mschaefer/hippie/ information.php. Accessed July 2019.
85. Benjamini Y, Hochberg Y. Controlling the False Discovery Rate: A Practical and Powerful Approach to Multiple Testing. J Royal Stat Soc. 1995;57(1): 289–300.
Publisher’s Note
Springer Nature remains neutral with regard to jurisdictional claims in published maps and institutional affiliations.