RESEARCH OUTPUTS / RÉSULTATS DE RECHERCHE
Author(s) - Auteur(s) :
Publication date - Date de publication :
Permanent link - Permalien :
Rights / License - Licence de droit d’auteur :
Bibliothèque Universitaire Moretus Plantin
Institutional Repository - Research Portal
Dépôt Institutionnel - Portail de la Recherche
researchportal.unamur.be
University of Namur
A multi-scale fine-grained LUTI model to simulate land use scenarios in Luxembourg
Gerber, Philippe; CARUSO, Geoffrey; Cornelis, Éric; MÉDARD de CHARDON, Cyrille
Published in:Journal of Transport and Land Use
DOI:
http://dx.doi.org/10.5198/jtlu.2018.1187
Publication date:
2018
Document Version
Publisher's PDF, also known as Version of record
Link to publication
Citation for pulished version (HARVARD):
Gerber, P, CARUSO, G, Cornelis, É & MÉDARD de CHARDON, C 2018, 'A multi-scale fine-grained LUTI model to simulate land use scenarios in Luxembourg', Journal of Transport and Land Use, vol. 11, no. 1, pp. 255-272. https://doi.org/10.5198/jtlu.2018.1187
General rights
Copyright and moral rights for the publications made accessible in the public portal are retained by the authors and/or other copyright owners and it is a condition of accessing publications that users recognise and abide by the legal requirements associated with these rights. • Users may download and print one copy of any publication from the public portal for the purpose of private study or research. • You may not further distribute the material or use it for any profit-making activity or commercial gain
• You may freely distribute the URL identifying the publication in the public portal ?
Take down policy
If you believe that this document breaches copyright please contact us providing details, and we will remove access to the work immediately and investigate your claim.
http://jtlu.org . 11 . 1 [2018] pp. 255–272
A multi-scale fine-grained LUTI model to simulate land-use scenarios
in Luxembourg
Philippe Gerber
LISER, Luxembourg
Geoffrey Caruso
University of Luxembourg & LISER, Luxembourg
Eric Cornelis
University of Namur, Belgium
Cyrille Médard de Chardon
University of Hull, United Kingdom
Abstract: e increasing attractiveness of Luxembourg as a place to work and live puts its land use and transport systems under high pressure. Un-derstanding how the country can accommodate residential growth and ad-ditional traffic in a sustainable manner is a key and difficult challenge that requires a policy relevant, flexible and responsive modelling framework. We describe the first fully fledged land-use and transport interaction framework (MOEBIUS) applied to the whole of Luxembourg. We stress its multi-scalar nature and detail the articulation of two of its main components: a dynamic demographic microsimulation at the scale of individuals and a micro-spatial scale simulation of residential choice. Conversely to traditional zone-based approaches, the framework keeps full details of households and individuals for residential and travel mode choice, making the model highly consistent with theory. In addition, results and policy constraints are implemented at a very fine resolution (20m) and can thus incorporate local effects (residen-tial externalities, local urban design). Conversely to fully disaggregated ap-proaches, a linkage is organized at an intermediate scale, which allows (1) simplifying the generation and spatial distribution of trips, (2) parallelizing parts of the residential choice simulation, and (3) ensuring a good calibration of the population and real estate market estimates. We show model outputs for different scenarios at the horizon 2030 and compare them along sustain-ability criteria. Article History: Received: April 15, 2017 Accepted: August 4, 2017
Available online: Febru-ary 22, 2018
1 Introduction
Luxembourg is a unique European country emerging within a strong regional metropolis. Despite Luxembourg’s small area (2, 586km2) it has a strong economy (GDP growth rate of 3.4% in 2016) and the highest population growth rate in Europe (+24.6% over the last decade). e capital has attracted a concentration of global services, international institutions and subsequent jobs, far beyond what is expected for its population or area.
Copyright 2018 Philippe Gerber, Geoffrey Caruso, Eric Cornelis, and Cyrille Médard de Chardon. doi: 10.5198/jtlu.2018.1210
ISSN: 1938-7849 | Licensed under theCreative Commons Attribution – NonCommercial License 4.0.
e Journal of Transport and Land Use is the official journal of the World Society for Transport and Land Use (WSTLUR) and is published and sponsored by the University of Minnesota Center for Transportation Studies.
. e rapid growth and strong concentration of activity, however, has created a gap between trans-port infrastructure, land provision and what is usually considered as a sustainable urban integration (Hesse(2014)). e country and its neighbouring regions face acute negative impacts associated with residential sprawl (Decoville and Schneider(2015)), increasing traffic (Schmitz(2012)) and car de-pendence (Schiebel et al.(2015)). e present intensity of land and transport system use combined with growth forecasts (Langers and Peltier(2010);Peltier(2011)) calls for effective policies to ac-commodate future residential demand and linked travel demand in feasible, attractive and sustainable manner.
In recent years a number of empirical studies have been conducted on land use change (e.g.,Basse
et al.(2014);Decoville and Schneider(2015);Lord et al.(2015)), land markets (Glaesener and Caruso
(2015)) and the functioning of the transport system (Caruso et al.(2015c);Omrani et al.(2013);
Schiebel et al.(2015);Sprumont et al.(2014)) in Luxembourg. However no effort has been made to simulate interactions between land use and transport systems or the effect of spatial scenarios. It is the very essence of Land Use and Transport Interaction (LUTI) models to do so and support policy mak-ing by simulatmak-ing urban development and the daily mobility of individuals (see e.g.,Wegener and Fürst
(1999)). LUTI models have been applied in many different geographical contexts, especially in Amer-ica and Europe (seeomas et al.(2018) for a recent review of European cases), but not Luxembourg. In this article we present how we have devised a platform for the whole Grand-Duchy of Luxembourg in order to assess the sustainability of multiple planning and growth scenarios. e platform emerged from the MOEBIUS project (Mobilities, Environment, Behaviours, Integrated in Urban Simulation, seeGerber et al.(2013)) designed to analyse interactions between residential location and commuting and test prospective planning scenarios (described inLord et al.(2015)) for 2030.
Not only is our platform a first LUTI model for Luxembourg but our approach also proposes a methodological response to the aggregation-disaggregation problem - which is still one of the major challenge in the LUTI modelling field (Acheampong and Silva(2015);Wegener(2011)). We have devised a multi-scalar architecture in order to avoid unnecessary computing simulation burdens while keeping excellent spatial and agents granularity. High level of both spatial and agent detail is actually needed to assess local implementations of land use plans and modelling well-being outcomes and travel decisions of diverse households in a theoretically consistent manner.
We contextualize our work within the urban modelling literature, recognizing that policies may have complex or contradictory outcomes to those expected.
Environmental sustainability depends on overall commuting distances, the extent of urbanisation and aggregate densities (Ewing and Hamidi(2015);Ewing and Cervero(2010)), but it also depends on local urban settings (e.g., local density, accessibility to local amenities, proximity to local services). Modal shis at the national level can appear to be sustainable while being unsustainable for some municipalities or neighborhoods due to further congestion. Negative or positive externalities from density at a micro scale can be obscured at an aggregated scale (e.g., in terms of access to green ameni-ties (Caruso et al.(2015a)), walkability (Southworth(1997)) or exposure to traffic (Schindler et al.
(2017))). Furthermore, the specific characteristics of households within neighbourhoods may impact these relations (e.g., locational preferences or travel mode affordance related to households composi-tion, age or income). Similarly, more social aspects of sustainability and equity may appear or disappear at different scales, such as household segregation patterns. Further, the constrained relocation of sim-ilar households may lead to differences in utility levels across neighbourhoods, that do not necessarily affect global scenario assessments in terms of utility. Operating at a finer scale is therefore essential but comes at a cost, especially in terms of flexible computing or calibration (Wegener(2011)). On the other hand, several aspects of sustainability (land take, commuting distances) come out much more di-rectly from aggregate exogenous inputs, in particular from the general pattern of land use and densities imposed by scenarios or the main locations for jobs. In this case high spatial and thematic resolution is unnecessary.
A multi-scale fine-grained LUTI model To deal with these issues, we propose a model architecture in three tiers (micro, meso, macro), where a linkage is organized at the intermediate scale. is meso scale allows us (1) to simplify the generation and spatial distribution of trips (already highly constrained by scenarios), (2) to parallelize parts of the residential choice simulation, and (3) to ensure a good calibration of population growth and real estate market estimates.
We present the general architecture of the model in section2as well as two of its major modules: a dynamic demographic microsimulation at the scale of individuals and a micro-spatial scale simulation of residential choice. In section3we present some calibration and simulation with a focus on popu-lation location and housing and some results linked to travel (distance, modes and time). Section4
concludes.
2 MOEBIUS architecture and components
2.1 Modules
As many LUTI models described byWegener(2004), our platform includes most of the urban sub-systems derived from the land use - transport loop (Wegener and Fürst(1999)): networks, land use, employment, workplaces, population, housing, travel (only the transport of goods is not considered). Requiring different methodologies from diverse disciplines to grasp these interactions, we designed MOEBIUS’ architecture as separate modules with only linkages to inputs and outputs. is design is named composite (Wegener(2004)) whereas an integrated structure of modules is unified. e com-posite design allows integrating innovative methodologies, application of proven methods and flexible testing of spatially explicit scenarios.
Our composite architecture can be characterized through a specific flowchart (Figure1) combin-ing the inputs and outputs of 5 modules (M1-M5) in order to finally simulate sustainability indicators (M6) under different planning scenarios. Modules M1, M3 won’t be presented in details since they have been reported elsewhere (seeLord et al.(2015) for M1 andOmrani et al.(2013) for M3). Same for M5, a disaggregated traffic assignment process relying on MATSIM, for which there are known applications (seeHorni et al.(2016)).
Our land use planning inputs (M1) are based onLord et al.(2015) who designed four scenarios for Luxembourg based on widely discussed concepts in planning and research (e.g., compact cities, transit oriented development) . ey were adapted to Luxembourg-specific official documents and regulations, and applied within a GIS at a very fine spatial resolution (20m) - our micro spatial level. Each scenario dedicates land for residential use and may include priority rules for a gradual delivery of land when capacity is reached in some areas. e residential allocation module (M4, detailed in section2.3) is in charge of populating the 20m cells made available in each scenario, with the synthetic population generated in M2 for each commune (detailed in section2.2). M4 is a down scaling process based on residential preferences for qualities of each cell. Each populated cell then becomes the origin of commuting trips, for which modes are defined in M3, and the assignment on networks is made in module M5 using MATSim, knowing exogenous destinations. is produces a spatial distribution of possible congestion, arising from traffic assignment, used in appraisal, but not feedback, of residential location decisions.
e modular structure permits different techniques to be used based on recent developments or availability of data. In the case of module M3 for example, the approach was purposefully less usual than in standard four steps models, because the aim was to make full use of the available character-istics of agents together with their locational context. Distilling mode choice behavioural rules by taking into account a lot of predictors at the same time is an approach that has attracted increasing interest over the two last decades, using inductive methods such as decision trees (e.g., as in Albatross byArentze and Timmermans(2003)) or neural networks (e.g.,Andrews et al.(1995)). As described inOmrani et al.(2013), a set of methods were benchmarked and applied to the active population
. Scenarios GIS
Synthetic
populations
CA / MASSimulation
& assessment
Daily mobility behavioural rules Grid generation (cells 20 x 20 m) Agent generation (individuals and households) Grid generation (cells 20 x 20 m) MOEBIUS Team, 2016 Link betweenmodules
Module (not detailed in the paper) MAS Method/Tool Grid generation Outputs
Residential
mobility
mobilityDailyAccessibility Modal split
Land take Utility Density Statistic & mathematic
models
Module name Layer
choiceLayer
choice AttributeAttributecheicechoice
Land use planning scenarios Demographic forecasts Land use planning scenarios Demographic forecasts Integration of rules Integration
of rules IntegrationIntegrationof rulesof rules
Agent generation (individuals and households) Agent generation (individuals and households) Traffic Assignment Household bidding & allocation
M5
M4
M1
M6
M5
M4
M1
M2
M2
M3
M3
M6
M# M# Focused module Modulename M# M#A multi-scale fine-grained LUTI model of Luxembourg. e module then outputs mode choice (car, public transport, so modes) rules in the form of mathematical and logical expressions applicable at the individual level, as of our synthetic population (M2).
e final module (M6) consists of gathering indicators aer the allocation of households and the simulation of their trips. e total synthetic population generated is constant across planning scenar-ios. With fixed population and a residential allocation based on micro-economic principles, utility can be used as a measure of the social outcome of the scenarios, given the spatial constraints that re-flect in real estate prices and transport costs/time. We also consider some transport indicators, such as accessibility, as a social outcome, especially when compared across household groups. Accessibility, if measured as total distance travelled and linked with mode choice is also an environmental indicator. In addition to utility and transport indicators, we consider, in line with most planning and ecological literature, that the more parsimonious is the use of land, the better it is. Hence we use land take and density as assessment criteria, taking good note however that the latter is ambiguous for normative use. Land take and densities are strongly exogenously constrained by the land made available in each scenario, but variations arise also aer the simulated locational decision of households.
2.2 Synthetic Population
Microsimulation techniques are increasingly used in social science in general (e.g.,Clavet et al.(2012);
O’Sullivan(2009);Spielauer(2009)) and for residential choice (e.g.,Gil-uijano et al.(2007))or mo-bility (e.g.,Farooq et al.(2013);Lenormand et al.(2014)) in particular, both spatially grounded phe-nomena. Microsimulation is most relevant since it provides disaggregate characteristics of agents and allows us to examine detailed impacts of considered policy measures onto individuals’ decisions. Fur-thermore, microsimulation models can deal with many interactions between agents and can do it in a dynamic fashion for use in prospective scenarios.
MOEBIUS considers two levels of agents, both delivered by module M2: individuals and house-holds. Different elements of mobility and residential choices decisions are in fact taken at either in-dividual (e.g., mode choice) or household level (e.g., buying a car, changing of dwelling). We build a population for a starting date representative of 2001 data and a prospective population for 2030. Households are created as aggregates of individuals in 2001 and located at the meso scale (i.e., 116 municipalities) where statistical margins were available. is makes best use of the information avail-able and avoids unnecessary computing of competing residential choice (across municipalities) for installed households. Starting from the 2001 population and its location, demographic processes are then simulated to obtain a 2030 population with all necessary individual characteristics. e alloca-tion of the populaalloca-tion to communes (then to cells) is made in one shot, i.e., once the populaalloca-tion is created. We decided in this application not to locate population over the course of time. Intermediate stages can be modelled later, leading to smoother transition and more path-dependency.
2.2.1 Base population
Due to privacy concerns and lack of accurate datasets, the ’true’ population could not be used as in-put. A virtual population, statistically as close as possible to the ’true’ one, is therefore built. is can be achieved using one of the many methods used to create synthetic populations (e.g.,Arentze et al.
(2007);Auld et al.(2009);Barthelemy and Toint(2013);Beckman et al.(1996);Farooq et al.(2013);
Gargiulo et al.(2010);Guo and Bhat(2007);Huang and Williamson(2001);Müller and Axhausen
(2011);Pritchard and Miller(2012) and reviewed by (Barthelemy and Cornelis 2012)).
Statistical margins were obtained from the national census of 2001 (from Statec, later census was not delivered at the time of the project) and a sample of the population was provided by the Luxem-bourg Institute of Socio-Economic Research (LISER) based on a socio-economic longitudinal panel (PSELL, see e.g.,Fusco(2015)) for the period 2003-2009. e panel contained 3 739 households,
. representing 10 042 individuals. In absence of other sample, we must unfortunately accept potential biases in the synthetic population due to the misalignment of the sample and census dates.
Given data inputs (margins) and output needs at both individual and household levels, we opted for the bi-level IPFP (Iterative Proportional Fitting Process) method as described byGuo and Bhat
(2007). Our IPFP implementation relies on 30 iterations and a 10% PDTS (percentage deviation from target) parameter. e latter means that the threshold bound for each type of households is 10% higher than the target value, i.e., the algorithm may generate in the synthetic population up to 10% more households than the target margin for each type of households.
We obtained a base synthetic population of 2001 containing 441 069 records (individuals), each characterized with 16 attributes deemed necessary for simulating residential or mobility behaviour: municipality of residence, individual identifier, household identifier, household size, number of active people in the household, gender, age, education level, socio-professional category, citizenship, house-hold type, working zone, active or not, unemployed or not, driving license ownership, season ticket ownership.
2.2.2 Dynamic population
Starting from this base synthetic population we simulate its change over time for 30 years. On a yearly base, we simulate, as displayed in Figure2, the effects of a series of demographic processes on the com-position of the synthetic population both in terms of individuals and households. We sequentially take into account the following processes and how they change the number and characteristics of in-dividuals and households: aging (everybody becomes one year older each year), entry in active life (aer getting a diploma, young people leave parents’ house and start their active life), characteristics evolution (each year, parameters such as socio-professional category, unemployment, driving license ownership, season ticket ownership could change), retirement, births, deaths, divorces, marriages, and migration.
e order of the sequence of these processes has been chosen to allow for two successive events to logically happen in the same year : a baby born during a simulated year could die during the same year; a person divorcing may be married aerwards in the same time period... Some cases are excluded, e.g., a couple cannot marry and divorce in a single year. All processes are simulated as stochastic events following observed probability distributions, except for the yearly increment of ageing which is (un-fortunately) deterministic.
In addition to social and natural changes, migration occurs and is a major determinant of popula-tion change for Luxembourg (Lord and Gerber(2009)). Following Statec’s forecasts, population will continue to increase but at a decreasing pace. We set this in our simulation and each iteration year (from 0 to 30), the number of migrants is given by(−102.6 × year) + 5836. e characteristics of migrants are based on the patterns observed for the migrants included in the PSELL panel between 2003 and 2009. is means that, for a given attribute, the relative part of each modality within the cohort of migrants for the considered year will mimic the average of the ones observed in the provided waves of the panel. For example, the 50.4% of women in the observed migration cohorts is generated as the gender distribution of migrants in the synthetic population. We proceed similarly for gender, age class, education level, socio-professional category, citizenship, active or inactive status, unemploy-ment, working zone, and household type.
When a virtual migrant with household type ”couple” is generated, a second migrant is created (spouse) and added to the household, using the alternative gender and age ranging from 5 years younger to 5 years older. e other characteristics of this spouse are chosen following the same rules as the ones applied to each new migrant. When a child has to be added to a household, the simulation imposes that (s)he must be younger than her/his parent(s). erefore the drawn age of the child must be at least 16 years less than the minimum of the two parents’ ages. For household types other than single or couple without child, since the household size is not automatically fixed, the simulation randomly
A multi-scale fine-grained LUTI model
+1 year
Aging
Entry in
active life?
Characteristics
evolution
Retired?
Birth?
Death?
Divorce?
Marriage?
Migration
Figure 2:Modelled demographic events for a one year simulation.
add 1, 2 or 3 other members to the household. Once integrated in the Luxembourg synthetic popu-lation, all these migrants continue to evolve the following years according to the same rules as the rest of the population.
Finally, migrating households are allocated to communes based on (meso) land-use scenarios and the space made available at the meso level (seeLord et al.(2015)). is population projected for 2030, P1, is distributed differently according to scenarios. e benchmark scenario (business as usual) repli-cates the distribution of migrants amongst the municipalities as observed in the considered waves of the panel.
2.3 Residential location
Our residential location module (M4) populates the cells made available in each land use scenario with the population derived at the meso level. e model has two iterations: the allocation of the base population,P0, in 2001 (t0), within the existing urban fabric in 2001, and the second using the alternate land use scenarios for supply and the updated population,P1, as of 2030 (t1). e agents considered are the households made up from the individuals of the synthetic populations (base and 2030).
e model is based on micro-economics where local residential preferences and spatial explicit externalities are added to the standard transport-housing costs trade-off (e.g., followingCaruso et al.
(2015a);Schindler and Caruso(2014)). e heterogeneity of households’ characteristics is taken up in local preference parameters and travel costs. In addition to the location of different household types
. at the 20m resolution scale, the module also outputs utilities and rents. Given that total population is fixed across scenarios, utilities then represent the social outcome of each planning scenario given the constraints they apply to household’s choice. A bidding system and a market clearing process (adapted fromFujita(1989)) are simulated, thus taking into account ’perceived utility’ (Ettema(2011)) and the supply of housing in each municipality as of each scenario and in order to render utilities and rents.
One could argue that the residential model is imperfect in the sense that the competition between potential locations is only made within municipalities, i.e., at the micro scale, thus as if municipalities (meso level) were particular submarkets. is is true but it largely increases performance while being a theoretically and empirically sound architecture. First, we have good empirical evidence, from mul-tilevel econometrics, for the existence of such spatial submarkets in Luxembourg when it comes to choosing among suburban locations (Glaesener and Caruso(2015)). Second, the overarching urban structure of the country as reflected at the meso scale (variations across municipalities) is still consid-ered in the calibration process and ensures that overall rent gradients, and especially the major effect of the distance to Luxembourg city, are respected. e remainder of the variation in housing prices in Luxembourg is largely explained by local variations in proximity to amenities and by the physical attributes of dwellings, which themselves are largely independent from planning policy. ird, there is also the idea that the choice set considered by households at one point in time is limited by a certain spatial horizon rather than being a full awareness where all dwellings available in the country would be in competition. is also reflects a trend in spatial economic agent-based models in presence of households heterogeneity (e.g.,Chen et al.(2011);Lemoy et al.(2016)).
2.3.1 Micro-economic model
Households bid for available residences within a municipality with the aim to maximize their utility under constraint of transport and housing costs. Our agents utility results from the consumption of a composite (non-spatial) good, Z, and two local externalities: green space, G, and social interaction, S, both derived from local density (followingCaruso et al.(2007)). Clearly additional factors affect res-idential choice (Hurtubia et al. 2010) and could be implemented within the decision making process but were either beyond this project constraints or unrelated to the local competition modelled here. With 1≤ G, S ≤ 2 and preferences 0 ≤ β,γ ≤ 1 the direct utility is:
U(Z,G, S) = ZGβSγ (1)
While many economic residential models consider housing as a variable good (surface consump-tion) we are treating it as a single unit, thus assuming different typologies of housing to be provided locally based on demand, independent of planning scenarios. e entirety of households budget is spent on housing, transport costs and the composite good.
More precisely, the following constraint applies:
Z= Y − T − Ts− R (2)
where Y is a household specific income, T a transport cost to work and Ts a transport cost to school (both depending on households and location and scaled linearly with network distance), and R the rent of the housing unit.
Combining the two equations above yields the following indirect utility:
V = (Y − T − Ts− R)GβSγ (3)
Household bids are then obtained aer isolating R:
A multi-scale fine-grained LUTI model ψ is the maximum amount a household would bid for a location in order to obtain a level of utility µ. It is a function of their preferences for the attributes of housing units and their associated transport costs.
2.3.2 Spatial and agents attributes
A number of spatial attributes were calculated for each cell and each scenario at 20m resolution in order to feed in utilities and bid rents: proximity to primary school, total travel costs to all work zones, ratio of green space (public and private) and residential density in proximity (100m).
e location of residents on the 20m grid att0serves as existing housing distribution and is the source of social density. At this spatial scale, spaces between residences, for yards and transport in-frastructure, create challenges in modelling future growth where infrastructure is not present and yet requires residence to be dispersed similarly according to the local density guidelines. Statistically ro-bust homogeneities in interbuilding distances can actually be found in empirical studies (Caruso et al.
(2017)). A cellular automata (CA) inspired process is used to generate the pattern of newly available cells similar to neighbouring patterns, while respecting the scenario constraints in terms of number of cells to be made available. As use of 20m cell resolution meant some parcels exceeded cell dimensions, CA was used to incrementally build parcels according to scenario densities, within growth spaces pro-vided.
Further to spatial characteristics, agents attributes also impact the indirect utility of candidate residences due to varying need for transport (private vehicle versus public transit), proximity to pri-mary schools, city centre and employment destination. e household attributes from the synthetic population that impact residential bids through travel components are: possession of driving licence, possession of season tickets, household type (single, couple, couple with children, etc.) and size, and work destination. Preferences (γ and β in equation1) are defined based on household attributes.
e available revenue Y of each household is also to be estimated using the characteristics of the individuals composing the household within the synthetic population. is estimation is based on mean incomes, gender, education, socio-professional class, and age of individuals as of national aggre-gate statistics (available for 2012 from Statec). Individual income estimates were then aggreaggre-gated per household, i.e., the decisional ‘agent’ for residential location.
2.3.3 Bidding and market clearing
Each residential simulation is completed in three steps: bid rent calculations, allocation of households to available locations, and utility and rent adjustment calculation for each household.
As our model relies on each agent bidding for each property available, extremely large matrices are produced (even more if larger submarkets were considered). By subdividing agents and available housing at the meso scale and integrating it in the synthetic population, we create smaller data sets that can be processed in parallel requiring an exponential decrease in computational time and memory. Additional random market segmentation within communes (which were actually necessary for the largest communes) further simulates the limited knowledge of agents while also simulating a fuzzy Monte Carlo output.
Allocation is resolved iteratively, one household at a time, where a property’s highest bid is also a household’s top choice in terms of bid rent amount. Once a household is allocated, its higher bids for the non selected other properties are removed, allowing lower bids from other households to match.
Bid rents are not the final calculated rents. Determining rent is also an iterative process. Based on the idea (as inFujita(1989)) of using the bid at the ’fringe’, i.e., the lowest bid allowing entry in the system, to compute utility, we consider the agent with the lowest successful bid and equal this value to the rent. e next lowest successful bid rent is taken and lowered to the bid beneath. is process, according to equation4, increases household utility from which we recalculate all bids for this agent in order to determine adjusted rents and utility of successive households.
. 2.3.4 Iterations
e model is applied att0and again att1(2030) with synthetic populations provided for each sce-nario and each municipality. Where households still exist fromP0, they maintain their residential location, while new households are generated from offspring or divorces ofP0households or immi-gration. Some previously occupied houses become available due to the demise of the household. e population att1requires additional housing provided according to residential reserves (priority rules applied in M1) and overall increase in density if necessary.
Given that the synthetic population is available yearly, the framework allows for more intermedi-ate times to be considered. It has been considered to be out of scope for the project and would require further empirical evidence on the internal migration of households, especially yearly relocation pro-cesses. To date longer run location processes are known with more robustness than yearly variations.
Populatingt0and scenarios att1were completed using a high performance cluster (Varrette et al. 2014) taking a few hours for each national scale population allocation.
3 Simulations
In this article we describe four of the scenarios simulated (further details to be found inLord et al.
(2015)). e synthetic population model allocates households at the meso scale (communes) vary-ing by scenario and land use. e first scenario, BAU (Business As Usual), is the continued logic of urbanisation and planning principles in Luxembourg. e second, TOD (Transit Oriented Develop-ment) guides urbanisation toward a more polycentric urban development with further concentrations guided by the availability (or foreseen increase) of public transport (train stations). e third scenario, LUXVILLE, increases the concentration of jobs in the city of Luxembourg, thus reflecting increasing agglomeration trends and attractiveness of the capital, despite a political will to disperse this attraction. e last scenario, INNER, is similar to LUXVILLE, but also increases densities in Esch-sur-Alzette and Nordstad, two existing area with higher population density. As in most prospective research, none of these scenarios is meant to be realistic but to force traits in order to fuel debate about possible fu-tures.
3.1 Calibration
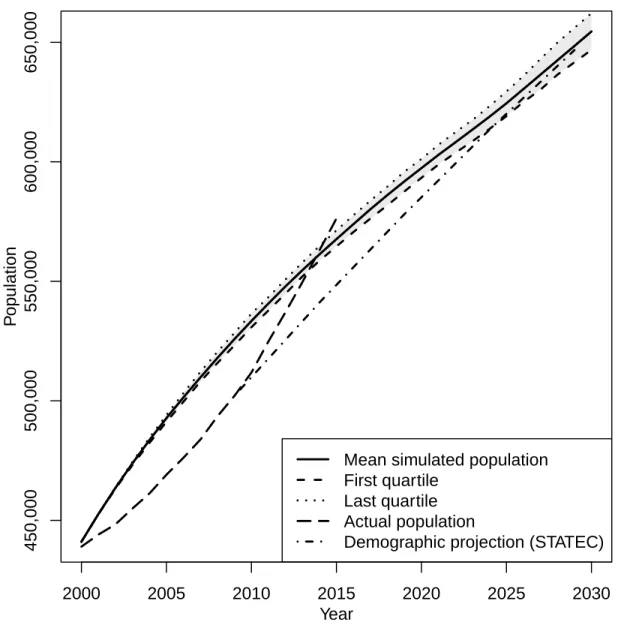
Calibration is completed for the synthetic population generation and residential allocation processes. For the synthetic population, calibration is part of the generation process since statistical margins are used. What requires careful quality assessment is the logical/mechanical part embedded in the dy-namic evolution. Our generated population and forecasts must be compared to the actual population and available baseline demographic projections from the national statistical office (Statec). Figure3
displays the mean as well as the first and last quartiles of the distribution of the synthetic populations simulated over 100 runs aer our dynamic evolution mechanisms. Although we have some discrepan-cies at the start, the model aligns very well with the aggregate reference demographic forecasts for the last 10-15 years considered, including 2030, used in the residential simulation.
Regarding the residential choice model, calibration of parameters within the utility function is based on literature for the local effects (see e.g.,Caruso et al.(2015b)) and aims at matching the pro-file of rents against distance to Luxembourg city, hence correctly fitting the meso-scale structure of rents as inGlaesener and Caruso(2015). Scenario rents (Figure4) are similar to those observed while differences are in line with the scenario rationales (differentiated supply according to distance).
3.2 Assessment
Figure5shows part of Luxembourg City for one, of a 100, stochastic outcomes of the micro-simulated household allocation. e figure provides an idea of the scale and variations we find in the simulations
A multi-scale fine-grained LUTI model 2000 2005 2010 2015 2020 2025 2030 Year P opulation 450,000 500,000 550,000 600,000 650,000
Mean simulated population First quartile
Last quartile Actual population
Demographic projection (STATEC)
Figure 3:Simulated evolution of the synthetic population compared to the actual population and the demographic projections from Statec.
within an already urbanised context. e first column depicts household types in colour, taking the most represented type in a 20m cell. Given thematic aggregation and the urban setting, it is difficult to see changes in pattern across scenarios but the figure indicates a rather strong consistency of loca-tion decisions across scenarios. More telling is the difference in realised densities (second column) especially for the INNER scenario that aims to drastically increase densities within the main existing urban fabrics, especially the one of Luxembourg city.
Figure6depicts utility outcomes at the meso-scale, aer aggregation of the indirect utility ob-tained by each household. As explained earlier, utility is made of a standard trade-off along the dis-tance to jobs (essentially Luxembourg city) between transport and housing costs but also of local ef-fects, thus representing the local design of policy scenarios. By representing differences (in percentage) to the BAU scenario with the same utility scale, the figure shows the overall utility effects of these local plan implementations aer controlling for the standard trade-off, i.e., the main structure of the coun-try. We see that the LUXVILLE scenario, because it imposes less residential constraints (more in line with BAU), impacts less on utilities than the polycentric (TOD) or compactness (INNER) scenarios. ose two scenarios definitely command lower utility for suburban and exurban locations, suggesting
. 10000 30000 50000 70000 10000 12000 14000 16000 18000
Distance from Luxembourg City (km)
Mean rents per y
ear (Euro) Scenario BAU INNER LUXVILLE TOD
Figure 4:Housing rent profile against distance to Luxembourg city for the different scenarios
that both can halt sprawl trends while the deficit in supply (and therefore increase in rents) does not seem to be compensated by local qualities. e TOD is slightly less constraining than the INNER sce-nario in terms of distribution of utility gains and losses and with the peripheral centres of the North showing positive utility difference compared to continuing current trend (BAU).
Finally, setting aside the geographical distribution of impacts, we have assembled aggregate sus-tainability criteria in Table1for each scenario. As introduced in section2.1, we consider social (util-ity), transport and land use and density indicators.
On the transport side, our first result is that modal split gains and differences in total kilometers travelled are rather marginal (at best 5% reduction in car use or a reduction of 5 km travelled by per-son) compared to the intensity of the planning constraints implemented. ere is definitely a limit to what land use plans, given an existing urban structure and transportation system, can achieve. Similar inertias were discussed for recent LUTI applications in Europe (see for exampleBierlaire et al.(2015) oromas et al.(2018)).
On the land use side, we see that the INNER scenario is more effective than the TOD & LUXVILLE scenarios, the latter of which is similar to BAU. Given we have not modelled full competition between municipalities, there is no rebalancing of demand to suburbs or exurbs in case imposed densities overly impacted the utility of households. For example, by reducing volumes of local green or increasing hous-ing rents, all else behous-ing equal. is is a limitation of the approach but we think it is marginal compared to the computational gains we had and the always exogenous nature of scenario-based research.
What is more important is to see that the small gains in transport or land parsimony comes with utility costs both in absolute and relative terms. Households are worse off with TOD and densification strategies. Planners definitely need to address this issue and propose novel local urban design principles than could compensate these losses. In addition, if INNER and TOD scenarios are directly compared, one can see that the INNER scenario is a superior solution, i.e., it is better on all criteria. In other words, our work suggests that a polycentric development strategy without strong improvements in the transport system is simply vain.
e LUXVILLE scenario is less interesting in terms of transport and land take because it is close to a business as usual model, but it shows better relative utility outcomes. is suggests again that smarter solutions need to be found in order to better mix residential places and employment, in line with mixed development concepts.
A multi-scale fine-grained LUTI model D C B A 0 500 1000 metres Communal bounds Most frequent household type
Single
Couple, no children Couple with children Couple with one child Other Population 1 - 5 5 - 13 13 - 28 28 - 72 72 - 146
Figure 5:Simulated location of households and densities for scenario A) BAU, B) TOD, C) LUXVILLE, and D) INNER.
Table 1:Scenarios assessment dimensions
Dimension Transport Land use Social
Modal split PKT Utility Utility diff.
Scenario (diff % car) (car / person) Land take Net density Mean (% to mean)
BAU 0.00 30.52 1,0000 1,0000 1.0000 0.00
TOD -3.60 25.62 0.8721 1,1450 0.9938 -3.47
LUXVILLE -1.23 27.71 0.9723 1,0451 0.9987 +3.23
. Commune mean utility change (%) from BAU 28 − 3 3 − -5 -5 − -15 -15 − -21 -21 − -26 -26 − -40 A B C 0 20 40 kilometres
Figure 6:Average utility (difference to BAU) at meso scale (municipalities) for scenario A) TOD, B) LUXVILLE, and C) INNER.
A multi-scale fine-grained LUTI model
4 Conclusion
In this article we have described the first simulation of a complete land-use transport interaction loop for Luxembourg. Our framework (MOEBIUS) is an original combination for an entire country -of i) policy-informed spatially detailed scenarios, ii) synthetic dynamic population for residents and migrants, iii) endogenous land market with local attributes, iv) multi-attributes based travel mode choice, and v) coupling with state-of-the art traffic simulation. In addition, we think its multiscalar structure is shown here to be effective by allowing spatial and agents detail while simplifying parts of residential and transport processes that are very constrained by the existing spatial structure or the scenario design.
Eventually our framework leads to some clear policy indications calling for designing new land use scenarios and further refining strategies. Rather than delivering the one and only optimal solution, our LUTI model can participate to a two way conversation with policy makers by providing reasonably robust outcome with a sufficiently flexible and ’easy’ to handle simulation tool. e model is certainly imperfect and our results need to be taken with care. Yet, we confirm the importance of tightly liaising all components of the land use and transportation systems. Especially we find that polycentric de-velopment or densification strategies alone are insufficient, that transit oriented dede-velopment cannot compete with residential densification in sustainability terms without clear public transport improve-ments, and that mixed jobs and residential strategies need to be further investigated to decrease social impacts of environmental friendly strategies (lower car use and less land conversion).
In the future, we should particularly focus on the sensitivity analysis of parameters across mod-ules, the choice and weighting of appraisal criteria, including also equity-based descriptors that would take better account of the richness of agents attributes, and the disaggregation of employment zones for a refined modelling of jobs destinations and associated policies. Other methodological challenges should then be addressed, for example in line with those suggested byAcheampong and Silva(2015);
van Wee(2015). In particular, further links to other environmental impacts (pollution, noise) and appraisal systems (such as Consequential Life Cycle Assessment) would clearly benefit from the spa-tial granularity of our model. Additionally, to Luxembourg specifically, the lack of longitudinal data on travel behaviour and the enormous daily cross-border mobility calls for a data-driven mobility ob-servatory, both at national and cross-border scale, as well as a (macro)scope enlargement of the sys-tem considered (Ekvall and Weidema(2004)), which we know can significantly impact LUTI results (omas et al.(2018)).
5 Acknowledgements
is study was achieved in the framework of the MOEBIUS (MObilities, Environment, Behaviours, Integrated in Urban Simulation) 2010–2014 research project co-funded by the National Research Fund of Luxembourg (FNR CO09/SR/07) and the Luxembourg Institute for Socio-Economic Re-search (LISER). Eric Cornélis is grateful to LISER for the visiting scholarship during which this work was initiated. We wish to also thank the three reviewers for their comments.
.
References
Acheampong, R. and E. Silva. 2015. Land use-transport interaction modeling: A review of the litera-ture and fulitera-ture research directions. e Journal of Transport and Land Use, 8(3):11–38.
Andrews, R., J. Diederich, and A. Tickle. 1995. A survey and critique of techniques for extracting rules from trained artificial neural networks. Knowledge-Based Systems, 8(6):373–389.
Arentze, T. and H. Timmermans. 2003. Measuring impacts of condition variables in rule-based models of space-time choice behavior: Method and empirical illustration. Geographical Analysis, 35(1):24–45.
Arentze, T., H. J. P. Timmermans, and F. Hofman. 2007. Creating synthetic household populations: Problems and approach. Transportation Research Record: Journal of the Transportation Research Board, 2014:85–91.
Auld, J., A. Mohammadian, and K. Wies. 2009. Population synthesis with subregion-level control variable aggregation. Journal of Transportation Engineering, 135 (9):632–639.
Barthelemy, J. and E. Cornelis. 2012. Synthetic populations: review of the different approaches. Work-ing paper 2012-18, CEPS/INSTEAD, Luxembourg.
Barthelemy, J. and P. L. Toint. 2013. Synthetic population generation without a sample. Transportation Science, 47(2):266–279.
Basse, R., H. Omrani, O. Charif, P. Gerber, and K. Bodis. 2014. Land use changes modelling using advanced methods: Cellular automata and artificial neural networks. /the spatial and explicit repre-sentation of land cover dynamics at the cross-border region scale. Applied Geography, 43:160–171. Beckman, R., K. Baggerly, and M. McKay. 1996. Creating synthetic baseline populations.
Transporta-tion Research Part A: Policy and Practice, 30(6):415 – 429.
Bierlaire, M., A. de Palma, R. Hurtubia, and P. Waddell. 2015. Integrated transport and land use mod-elling for sustainable cities. Lausanne, Switzerland: EPFL Press.
Caruso, G., J. Cavailhès, D. Peeters, I. omas, P. Frankhauser, and G. Vuidel. 2015a. Greener and larger neighbourhoods make cities more sustainable! A 2D urban economics perspective. Comput-ers, Environment and Urban Systems, 54:82–94.
Caruso, G., J. Cavailhès, D. Peeters, I. omas, P. Frankhauser, and G. Vuidel. 2015b. Housing land transaction data and structural econometric estimation of preference parameters for urban eco-nomic simulation models. Data in Brief, 5:447–452.
Caruso, G., P. Gerber, M. Hesse, and F. Viti. 2015c. Editorial: Challenges, specificities and com-monalities of transport research and policy within the Benelux countries - the case of Luxembourg. European Journal of Transport and Inastructure Research, 15(4):501–505.
Caruso, G., M. Hilal, and I. omas. 2017. Measuring urban forms from inter-building distances: Combining mst graphs with a local index of spatial association. Landscape and Urban Planning, 163:80–89.
Caruso, G., D. Peeters, J. Cavailhès, and M. Rounsevell. 2007. Spatial configurations in a periur-ban city. A cellular automata-based microeconomic model. Regional Science and Urperiur-ban Economics, 37(5):542–567.
Chen, Y., E. Irwin, and C. Jayaprakash. 2011. Incorporating spatial complexity into economic models of land markets and land use change. Agricultural and Resource Economics Review, 40(3):321–340. Clavet, N.-J., J.-Y. Duclos, B. Fortin, and S. Marchand. 2012. Le uébec, 2004-2030: Une analyse de
micro-simulation. Rapport de projet 2012RP-16, CIRANO, Montreal, uebec, Canada.
Decoville, A. and M. Schneider. 2015. Can the 2050 zero land take objective of the EU be reliably monitored? A comparative study. Journal of Land Use Science, 11(3):331–349.
Ekvall, T. and B. Weidema. 2004. System boundaries and input data in consequential life cycle inven-tory analysis. e International Journal of Life Cycle Assessment, 9(3):161–171.
Ettema, D. 2011. A multi-agent model of urban processes: Modelling relocation processes and price setting in housing markets. Computers, Environment and Urban Systems, 35:1–11.
A multi-scale fine-grained LUTI model Ewing, R. and S. Hamidi. 2015. Compactness versus sprawl: A review of recent evidence from the
United States. Journal of Planning Literature, 30(4):1–20.
Ewing, R. H. and R. Cervero. 2010. Travel and the built environment: A meta-analysis. Journal of the American Planning Association, 76(3):265–94.
Farooq, B., M. Bierlaire, R. Hurtubia, and G. Flötteröd. 2013. Simulation based population synthesis. Transportation Research Part B: Methodological, 58:243 – 263.
Fujita, M. 1989. Urban Economic eory: Land use and city size. Cambridge, UK: Cambridge Uni-versity Press.
Fusco, A. 2015. e relationship between income and housing deprivation: A longitudinal analysis. Economic Modelling, 49:137–143.
Gargiulo, F., S. Ternes, S. Huet, and G. Deffuant. 2010. An iterative approach for generating statisti-cally realistic populations of households. PLoS ONE, 5(1):e8828.
Gerber, P., G. Caruso, E. Cornelis, C. Enaux, and D. Khadraoui. 2013. Interactions between residential and daily mobility: the project. In M. Hesse, ed., Proceedings of BIVEC-GIBET Transport Research Days 2013, pp. 397–399. Zelzate, Belgium: University Presss.
Gil-uijano, J., M. Piron, and A. Drogoul. 2007. Vers une simulation multi-agent de groupes d’individus pour modéliser les mobilités résidentielles intra-urbaines. Revue Internationale de Géo-matique, 17/2:161–181.
Glaesener, M. and G. Caruso. 2015. Neighborhood green and services diversity effects on land prices: Evidence from a multilevel hedonic analysis in Luxembourg. Landscape and Urban Planning, 143:100–111.
Guo, Y. and C. Bhat. 2007. Population synthesis for the microsimulating travel behavior. Transporta-tion Research Record: Journal of the TransportaTransporta-tion Research Board, 2014:92–101.
Hesse, M. 2014. On borrowed size and flawed urbanization: e exceptional urbanism of Luxem-bourg, Luxembourg. European Urban and Regional Studies, 23(4):612–627.
Horni, A., K. Nagel, and K. W. Axhausen. 2016. e multi-agent transport simulation matsim. Lon-don: Ubiquity Press.
Huang, Z. and P. Williamson. 2001. A comparison of synthetic reconstruction and combinatorial op-timisation approaches to the creation of small-area microdata. Working paper 2001/2, Department of Geography, University of Liverpool, Liverpool, England.
Hurtubia, R., O. Gallay, and M. Bierlaire. 2010. Attributes of households, locations and real-estate markets for land use modeling. Technical report, EPFL, Lausanne, Switzerland.
Langers, J. and F. Peltier. 2010. Projections socio-économiques 2010-2060. Luxembourg: Bulletin du Statec, 5-2010.
Lemoy, R., C. Raux, and P. Jensen. 2016. Exploring the polycentric city with multi-worker households: An agent-based microeconomic model. Computers, Environment and Urban Systems, 62:137–143. Lenormand, M., S. Huet, and F. Gargiulo. 2014. Generating French virtual commuting networks at
the municipality level. e Journal of Transport and Land Use, 7(1):43–55.
Lord, S., M. Frémond, R. Bilgin, and P. Gerber. 2015. Growth modelling and the management of urban sprawl: uestioning the performance of sustainable planning policies. Planning eory and Practice, 16(3):385–406.
Lord, S. and P. Gerber. 2009. Immigration et intégration : Trajectoires résidentielles (inter)nationales et dynamiques ségrégatives locales au Luxembourg. Espace Populations Sociétés, 2009(1):85–103. Müller, K. and K. Axhausen. 2011. Population synthesis for microsimulation: State of the art. In
Pro-ceedings of the 90th Annual Meeting of the Transportation Research Board. Washington, DC: Trans-portation Research Board.
Omrani, H., O. Charif, P. Gerber, A. Awasthi, and P. Trigano. 2013. Prediction of individual travel mode with evidential neural network model. Transportation Research Record: Journal of the Trans-portation Research Board, 2399(1):1–8.
. O’Sullivan, D. 2009. Changing neighborhoods - neighborhoods changing: A framework for spatially
explicit agent-based models of social systems. Sociological Methods & Research, 37(4):498–530. Peltier, F. 2011. Projection des ménages privés et des besoins en logements 2010 - 2030. Luxembourg:
Économie et Statistiques. Working papers du STATEC.
Pritchard, D. R. and E. J. Miller. 2012. Advances in population synthesis: Fitting many attributes per agent and fitting to household and person margins simultaneously. Transportation, 39(3):685–704. Schiebel, J., H. Omrani, and P. Gerber. 2015. Border effects on the travel mode choice of resident and crossborder workers in Luxembourg. European Journal of Transport and Inastructure Research, 15(4):570–596.
Schindler, M. and G. Caruso. 2014. Urban compactness and the trade-off between air pollution emis-sion and exposure: Lessons from a spatially explicit theoretical model. Computers, Environment and Urban Systems, 45:13–23.
Schindler, M., G. Caruso, and P. Picard. 2017. Equilibrium and first-best city with endogenous expo-sure to local air pollution from traffic. Regional Science and Urban Economics, 62:12–23.
Schmitz, F. 2012. Évolution des émissions dec o2liées aux déplacements domicile-travail des frontal-iers travaillant au Luxembourg. Technical Report Working paper 2012-37, CEPS/INSTEAD, Lux-embourg.
Southworth, M. 1997. Walkable suburbs? An evaluation of neotraditional communities at the urban edge. Journal of the American Planning Association, 63(1):28–44.
Spielauer, M. 2009. u’est-ce qu’une microsimulation dynamique en sciences sociales? Technical report, Statistics Canada, Modeling Division, Ottawa, Ontario, Canada.
Sprumont, F., F. Viti, G. Caruso, and A. König. 2014. Workplace relocation and mobility changes in a transnational metropolitan area: e case of the University of Luxembourg. Transportation Research Procedia, 4:286–299.
omas, I., J. Jones, G. Caruso, and P. Gerber. 2018. City delineation in European applications of LUTI models: Review and tests. Transport Reviews, 38(1):6–32.
van Wee, B. 2015. Toward a new generation of land use transport interaction models: a viewpoint. Journal of Transport and Land Use, 8(3):1–10.
Varrette, S., P. Bouvry, H. Cartiaux, and F. Georgatos. 2014. Management of an academic HPC cluster: e UL experience. In Proc. of the 2014 Intl. Conf. on High Performance Computing & Simulation (HPCS 2014), pp. 959–967. Bologna, Italy: IEEE.
Wegener, M. 2004. Overview of land-use transport models. In D. Henscher and K. Button, eds., Transport geography and spatial systems. Handbook 5 of the Handbook in Transport, pp. 127–146. Kidlington, UK: Pergamon/Elsevier Science.
Wegener, M. 2011. From macro to micro? How much micro is too much? Transport Reviews, 31:161– 177.
Wegener, M. and F. Fürst. 1999. Land-use transport interaction: State of the art. Technical report, Institut für Raumplanung, Universität Dortmund, Dortmund.