HAL Id: tel-01266656
https://tel.archives-ouvertes.fr/tel-01266656
Submitted on 3 Feb 2016HAL is a multi-disciplinary open access archive for the deposit and dissemination of sci-entific research documents, whether they are pub-lished or not. The documents may come from teaching and research institutions in France or abroad, or from public or private research centers.
L’archive ouverte pluridisciplinaire HAL, est destinée au dépôt et à la diffusion de documents scientifiques de niveau recherche, publiés ou non, émanant des établissements d’enseignement et de recherche français ou étrangers, des laboratoires publics ou privés.
urban theory
Rémi Louf
To cite this version:
Rémi Louf. Wandering in cities : a statistical physics approach to urban theory. Mathematical Physics [math-ph]. Université Pierre et Marie Curie - Paris VI, 2015. English. �NNT : 2015PA066359�. �tel-01266656�
THÈSE DE DOCTORAT
DE L’UNIVERSITÉ PIERRE ET MARIE CURIE
Spécialité : Physique
École doctorale : « Physique en Île-de-France »
réalisée
à l’Institut de Physique Théorique
présentée par
Rémi Louf
pour obtenir le grade de :
DOCTEUR DE L’UNIVERSITÉ PIERRE ET MARIE CURIE
Sujet de la thèse :
Wandering in cities
A statistical physics approach to urban theory
soutenue le 20 octobre 2015
devant le jury composé de :
M.
Alain Barrat
Examinateur
M.
Marc Barthelemy
Directeur de thèse
M.
Michael Batty
Examinateur
M.
Pablo Jensen
Membre invité
M.
Renaud Lambiotte
Rapporteur
M.
Jean-Pierre Nadal
Examinateur
WA N D E R I N G I N C I T I E S A statistical physics approach to urban theory
Jazz is not dead, It just smells funny.
—
À mes parents,
Qui ont toujours placé l’éducation avant tout. À tous mes enseignants :
A B S T R A C T
The amount of data that is being gathered about cities is increasing in size and specificity. However, despite this wealth of information, we still have little un-derstanding of what really drives the processes behind urbanisation. In this thesis we apply some ideas from statistical physics to the study of cities.
We first present a stochastic, out-of-equilibrium model of city growth that describes the structure of the mobility pattern of individuals. The model ex-plains the appearance of secondary subcenters as an effect of traffic congestion. We are also able to predict the sublinear increase of the number of centers with population size, a prediction that is verified on American and Spanish data.
Within the framework of this model, we are further able to give a prediction for the scaling exponent of the total distance commuted daily, the total length of the road network, the total delay due to congestion, the quantity of CO2
emitted, and the surface area with the population size of cities. Predictions that agree with data gathered for U.S. cities.
In the third part, we focus on the quantitative description of the patterns of residential segregation. We propose a unifying theoretical framework in which segregation can be empirically characterised. We propose a measure of inter-action between the different categories. Building on the information about the attraction and repulsion between categories, we are able to define classes in a quantitative, unambiguous way. The framework also allows us to identify the neighbourhoods where the different classes concentrate, and characterise their properties and spatial arrangement. Finally, we revisit the traditional di-chotomy between poor city centers and rich suburbs; we provide a measure that is adapted to anisotropic, polycentric cities.
In the fourth and last part, we present the most important results of our studies on spatial networks. We first present an empirical study of 131 street patterns across the world, and propose a method to classify the patterns based on the geometrical shape of the blocks. We then present a cost-benefit analysis framework to understand the properties and growth of spatial networks. We introduce an iterative model that can explain the emergence of a hierarchical structure (‘hubs and spokes’) in growing spatial networks. Starting from the cost-benefit framework of this model, we finally show that the length, number of stations and ridership of subways and rail networks can be estimated know-ing the area, population and wealth of the underlyknow-ing region.
Throughout this thesis, we try to convey the idea that the complexity of cities is – almost paradoxically – better comprehended through simple approaches. Looking for structure in data, trying to isolate the most important processes, building simple models and only keeping those which agree with data, consti-tute a universal method that is also relevant to the study of urban systems.
P U B L I C AT I O N S
Most of the ideas and figures presented in this thesis have appeared previously in the following publications:
[1] Rémi Louf, Pablo Jensen, and Marc Barthelemy. Emergence of hierarchy in cost-driven growth of spatial networks. Proceedings of the National Academy of Sciences, U.S.A., 110(22):8824–8829, 2013.
[2] Rémi Louf and Marc Barthelemy. Modeling the polycentric transition of cities. Physical Review Letters, 111(19):198702, 2013.
[3] Rémi Louf and Marc Barthelemy. How congestion shapes cities: from mobility patterns to scaling. Scientific Reports, 4:5561, 2014.
[4] Rémi Louf, Camille Roth, and Marc Barthelemy. Scaling in transporta-tion networks. PLOS ONE, page 0102007, 2014.
[5] Rémi Louf and Marc Barthelemy. Scaling: lost in the smog. Environment and Planning B: Planning and Design, 41(5):767–769, 2014.
[6] Rémi Louf and Marc Barthelemy. A typology of street patterns. Journal of The Royal Society Interface, 11(101):20140924, 2014.
[7] Rémi Louf and Marc Barthelemy. Patterns of residential segregation. Submitted, 2015.
This thesis was the occasion to study other topics, that I chose not to ad-dress in the present dissertation. Some of this work appeared in the following publication:
[8] Christian Borghesi, Laura Hernández, Rémi Louf, and Fabrice Ca-parros. Universal size effects for populations in group-outcome decision-making problems. Physical Review E, 88(6):062813, 2013. Parts of the work presented here will also be the subject of a book that is being written concurrently with this dissertation
[9] Marc Barthelemy and Rémi Louf. Morphogenesis of Urban Networks. Springer, 2016.
A C K N O W L E D G E M E N T S
I had the idea that the world’s so full of pain it must sometimes make a kind of singing.
— Robert Hass, Faint Music [109] I would first and foremost like to express my gratitude to Alain Barrat, Michael Batty, Pablo Jensen, Renaud Lambiotte, Jean-Pierre Nadal and Lena Sanders for accepting to be in my thesis committee. I can only imagine how daunting reading a PhD thesis must be, and I am really grateful for their time and for helping me to jump over this last hurdle. I sincerely hope this was not as awful as reading a 200 pages document (written by a student) sounds.
Thank you, also, to the Institut de Physique Théorique. By that, I mean its director Michel Bauer, the PhD coordinators Olivier Golinelli and Stéphane Nonnenmacher, and the incredibly efficient (and kind!) administrative and IT staff.
This thesis would not have been the same without the supervision of Marc Barthelemy. I still remember the sunny, winter morning of 2012 when the bus droppped me in the middle of nowhere, not far from the Institut de Physique Théorique. The fields were frozen, and vaguely white. I remember thinking, as I stepped out of the bus and felt the cold air biting my face, that this was going to be temporary. Needless to say, I did not sign up for three more years because of my love of long commutes, or the (too) familiar smell of the RER B. Neither was it for the office with a view, not on the fields—or the odd rabbit coming out of the nearby forest—, but on a brick wall. And faded flowers.
Now that this thesis is coming to end, I do know why I stayed, what I am grateful for. I am grateful to Marc for his trust, and for giving me the appreci-ated freedom to choose and explore the topics I liked. I am thankful, not only for his scientific supervision, our insightful discussions, but also for teaching me the things that cannot be found in textbooks: how to navigate the research world. Marc also knew when to push me and how to push me, and this is hope-fully reflected in the work presented here. I am greatly indebted to him.
Je tiens à remercier mes parents, sans qui, plus encore que toutes les person-nes sus-citées, cette thèse n’existerait pas. Souvent (!), on me demande: “Com-ment est-ce qu’un fils d’agriculteur fait pour devenir physicien?”. Je ne sais pas exactement, parce que c’est juste arrivé, et parce que cela a pris tant d’années. Je sais en revanche—c’est ce que je réponds souvent—que c’est que ça n’aurait ja-mais été possible sans vous, et l’éducation que vous m’avez donnée. Vous m’avez offert le plus beau et le plus utile des cadeaux. Merci. Je vous en suis infiniment reconnaissant.
and colleagues, for being there.
C O N T E N T S
i introduction 1
1 studying cities 3
1.1 We need data . . . 4
1.2 Cities as complex systems . . . 4
1.3 Layers and scales . . . 5
2 quantitative revolu tion(s) in urban science 9 2.1 The first quantitative revolution . . . 9
2.2 A second quantitative revolution? . . . 10
3 method olo gy 15 3.1 Of models and theories . . . 15
3.2 Quantitative stands for ’data’ . . . 16
4 about this thesis 21 4.1 Outline . . . 21
4.2 Miscellaneous notes . . . 22
ii polycentri-city 23 5 the (end of the) mono centric city 25 5.1 From monocentric to polycentric cities . . . 25
5.2 How to count centers . . . 30
5.3 The polycentric transition . . . 34
5.4 Summary . . . 37
6 how congestion shapes cities 39 6.1 Fujita and Ogawa . . . 39
6.2 Problems with the Fujita and Ogawa model . . . 42
6.3 Modeling mobility patterns . . . 43
6.4 Monocentric to polycentric transition . . . 45
6.5 Number of centers . . . 47
6.6 Conclusion . . . 48
7 discussion 51 7.1 Questioning and extending the model . . . 51
7.2 Shadows in the empirical picture . . . 53
7.3 Summary . . . 56
iii scaling 57 8 introduction 59 8.1 Probing cities with scaling laws . . . 59
8.2 A brief history of allometric scaling and cities . . . 62
8.3 Summary . . . 68
9 from mobility patterns to scaling 69 9.1 A naive approach . . . 69
9.2 Beyond naive scalings: modeling the mobility patterns . . . 76
9.3 Discussion . . . 80
10 interpretations and implications of scaling laws 87 10.1 What scaling laws tell us about cities . . . 87
10.2 What cities? . . . 90
10.3 Conclusion and perspective . . . 93
iv segregation 95 11 what segregation is not 97 11.1 Studying segregation . . . 97
11.2 Think first, measure later . . . 98
11.3 The dimensions of segregation . . . 98
11.4 The unsegregated city . . . 99
12 patterns of segregation 101 12.1 Introduction . . . 101
12.2 Presence of categories . . . 102
12.3 Measuring the attraction and repulsion of categories . . . 105
12.4 Emergent social classes . . . 107
12.5 Larger cities are richer . . . 109
12.6 Delineating neighbourhoods . . . 110
12.7 Poor centers, rich suburbs? . . . 116
12.8 Conclusion and perspective . . . 116
v urban net works 119 13 a typolo gy of street patterns 121 13.1 Streets versus blocks . . . 122
13.2 Characterizing blocks . . . 122
13.3 A typology of cities across the world . . . 126
13.4 A local analysis . . . 128
13.5 Discussion and perspectives . . . 128
14 cost-benefit considerations in the growth of spa-tial net works 131 14.1 The model . . . 133
14.2 Crossover between star-graph and Minimum Spanning Tree . 135 14.3 Spatial Hierarchy . . . 137
14.4 Efficiency . . . 143
14.5 Discussion . . . 147
15 scaling in transportation networks 149 15.1 Framework . . . 150 15.2 Subways . . . 151 15.3 Railway networks . . . 154 15.4 Summary . . . 158 vi conclusion 161 16 conclusion 163 16.1 Lessons learned . . . 164
contents xv
Part I
I N T R O D U C T I O N
We begin this part with a general introduction that stresses the ever growing importance of cities in the world, and highlights the difficulties encountered when trying to reach a scientific under-standing of these systems. We briefly outline the history of the quantitative tradition in the study of urban systems, and argue that we may be witnessing a second quantitative revolution. We then succintly present the methodology that we followed during the past 3 years, and end this part with an outline of the content presented in this thesis.
1
S T U D Y I N G C I T I E SChaos was the law of nature; Order was the dream of man. — Henry Adams [10]
Cities appeared some 10, 000 years ago [18, 163] concomitantly with the agriculture revolution, and really started to thrive after the industrial revolu-tion [18]. In England first, where the revolution was born; London was the first city in the modern world to reach 1, 000, 000 inhabitants at the beginning of the 19th century. The urban growth then slowly spread through the end of the 19th and the 20th to the rest of the Western world. Now, while western countries are already mostly urban (as of 2014, the United States’ population was 82% urban, Japan’s cities hosted 93% of the population, and most coun-tries in the European Union were around the 80% mark), most of what has
been dubbed the ’urban revolution’ is happening in developing countries. A Source: UN Population Division (2011) symbolic barrier was reached in 2005, when it was estimated by the U.N. that
more than 50% of the world total population was living in cities. It is not diffi-cult to convince oneself that urbanisation is not an accident in human history, and that cities’ influence and impact are not going to stop growing any time soon.
In fact, the impact of cities is already tremendous. First, they have a dis-proportionately large importance in the world’s economy. A 2012 report by McKinsey noted that while cities represented respectively 79% and 19% of the Unites States’ and India’s population, their share in the countries’ GDP was re-spectively 85% and 39%. Data from the NASA indicate that urban areas cover a total of 5% of the total land surface area in the world, roughly the equivalent of the superficy of the European Union. Yet, despite their little spatial fooprint, cities have a great impact on the environment. The United Nations indeed es-timated in 2011 that cities were responsible for 70% percent of the world’s CO2
emissions.
We could multiply the statistics, but the few examples given above should convince the reader of the importance to understand cities if we want to im-prove the world we built for ourselves. The dramatic growth of urban areas in developing countries brings unprecedented challenges. The cause, and the solution of some of the world’s most pressing challenges certainly find their origin in cities. By improving the way cities work, we can hopefully make dra-matic changes to the way people live. To be able to do so however, we first need to understand how they work.
1.1 we need data
Walk a few steps in your favourite city, feel the streets bustling all around you. The sound of the cars, of people chatting, the pavement lined with homoge-neously diverse buildings. The sense of familiarity we feel when stepping back in a city that was once our home, years later. And that smell you had forgotten you knew. Maybe the hardest thing, when studying cities, is the impression that we know them closely. The belief that our impression of what they are, the way we experience them, gives a true picture of what they really are, the purpose they serve. This familiarity is what makes the study of macroscopic, human-made systems so difficult compared to the study of natural systems.
There are indeed only so many ways one can get acquainted with, say, elec-trons, and therefore just so many things one can say about them. This, in a sense, makes the study of electrons easy. Think about cities now. All the mem-ories, habits, knowledge you have gathered over the years. As individuals, we know too many and too little things about them at the same time. We can have a very detailed recollection of the city we have experienced. But this informa-tion is not organised, and it is too local, too provincial. Therefore, we cannot infer what cities are solely from our own experience. We are a single piece of a puzzle that counts hundreds of thousands, millions of them, all with a different opinion of what their environment is like.
No, to understand cities, how they work as a system, we need to be told these thousands of stories, we need to analyse them and see how similar, or dissimi-lar they really are. To understand cities, we need data.
1.2 cities as complex systems 1.2.1 A paradigmatic example
Cities are paradigmatic examples of complex systems [128]. First, they com-prise thousands, millions of individuals that are moving and interacting con-stantly. Cities are indeed more than the mere agglomeration of residences, fac-tories and shops in the same region; they exist and thrive through the result-ing facilitated interaction between individuals [38,207]. Cities are built so that many people can live together and interact.
Second, cities are incredibly resilient systems. There are multiple examples in History of cities that were completely destroyed – Dresden and Hiroshima, for instance, completely burnt to ashes during WWII – but were later rebuilt and thrived again.
Finally, cities exhibit very particular shapes and behaviours. Because of these identifiable properties, they are patterns that stand out in their environment [66]. We can recognise cities because of their particular structure, even though the details of the structure differ from one city, country to another. The road net-work, for instance, is such that cities can be readily identified when looking at a map (even though the layout of say American cities is different from that of
1.3 layers and scales 5
most European cities). The high density of population, hence nightlights, also make urban environments identifiable on satellite pictures. These are two obvi-ous, visual particularities of cities, but some of their regularities are more sub-tle. In this thesis, we will be interested in some of these particular behaviours.
1.2.2 An organised complexity
The systems studied in Physics can be roughly divided in two categories [175] • Simple systems with only a few variables. Their dynamics is described by deterministic equations. For instance, the motion of planets can be described with high accuracy by General Relativity.
• Weakly, locally interacting systems, with a very large number of partic-ules. Their properties are described using probabilitistic language. For instance, monoatomic gases in usual conditions of pressure and temper-ature are well described by Statistical Mechanics.
Cities, however, do not fit in any of the above categories. They are clearly not simple, deterministic systems, and cannot be described in their entirety with only a few variables. On the other hand, the traditional approach of Statistical Mechanics is also bound to fail. Although they can contain several million of individuals, cities are not maximally disordered systems, and thus cannot be described in the same way we describe gases. Cities, while being disorganised, have structure. Our goal is to identify and quantify this structure.
At the individual level, interactions are weak: one individual is very unlikely to radically change the system’s dynamics. But the multiplication of individ-ual interactions can create robust and influent structures (the activity centers discussed in Chapterii, for instance).Interactions can occur locally – during face-to-face meetings – but also non-locally – through the phone, or the use of information systems. Individuals are not aimless particles, but usually have a purpose whenever they move. But at the same time, the sheer number of in-dividuals leaves room for unexpected situations and encounters. As a result, cities are neither completely organised systems, nor are they completely disor-ganised. They are thus very different to the kind of systems natural sciences have traditionally studied.
1.3 layers and scales
A first step in the identification of order consists in identifying the different spatial and temporal scales involved in the dynamics within and of cities. The goal of any theory of how cities work would be to understand the phenomena occuring at each scale, to understand how scales interact with one another, and to establish a hierarchy of mechanisms, as in natural sciences [210].
1.3.1 Layers
At the smallest scale, we have the individuals who live in urban systems. They make decisions about where they live, where they work, etc. and interact con-stantly with one another. Individuals are, in a way, the building blocks of cities, and it is therefore crucial to understand the way they interact with their envi-ronment to understand the structure and behaviour of cities.
At a larger scale, cities can be considered as systems characterised by spe-cific behaviours [39]. Besides, they do not evolve in isolation and belong to larger scale structures. To quote the geographer B.J.L. Berry, ‘cities [are] sys-tems within syssys-tems of cities’ [34], and their interactions—migrations, com-modity and capital flows—ought to constrain their evolution [184].
Finally, there is a great amount of evidence to show that systems of cities also exhibit very particular behaviours: the rank-size plot of the population of cities that belong to these systems is indeed strikingly regular (a regularity known as ‘Zipf ’s law’), and breaks down for other geographical units or when the chosen set of cities is not geographically and economically coherent [64].
Microscopic
Individuals
Mesoscopic
Cities
Macroscopic
Systems of cities
Figure 1: Interactions at different spatial scales. Cities are the result of interactions occuring at different spatial scales. The movement and interactions of indi-viduals result in the properties of the city as a whole. But cities are not closed systems, and interact with other cities in a system of cities.
Cities are therefore the result of interactions occuring at different spatial scales. Furthermore, they are not static: they evolve in time, through various processes taking place at different time scales.
1.3.2 Time scales
First we have time scales of the order of a day, which span the daily commut-ing of inhabitants. This incessant movement of people has been traditionally explored through surveys, but new data now allow more thorough studies. The digital traces that are left by people at all times (through their mobile phone, metro pass or GPS device) indeed allow us to explore the structure of flows and the pace of life in cities at unprecedently fine spatial and time resolutions.
Then, at the order of a year one can see the variation in terms of wealth, population, etc. of cities, as recorded by statistical agencies. Data about
demo-1.3 layers and scales 7
graphic, social and economic aspects of urban systems allow us to characterise more specifically the structure and behaviour of these systems.
Finally, at time scales of the order of a decade, we can see the city’s infrastruc-ture as well as its spatial footprint evolve. The study of the underlying processes is made possible by various projects lead by the GIS community, historians and geographers which aim at digitizing historical maps of the road and rail networks in different regions of the world. Also, since the 1970s, many satel-lites have been taking pictures of the Earth’s surface, and the remote sensing community has been treating these data to get information about the spatial extension of cities. These data should give us some insight about the processes responsible for the long-term evolution of cities’ structure.
Mobility Socio-economic
phenomena Spatial footprintNetworks
Figure 2: Different time scales. The various data available about cities are associated with different time scales.
These time scales are summarised on Fig.2. The long-term goal of our stud-ies is to understand exactly how citstud-ies and systems of citstud-ies behave, and how interactions between these three layers lead to the behaviours we observe.
2
Q UA N T I TAT I V E R E V O L U T I O N ( S ) I N U R B A N S C I E N C EAnd the first one now Will later be last For the times, they are a-changin’ — Bob Dylan It is difficult to make a concise summary of what is known and not known about urban systems. The vast amount of knowledge that has been gathered so far seems very little in comparison to the bewildering complexity of the object being studied [26]. Every map, every satellite view, every statistic, every step in cities elicits a question yet to be answered. What do we have to answer them? A surprisingly small array of empirical tools and models. A surprisingly small amount of solid, undisputed empirical facts.
Having said that, previous contributions are by no mean negligible. The body of quantitative knowledge about cities has dramatically grown since the quantitative revolution that took place in Geography after the 1950s.
People have recently suggested that we may be witnessing the dawn of a second quantitative revolution [28]. In the following Chapter, we will try to get some perspective on this claim, and see to what extent it is justified. We will start with a (very) brief account of the first quantitative revolution and the main themes around which it articulated knowledge (a more comprehensive account can be found in [200]). We will then critically review the factors usu-ally invoked to justify the use of the expression ’second quantitative revolution’. 2.1 the first quantitative revolution
Quantitative efforts in the study of human activities find their origin in Von Thünen’s model of agricultural land in 1826. More than a century later, in 1933, the German geographer Walter Christaller published his Central Place The-ory [58], which aimed at explaining the size and location of settlements in a system of cities. Needless to say, these early efforts are theoretical in nature, and the empirical aspect – studying things as they are – is left out. Likely be-cause of the lack of available data.
The quantitative effort really starts to spread in the US in the 1950-1960 [36]. From the very beginning, the objective to make geography a science is clearly stated, starting with the introduction of Bunge’s seminal Theoretical Geography, published in 1962 [52]. According to the author, geographers can and should go beyond the mere accumulation of facts, and try to discover the laws that rule the human and physical phenomena occuring on the Earth’s surface.
Bunge proposed geometry as a tool to understand the observed patterns and describe objectively the geographical space. The range of tools used quickly ex-panded [106,56], spanning stastistical models [125,51] – whose importance is demonstrated by the publication in 1969 of Leslie King’s Statistical Analysis in geography – and graph theory – as early as 1963 with the publication of Kan-sky’s PhD thesis [121]. An early review of the use of graph theory in geography can be found in Hagget and Chorley’s book [107].
The research undertaken in the quantitative tradition can be – tentatively – divided in three different categories. First, the study of spatial differentiation aims at characterising the spatial patterns that result from human activities. For instance, the study of population or employment densities (see Partii), the local concentration of population categories (see Partiv), or the repartition of cities inside a territory.
Second, the study of spatial interactions. The progressive realisation that dis-tance is a critical factor to understand the arrangement of different spatial phe-nomena led Tobler to state the First Law of Geography [221].
Everything is related to everything else. But near things are more related than distant things.
Linked to the study of spatial interactions is the (in)famous gravity model, which states that the flow Fi jbetween two locations i and j is given by a
func-tion of the form
Fi j= C PiαP β
j f(di j) (1)
where f is a decreasing function of distance. Although the analogy with Newton’s gravitation law was used by Reilly in 1931 to find the retail market boundaries between cities [192], the above formulation in terms of flows was formulated by Stewart in [215]. Note the competing existence of Stouffer’s the-ory of intervening opportunities [217], according to which the flow between i and j is proportional to the number of opportunities at j and inversely propor-tional to the number of opportunities between i and j. It was mathematically formulated much later by Simini et al. [208].
Finally, the study of infrastructure, which started with Kansky in 1963 [121]. The study of the shape and growth of road networks, railway networks and other infrastructure has recently witnessed a renewed interest thanks to the study of spatial networks [22].
2.2 a second quantitative revolution?
People can be forgiven for believing that the present time bears any sort of spe-cial character. But when we look closely enough, the change is perpetual, and what is new now will be outdated tomorrow. During the past 3 years, I have at many times overheard discussions about the fact that we were currently wit-nessing a ’second quantitative revolution’ in the study of geographical systems.
2.2 a second quantitative revolution? 11
But is it really the case? What differences with past tools or methods could jus-tify such a claim? In the following, we explore the three following hypotheses
• The new quantitative revolution is due to the use of new methods com-ing from interdisciplinary studies;
• The new quantitative revolution is due to the availability of ‘new data’; • The new quantitative revolution is due to a technological convergence. 2.2.1 New methods
The recent years have seen the application of new methods, mainly coming from Physics or Computer Science, to the study of cities [73]. Either by geog-raphers, or outsiders who imported well-established methods from another field [25]. These collaborations, or incursions, are however not new. For in-stance, John Stewart, an american astrophysicist is famous for the first use of allometric scaling in the study of cities [214], or for his work on the gravitation model [215]. Another interesting example is given by the collaboration in 1971 between Waldo Tobler – a geographer – and Leon Glass – a chemist – who plot the radial distribution function of Spanish cities, a method that is traditionally used to study the property of liquids [101].
So, the application of well-established methods from other fields to cities is not new, and neither are the contributions made by outsiders. Yet, we can iden-tify two qualitative changes: the number, and nature of these contributions. If some authors have continued to import directly methods and models from other disciplines (for instance, the use of diffusion-limited aggregation mod-els, traditionally studied in physics, to explain the growth of cities [144]), this type of theoretical contribution is becoming marginal. Contributions are more and more empirical; and if theoretical, are not direct applications of another domain’s theories. For instance, Rozenfeld and co-authors used percolation on census tracts to define cities [196] in an original way. Masucci et al. use percola-tion on the road network for the same purpose [153], while Li et al. use percola-tion to study the properties of congespercola-tion [139]. New approaches to spatial net-work [22] have yielded new insights into the structure and evolution of road, railway and subway networks [218,24,1,4,6]. Original out-of-equilibrium models that are inspired by the studied system allow a better understanding: Simini’s radiation model [208,209] – which is nothing else that the mathemati-cal transposition of Stouffer’s intervening opportunities theory – or our model to explain the polycentric transition of cities [2] are examples of such models. Not to forget the important literature on scaling relationships [39,38,3,16,5], and other empirical analyses – such as the study of residential segregation we present in Partiv.
At the same time, the number of contributions to the field from authors who do not have a geography (or economics, urbanism, etc. for that matter) affili-ation seens to have increased over the past years. After all, I am a theoretical physicist by training, and this thesis is officially a Theoretical Physics thesis. So,
if the contributions of outsiders are not new, they are changing in number and nature. To the point where we can wonder whether some of these ‘outsiders’ should still be considered as such.
2.2.2 New data?
Besides the import of methods from other disciplines, it is often argued that the influx of new data, thanks to the digitization of our lives, is a revolution in itself.
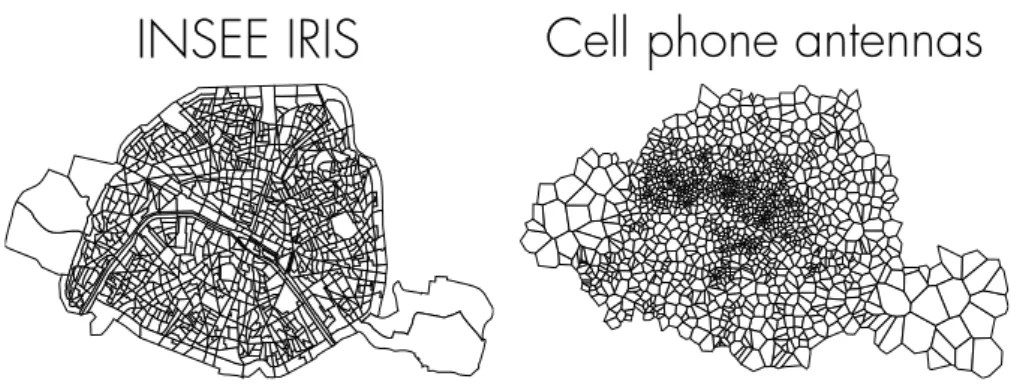
The most important new source of data come from the wide use of mobile phones across the world [102,84]. They consist, for each individual, of a list of antenna locations to which the individual was the closest at a given time (either when she used the phone, or when she switched from an antenna to another). Naively, one could think that mobile phone data are better than census-based data: they give a continuous information about the flow of individuals within the city (and are not limited to commuting), they cover a larger part of the pop-ulation (which is critical in developing countries: censuses are not widely used due to the costs involved, but mobile phones have a high penetration rate), and are more spatially precise than released census data in urban areas (see Figure3
for a comparison between the smallest INSEE areal units, and mobile phone antennas in Paris). But one needs to be careful. If mobile phone data are fine to monitor aggregate quantities (such as origin-destination commuting matri-ces [133], to map population changes during the day [141], or year [68]), one should be careful with the study of individual trajectories (such as in the sem-inal [102,211,212]). Indeed, the fact that positions are recorded every time a call is made by the user – events with a powerlaw inter-event time [211] and probably correlated with locations – is likely to introduce an important biais in the obtained trajectories. Not mentioning the spatial sampling introduced by the fact that positions are attached to a finite number of antennas. Unfor-tunately, no study has looked at the impact of these two types of sampling on the properties of the observed trajectories yet. In the meantime, one should refrain from using such data to study individual trajectories.
Mobile phone data are not the only ‘new’ source of data. Because mobile phones carry GPS chips that are used by applications such as FourSquare [167] or Twitter [134]. Last, but not least, credit card companies have recently started to release datasets regarding the spending of individuals [135].
So, new data (mainly mobile phone data) are now available and allow to give a picture of the city that was not accessible before. The contribution of these new data is particularly useful for the mobility of people besides commuting pattern [141], or for developing country where there are little census data avail-able [43]. Are they so overwhelmingly different from previously available data to deserve the title of ‘revolution’? Nothing is less certain: in this thesis, for instance, I have only used traditional data sources, and we are still waiting for important results that ‘new data’ could teach us (and that we could not access
2.2 a second quantitative revolution? 13
INSEE IRIS
Cell phone antennas
Figure 3: (Left) IRIS zones in Paris, the smallest statistical units defined by the national statistics institute, INSEE. (Right) Voronoi tessellation built from the posi-tion of antennas of a popular french mobile phone carrier. There are 40% more antennas than there are IRIS, and they tend to be more concentrated in zones of high daily activity (8th and 9th arrondissements).
with more traditional data). Only time will tell, and the term ‘revolution’ is not warranted yet.
2.2.3 A technological convergence
Interdisciplinary collaborations already existed, data were already there. So what is the qualitative difference between the state of the field say 20 years ago, and the state of the field as it is now, if any? A factor that is often overlooked is the recent technological leap in the treatment of information, including spa-tial information. Thanks to the development of GIS software as well as spaspa-tial databases and libraries, the treatment of geographical data has never been sim-pler. Added to this is the emergence of powerful scripting languages, R and Python, which allow to quickly implement complex data analysis workflow or simulations, and reduce dramatically the time spent writing code.
Internet is also progressively changing the way research is done. Census data are more and more easily accessible available online. Open data repositories, al-though far from perfect, are emerging. Online platforms such aswww.github. comallow to share and collaborate on code. All in all, the access and processing of information is getting easier and easier.
Taken individually, the introduction of methods from other disciplines, the increasing amount and specificity of available data and the technological progress in the treatment of information are probably not enough to justify the term ‘revolution’. Taken together, however, they could mark the beginning of a
qual-itative rupture in the way we understand cities.
It is too premature to conclude that the convergence of the aforementioned will necessarily deeply change our understanding of cities. Only the future can tell us whether new regularities, new laws are about to be discovered and more phenomena to be understood. But where there is data, there is hope. As long as the correct methodology is followed.
In the following Chapter, we will introduce the broad methodological prin-ciples that we adopted during this thesis.
3
M E T H O D O L O G YIf it disagrees with experiment, it’s wrong. In that simple statement is the key to Science. — Richard Feynman [86] The success of natural sciences lies in their great emphasis on the role of quantifiable data and their interplay with models. Data and models are both necessary for the progress of our understanding: data generate stylized facts and put constraints on models. Models on the other hand are essential to com-prehend the processes at play and how the system works. If either is missing, our understanding and explanation of a phenomenon are questionable. This issue is very general, and affects all scientific domains, including the study of cities.
Until recently, the field of urban economics essentially consisted in untested laws and theories, unjustified concepts that supersede empirical evidence [44]. Without empirical validation, it is not clear what these models teach us about cities. The tide has turned in recent years, however: the availability of data is increasing in size and specificity, which has led to the discovery of new stylized facts and opened the door to a new science of cities [28]. Yet, the situation is not perfect: while the recent deluge of data have triggered the apparition of many empirical analyses, in the absence of convincing models to explain these regularities, it is not always clear what we learn about cities.
In this chapter, we will try to specify what we mean by model, and explain with a concrete example why data analysis is not enough understand the be-haviour of systems.
3.1 of models and theories 3.1.1 For what purpose?
As scientific sceptics often like to remind us, all models, all theories are wrong. But surely, there must be some interest in models to make them deserve the months, sometimes years of work that scientist devote to them.
Models’ two main functions are, broadly speaking, to understand, and to predict. The benefits linked with the ability to predict the behaviour of a sys-tem need not be recounted. Understanding is a more complicated notion, and a philosophical discussion of the concept lies far beyond the scope of this the-sis. Roughly, to understand is to untangle the mechanisms involved so as to have a simplified, barebone description of the processes that shape the system.
3.1.2 Theory, not analogy
Unfortunately, expressive words and metaphors are too often used as a substi-tute for a real understanding of the system. But, however intellectually appeal-ing they are, metaphors are not a theory. For instance, what do we understand from the comparison of cities with biological systems? What new knowledge do we gain? Metaphors do not provide interesting ideas that are ready to be ap-plied to a specific field. Rather, they trigger very different ideas into different people, which explains their recurrent success. Yet, what we need to highlight are regularities, not similarities.
We also need to avoid models that are only loosely connected to reality, anal-ogy or metaphor. There is a lot of confusion, and little understanding to be gained that way. In the words of Einstein, Podolsky and Rosen
In a complete theory, there is an element corresponding to each element of reality. [79]
In this thesis, we tried to make sure that most – if not all – elements (vari-ables) of our models are related to a quantity that is measurable. We also paid a special attention to the rigour in the language used. We qualify suggestions, by presenting them as such. This kind of work may be less suggestive, the vo-cabulary used less expressive, but it is a necessary step towards a science of cities. We need to clear the language of unfruitful metaphors and fill the gap with mechanisms.
3.2 quantitative stands for ’data’
Richard Feynman’s statement used as an epigraph in this chapter might be an oversimplified, narrow view of what Science is and how it proceeds. It never-theless hits the nail right in the head, by isolating the core component of what Science is: a tight relation with empirical analysis. Data are needed, at first, to give us ideas about how the system works: stylized facts. We then usually try to build a simplified version of the system, a model, that is able to reproduce the stylized facts. Because of the simplification entailed, the model highlights the most important features of the phenomenon and allows us to understand the behaviour of the system. Finally, we use data again to test the predictions of the model and assess its validity and/or limitations.
In this thesis, we adopt a quantitative approach to the the study of cities. In other words, we extract information about urban systems using measured quantities: data. As we will argue in the next section, however, data are not enough.
3.2.1 Against data
In ‘Againt Method’, the philosopher of science Paul Feyerabend argued against the idea that Science proceeds through the application of a single, monolithic
3.2 quantitative stands for ’data’ 17
method; what people usually call ‘The Scientific Method’ [85]. The reference is not innocent, and I will argue here that, although empirical analysis constitutes the alpha and the omega of our enquiry for knowledge, data are not enough. There is common confusion, often innocent, that because data are at the core of scientific enquiry, one only needs data analysis to understand how a system works and predict its behaviour – especially so when we have a lot of data. A very extreme view of this statement has recently been put forth by Big Data supporters. An article in the magazine ‘Wired’ [14] recently argued that the current deluge of data marked the end of Science as we know it. That models were not necessary anymore, that they were to be replaced with the extensive correlation analysis that a vast amount of data allow. This view is completely misguided.
For one, pure data analysis is, at best, a myth: as Pierre Duhem argued in 1906 [71], all empirical observations are theory-laden. That is, they are neces-sarily affected by the theoretical presuppositions held by whoever is making the observation. Measuring the population of a city, for instance, presupposes that there are such objects as cities, and that we can delineate them. A deluge of data does not relieve the investigator from defining the objects she is studying, from implicitely thinking about the relation between the different elements in the system.
Then, correlations are science, indeed. But they are rudimentary science, and there is nothing new about them. Arguably, the reason why we are able to function at all as individuals is because our brain is capable of computing correlations all the time. Take chairs. Chairs are fairly simple objects. Yet, they come in all kind of colors, material and shapes. And despite this potentially in-finite diversity, we are able to recognise a chair when we see one. We also have a notion of what a chair is to be used for. Although we do not ackowledge it of-ten, we are capable of surprisingly high levels of abstraction and generalisation. Because our brains correlate, all the time.
Science starts with the observation of these regularities. For instance, that the sun always appears at the same place and disappears in the opposite direc-tions. That seasons come and go regularly. That after the night always comes the day. Are pure correlations useful? Yes, for limited applications. Do they constitute science? No. Science is when one goes beyond the simple observa-tion of correlaobserva-tions, and tries to understand the mechanisms responsible for the correlations we observe.
In short, data is not enough: we must build models, theories. 3.2.2 An example: The law of metropolises
3.2.2.1 Statement
The above discourse may seem a bit abstract, so let us observe the shortcom-ings of pure data analysis on a simple example, related to cities.
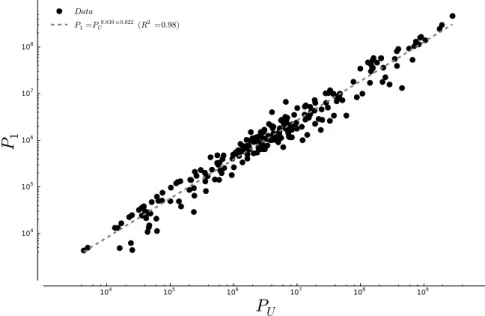
104 105 106 107 108 109 PU 104 105 106 107 108 P1 Data P1=PU0.839 ±0.022(R2=0.98)
Figure 4: The law of metropolises. Population of the largest city of systems of cities P1 versus the total urban population Puin that system. The dashed line shows the result of a powerlaw fit, whose exponent agrees well with the one found in [186]. Data for the total urban population and the population of the largest city of countries in the year 2000 were obtained from the World Bank.
Using the GEOPOLIS database, Moriconi-Ebrard and Pumain derived a general transversal rule about system of cities, that they called law of metropolises [186]. If we note PU the urban population of systems of cities (here countries), and
P1the size of their largest city , we can plot P1versus PU for all systems of cities
The original regularity was observed for what the author calls ’metropolises’, which are roughly equivalent to the largest city in terms of population.
and obtain the plot on Figure4.
Assuming a powerlaw relationship between the two quantities, one finds
P1∼ PU0.84(r2= 0.98) (2)
which agrees very well with the empirical data (for all years where data are available). It is tempting, at first, to consider this as yet-another emprical regu-larity exhibited by urban systems, and try to find a coherent interpretation in geographical terms. However, as we will show, if we assume that the Auerbach-Zipf law [17,234] holds for each system of cities individually
1. We can derive a relation that fits the data as well as Eq.2; 2. The relation is not a powerlaw.
3.2.2.2 Deriving the ‘law of metropolises’
Let us consider a system of cities comprised ofN cities, with total population PU. The size of the largest city is noted P1. We assume that the distribution
of city sizes follows the Auerbach-Zipf law, so that the city of rank r (the rth largest city) has a population
3.2 quantitative stands for ’data’ 19
Pr = P1r−µ
So the total population in the system of cities can be written
PU = N ∑ r=1 Pr= P1 N ∑ r=1 1 rµ (3)
If we assume thatµ= 1, PU is given by the harmonic series, and thus
PU = P1[ln(N) + γ + O ( 1
N)] (4)
where γ ≈ 2.58 is Euler’s constant. This gives us a first relation between P1,
PU and N.
Still using the assumption that the distribution of city size follows the Auerbach-Zipf law with µ = 1, we can show (using extremal value theory) [60] that on
average the size of the largest city is proportional to the total number of cities ’Average’ as in
ensemble average P1∝ N
Thus, when the number of cities in the system is large, N≫ 1 the following relation holds
P1 ln(P1) = PU (5)
As one can see on Figure5, the formula given by Eq.5fit the data as well as the previous one.
It is therefore impossible to determine which of Eq.2or Eq.5describes the ‘true’ relation between P1and PUbased on data analysis alone. Nevertheless, the
later finds a very simple explanation in the fact that cities in systems of cities follow the Zipf-Auerbach law up to a good approximation. In the absence of any theoretical explanation for the powerlaw relationship and given the empir-ical equivalence of both forms, it least-assuming to consider P1ln P1∼ Pu.
3.2.2.3 Lessons learned
So, the law of metropolises is not a fundamental relation. This teaches us that, given the range of variation of the measured quantities, it is very difficult to distinguish empirically a powerlaw relationship from something qualitatively different such as Y ln Y ∼ P, as recently argued by Shalizi in [206]. One should therefore be wary of interpreting empirical relationships, like the one origi-nally found in [186], unless a mechanistic explanation of the fitted relationship is provided. As shown above, what was thought as a fundamental law might end up being trivial and without great interest.
We will further discuss the limitations of data analysis in Chapter10, after having studied scaling relationships.
104 105 106 107 108 109 PU 104 105 106 107 108 109 1010 P1 ln( P)1 Data P1ln(P1)=3.0 PU(R2=0.98)
Figure 5: The law of metropolises revisited. P1ln(P1) versus the total urban popula-tion Puin that system. The dashed line shows the result of a linear fit, which agrees as well with the data as does the powerlaw relation assumed in [186]. Data for the total urban population and the population of the largest city of countries in the year 2000 were obtained from the World Bank.
4
A B O U T T H I S T H E S I SAnybody can plan weird, that’s easy. — Charles Mingus The following thesis might surprise the reader used to the monographs usu-ally produced by PhD students in Social Sciences, articulated around a single, general question. The outline of this thesis reflects more the line of thoughts and of research that has been undertaken than the answer to a single question that would have been asked a priori and answered during the last three years. For that reason, the four Parts of this thesis are mostly independent. There is not single thread holding them together. But rather multiple wires; common themes and similar ideas.
4.1 outline
Partiitackles the problem of measuring and understanding urban form, an issue that has been running through the 3 years of my PhD. In this Part, we first (Chapter 5) present a brief historical overview of the monocentric and polycentric representations of the city, before enumerating the methods that are used in the literature to count the number of activity centers. We end with the observation that the number of activity centers increases in a regular way with population size. The following chapter (Chapter6) is devoted to an out-of-equilibrium model that we built in order to explain the previous empirical regularity. The model is able to predict the sublinear increase of the number of centers that we observe on American and Spanish data. In the last chapter (Chapter7), we question the assumptions of the model and the current empir-ical methods to quantify urban form.
Partiiiis concerned with scaling relationships. We first propose (Chapter8) a non-exhaustive overview of the dawn and surge of allometric scalings, from Stewart’s 1949 to the recent wealth of studies. Then, using the model devel-opped in the preceding part, we show in Chapter9how the structure of mobil-ity patterns allow us to understand the qualitative and quantitative values of the exponents related to urban form and mobility. We conclude this part with a discussion on the interpretation of these scaling laws, and their important shortcomings (Chapter10).
Partivdeparts from the preceding chapters and turns to the study of res-idential segregation. Driven by the desire to extend the model presented in Chapter6, we soon realised there was a lack of robust empirical description of patterns of segregation that could be reproduced by a model. In Chapter11we
tackle the problem of defining what segregation is; we propose a brief review of the existing literature, and subsequently define a null model – the segregated city. In the next chapter (Chapter12), we build on this null model to propose a set of measures to quantify patterns of residential segregation.
Partvconcerns the original topic of this thesis: spatial networks. Because my interests have shifted towards the study of socio-economical phenomena over the years, we only briefly present the most important results in the present the-sis. The three chapters are, for the most part, reprints of articles that have been previously published in peer-reviewed journals. We first (Chapter13) present an empirical study of 131 street patterns across the world where we propose a method to classify the patterns based on the geometrical shape of the blocks. In the following chapter (Chapter14), we present a cost-benefit analysis frame-work to understand the properties and growth of spatial netframe-works. We intro-duce an iterative model that can explain the emergence of a hierarchical struc-ture (‘hubs and spokes’) in growing spatial networks. Starting from the cost-benefit framework of this model, we show that the length, number of stations and ridership of subways and rail networks can be estimated knowing the area, population and wealth of the underlying region.
Finally, Partvities everything together, highlights the lessons learned and concludes this thesis with some potentially interesting research avenues for the years to come.
4.2 miscellaneous notes 4.2.1 Style
I will be using the pronoun ’we’ for most of the manuscript, to reflect the fact that the work presented here was, for the most part, done in the context of collaboration with others. For the sake of clarity, the technical details of calcu-lations have been omitted in this manuscript. Most of these calcucalcu-lations are relatively simple anyway, and the interested reader can find them in the publi-cations mentioned on page2of this thesis.
4.2.2 Tools
Unless otherwise specified, all figures in this manuscript have been prepared using Python 2.7 1 and the Matplotlib library [112]. Inkscape 2 was used to
prepare most diagrams. This document was typeset using Vim and LATEX. The
template used is the typographical look-and-feelclassicthesisdeveloped by André Miede.3
1 Available athttp://www.python.org
2 Available athttps://inkscape.org/en/
Part II
P O LY C E N T R I - C I T Y
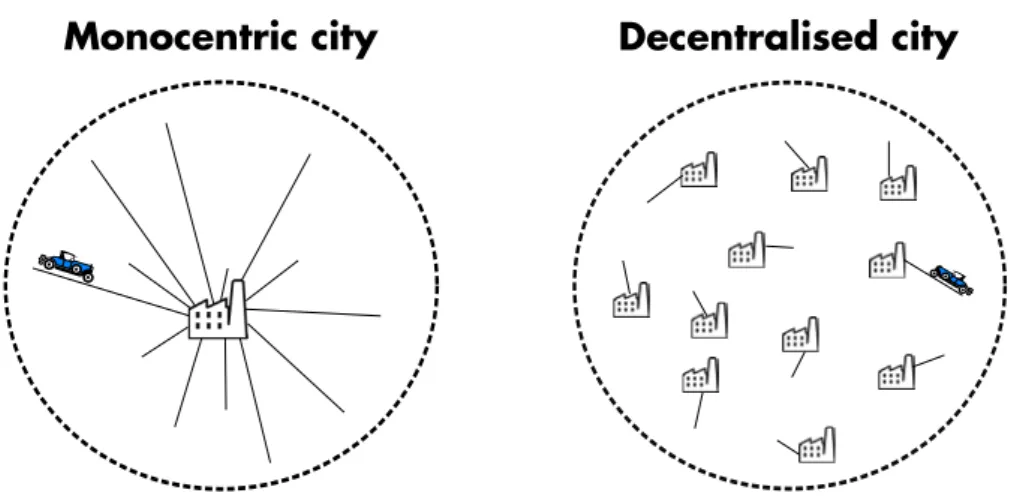
The monocentric model of cities – where all activities are organ-ised around a single activity center – has pervaded the literature on urban systems for more than 4 decades. However, as it was repeatedly demonstrated, the model is empirically inadequate. The contribution of this part is threefold. First, we recount the history of ideas about urban form, from the monocentric hypoth-esis and its origins, to the various methods proposed to identify and count subcenters. We then demonstrate empirically the exis-tence of a polycentric transition for cities, and that the number of centers increases as a sublinear function of population size. Fi-nally, we propose an out-of-equilibrium model that explains the emergence of new subcenters as cities expand, and predicts the sublinear increase of the number of centers with population size.
5
T H E ( E N D O F T H E ) M O N O C E N T R I C C I T YIt may be a small irony that just as the phenomenon of polycentricity is getting considerable attention,
The world is moving beyond it. — Peter Gordon & Harry Richardson [103] The hypothesis that cities organise themselves around a single center of ac-tivities – often called Central Business District (CBD) in the US – may well be one of the strongest hypotheses in urban studies. Although no one seriously believes in its validity anymore, its influence is still noticeable in many em-pirical and theoretical works. In order to deconstruct the monocentric model, we first need to understand where it came from in the first place, why it was introduced, and what evidence it was based on.
In this chapter, we present a historical perspective on the monocentric hy-pothesis. First, the context in which it was introduced, how it was gradually realised that cities had a decentralised structure, and the emergence of the no-tion of center. We then present a brief review of the methods and tools de-veloped to count their number. Finally, using American and Spanish data, we show that larger cities are more polycentric. This suggests the existence of a transition from a monocentric to a polycentric structure when the population of cities increases.
5.1 from monocentric to polycentric cities
Maybe the least assuming way to represent the density profiles in cities is through either choropleth maps, or 3-dimensional representations. On choropleth maps, the x and y coordinates correspond to the original coordinates projected on the plane. In the former case, the different values of density are expressed by the use of different colours. This approach can be traced back as far as 1898 in Meuriot’s Des agglomérations urbaines dans l’Europe contemporaine [159] who drew a large number of density maps of large Europen cities. He was later fol-lowed by Jefferson in 1909 [117] who did the same for several cities in the US, Europe and Australia.
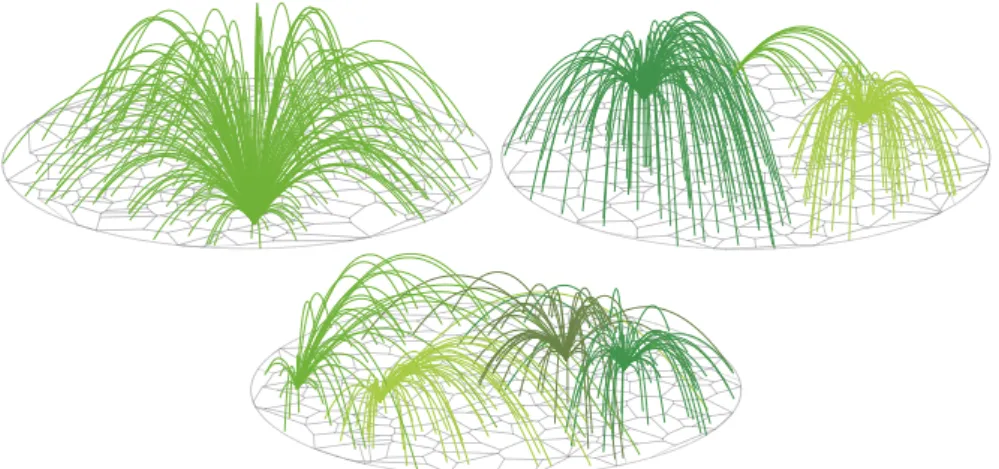
3-dimensional representations, on the other hand, use the z coordinate to the represent the density values. On Figure6we represent the density profiles of two metropolitan areas in the US: Minneapolis-St.Paul, MN and Houston, TX. These two cities are enough to illustrate the difficulties associated with studying density profiles.
Figure 6: 3D representations of densities. Residential and employment densities in (Top) the Metropolitan Statistical Area (MSA) of Philadelphia, PA and (Bottom) the MSA of Houston, TX. Employment and residential densities are represented at the same scale. Employment densities are sensibly more peaked than residential densities, suggesting that the notion of ‘center’ is more relevant in the context of activies. Data were obtained from the 2000 US Census.
5.1 from monocentric to polycentric cities 27
What densities we are talking about? People are constantly moving through-out the city during the day, and density profiles can only be (approximate) snap-shots of the city at different instants. Traditionally, scholars have only consid-ered residence densities (nightime city) and employment densities (daytime city). The recent availability of mobile phone data may however give us a more precise, continuous picture of the densities during the day [141]. In this part, we will be focusing on employment densities.
How can we makes sense of these density patterns? The densities represented on Figure6are indeed very complex, and we would like to isolate some par-ticular structure. Arguably, the notion of center stems from this desire to find some structure in the complex, messy empirical reality.
Realising that districts of large population tend to be central, and districts of small population in the periphery, Clark proposes in 1951 [59] to write the density ρ as a function of the distance d from the center
ρ= a e−d/b (6)
Where a is the density at the center, and b the typical distance over which the density decreases. To justify his assumption, Clark plots the population density of various cities as a function of the distance to the center [59]. Some structure was found. The monocentric hypothesis was born.
Looking at the density profiles plotted by Clark in 1951 [59] for many cities across the world, or on Figure7for the Minneapolis-St. Paul MSA, one can be forgiven for thinking that cities have a monocentric structure. Such profiles indeed almost always exhibit a sharp decrease as we go farther from the city center – defined here as the areal unit with the highest density.
However, density profiles are not enough to prove the existence of a mono-centric structure. Unless one other hypothesis is verified: namely that the pat-tern of employment densities is symmetric under rotations around the center. This is however never the case: cities are nowhere isotropic but in the imagi-nation of modelers. To make this point clearer, we show on Figure7both the density profile of the Minneapolis-St. Paul MSA and a map where we highlight in black the tracts with an employment density greater than 10000 km−2. As one can see, two tracts (respectively the historical centers of Minneapolis, and of St. Paul) are highlighted. However, the peak in density corresponding to St. Paul is not distinguishable on the density profile. Indeed, it is averaged out with smaller densities that are located at equidistance from Minneapolis. The decreasing exponential model, however appealing, is thus mispecified.
So why did Clark’s methods and plots did not become a simple curiosity, but were instead so widely adopted? Although it is sometimes difficult to trace back the reasons for the adoption of ideas, there is little doubt that the echo this idea had in urban economics had something to do with it (besides the simplic-ity of the hypothesis). Indeed, beginning as an implied assumption in Clark’s
St. Paul
Figure 7: The limitations of density profiles. Employment density as a function of distance to the center for the Minneapolis-St. Paul MSA in 2000. The center is defined here as the tract with the highest employment density, and corre-sponds to the historical Central Business District of Minneapolis. The curve exhibits a very sharp decay, giving the illusion of a monocentric structure. (Inset) The census tracts of Minneapolis-St. Paul in 2000. In black, the cen-sus tracts where the employment density reaches values above 10, 000 km−2
. The two tracts coincide with the historical centers of the Twin Cities, and are distant from 14 km. This fragmented structure cannot be infered from the density profile (arrow on the curve).
5.1 from monocentric to polycentric cities 29
empirical analyis, the monocentric hypothesis first became clearly stated in the theoretical work of economists.
The Alonso-Muth-Mills model (inspired by Von Thünen’s land rent model) might well be the reason for the long-lasting influence of the monocentric model1. In 1964, Alonso introduced the bid-rent curve as a function of the
distance to the city center [12]. The assumption that all firms in a city are con-centrated in a single, fixed-size part of the city naturally followed. Later, in 1967 and 1969, Mills [161] and Muth [164] show how we can can obtain an ex-ponentially decreasing function for the density as a function of the distance from the center, using the monocentric hypothesis. The monocentric Alonso-Muth-Mills (AMM) model was born, and was seemingly backed by empirical evidence.
One should not underestimate how the monocentric model influenced peo-ple’s perception of what a city is. In the US, the name of Central Business Dis-trict is casually used as a way to designate the principle activity center in a city. Many, if not most, measures of the spatial variation of quantities inside cities actually use the notion of ‘distance to the city center’. Many authors are relying on the monocentric hypothesis for their empirical analysis – sometimes with-out being aware of it. This biais can still be found in the recent literature. For instance, in a recent study by Glaeser, Kahn and Rappaport on the repartition of income classes in cities [100], the authors comment on plots of the average income as a function of the distance to the center. This only makes sense, how-ever, under the assumption of monocentricity.
This persistence of the monocentric hypothesis is all the more surprising that authors repeatedly suggested and showed that the hypothesis was not ad-equate. In 1974, Kemper and Schmenner [124] explore industry and employ-ment density data, trying to fit a negative exponential function. Their conclu-sion is clear: “A declining exponential function fails to explain much of the spatial variation of manufacturing density”. A few years later, Odland [168] ex-plores the possibility of polycentric cities on a theoretical basis. As explained in [104], scholars subsequently started to explore the density patterns of cities by fitting multi-center exponential functions of the form
ρi = q
∑
j=1
Aje−di j/bj (7)
where ρi is the density at location i, q the number of centers, Ajthe local
maximum of density at j, bjthe characteristic size of the center j, and di jthe
distance between locations i and j. The idea of polycentricity, originally as the generalisation of the monocentric hypothesis, is progressively gaining ground.
Trying to fit equations like Eq.7is cumbersome, and requires some a-priori knowledge of the density patterns. It requires to determine in advance which
parts of the cities are going to be subcenters , before attempting to fit the den- subcenter because they are subsidiary to the traditional CBD sity profile. As noted in [98], authors used arbitrary definitions of subcenters,
either designating them based on their own intuition, or refering to the centers defined by planning agencies. The centers were thus determined exogenously. In this context, the first definitions of employment centers independent from the exponential model start to emerge, and subcenters start an existence of their own. By the 90s, the idea that cities can be polycentric is well-established, and more and more empirical analyses confirm the existence of several employ-ment centers. For instance, McDonald [155] identifies the employment subcen-ters in the region of Chicago, IL; Giuliano and Small [98] in the region of Los Angeles, CA; Dokmeci et al. [70] show that Istanbul’s employment is spread across several centers, etc.
The concept of subcenters is further expanded in 1991 [95], when Garreau shows that secondary centers are not necessarily ‘subcenters’. Indeed, activi-ties do not always accumulate in the traditional downtown. He introduces the concept of ‘Edge cities’: the concentration of business, shopping and entertain-ment at the outskirts of cities, in regions that were previously rural, or purely residential.
5.2 how to count centers
The methods designed to identify employment subcenters can be divided in three categories. The clustering methods, which appeared first, were progres-sively abandonned for regression-based methods due to their reliance on arbi-trary cut-offs. Distribution-based methods have emerged recently, and leave aside the spatial aspect of the density distribution.
5.2.0.1 Clustering methods
In 1987, McDonald [155] remarks that despite being mentioned in the empirical and theoretical literature, the features that an employment subcenter should have are nowhere discussed. For the first time, he proposes a method to deter-mine the number of subcenters empirically. Given a number T of areal units, we will say that i with employment Ei, population Piand surface area Aiis an
employment subcenter if: He also proposes a
definition based on the
employment-to-population ratio
The gross employment density ρi = Ei/Ai is greater than that of
the contiguous units;
Giuliano and Small [98] acknowledge the necessity to consider employment densities to define subcenters put forward by McDonald [155]. However, they deplore that the method does not allow for adjacent units with a high employ-ment density to be centers – as only the larger one would be selected. Thus, they propose an alternate definition. Namely that a contiguous set of unitsS is a subcenter if
• The employment density ρ of every areal units in the setS is greater than a threshold value D;