RESEARCH OUTPUTS / RÉSULTATS DE RECHERCHE
Author(s) - Auteur(s) :
Publication date - Date de publication :
Permanent link - Permalien :
Rights / License - Licence de droit d’auteur :
Bibliothèque Universitaire Moretus Plantin
Institutional Repository - Research Portal
Dépôt Institutionnel - Portail de la Recherche
researchportal.unamur.be
University of Namur
Voodoo versus fishing committees: the role of traditional and contemporary
institutions in fisheries management
Briones Alonso, Elena; Houssa, Romain; Verpoorten, Marijke
Publication date:
2015
Document Version
Early version, also known as pre-print Link to publication
Citation for pulished version (HARVARD):
Briones Alonso, E, Houssa, R & Verpoorten, M 2015 'Voodoo versus fishing committees: the role of traditional and contemporary institutions in fisheries management'.
General rights
Copyright and moral rights for the publications made accessible in the public portal are retained by the authors and/or other copyright owners and it is a condition of accessing publications that users recognise and abide by the legal requirements associated with these rights. • Users may download and print one copy of any publication from the public portal for the purpose of private study or research. • You may not further distribute the material or use it for any profit-making activity or commercial gain
• You may freely distribute the URL identifying the publication in the public portal ?
Take down policy
If you believe that this document breaches copyright please contact us providing details, and we will remove access to the work immediately and investigate your claim.
Online Appendix to the Paper
‘Voodoo versus fishing committees: the role of traditional and contemporary
institutions in fisheries management’
Briones Alonso, Elena
aHoussa, Romain
bVerpoorten, Marijke
ca
Centre for Institutions and Economic Performance (LICOS), University of Leuven (KU Leuven). Waaistraat 6 bus 3511, B-3000 Leuven, Belgium. Email: elena.brionesalonso@kuleuven.be. Corresponding author.
b
Centre of Research in the Economics of Development (CRED) and CeReFiM, University of Namur, Rue de Bruxelles 61, B-5000 Namur, Belgium. Email: romain.roussa@UNamur.be
c
Institute for Development Policy and Management (IOB), University of Antwerp (UA), Prinsstraat 13, B-2000 Antwerpen, Belgium; and Centre for Institutions and Economic Performance (LICOS), University of Leuven (KU Leuven). Email: marijke.verpoorten@uantwerpen.be
Appendix A reports summary statistics, full results and a detailed discussion of the
robustness checks. Appendix B provides additional information on data collection. We explain
the implementation of the 2009 household survey in detail, discuss variable measurement and
present the questions asked in the household survey and fishery census. Appendix C provides a
more detailed description of the history of Voodoo and fisheries management, which was
summarized in the introduction of the paper.
A. Summary statistics and full results
A.1. Summary statistics
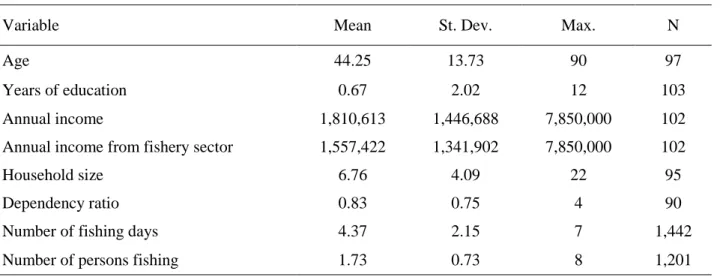
Table A.1: Summary statistics of individual and household characteristics Panel A: Household survey sample (2009)
Variable Mean St. Dev. Max. N
Age 44.25 13.73 90 97
Years of education 0.67 2.02 12 103
Annual income 1,810,613 1,446,688 7,850,000 102 Annual income from fishery sector 1,557,422 1,341,902 7,850,000 102
Household size 6.76 4.09 22 95
Dependency ratio 0.83 0.75 4 90
Number of fishing days 4.37 2.15 7 1,442
Number of persons fishing 1.73 0.73 8 1,201
Panel B: Fishery census sample (2006)
Variable Mean St. Dev. Max. N
Age 37 13.06 80 5,803
Number of dependent children 4.7 2.80 15 5,187
Share with formal education 16.5 5,852
Share Goun ethnicity 2.0 5,852
Share Aizo ethnicity 4.0 5,852
Share Tofin ethnicity 83.3 5,852
Share Xwla ethnicity 9.6 5,852
Share Wémè ethnicity 0.2 5,852
Share Sèto ethnicity 0.7 5,852
Share Adja ethnicity 0.2 5,852
Share Sahouè ethnicity 0.2 5,852
Source: Author’s calculations. Notes: Earnings are expressed in CFA. One euro equaled about 656 CFA in 2009. The dependency ratio is defined as the ratio of dependent members (dependent children and seniors of 60 years and older) over active members of the household.
A.2 Full tables for main results
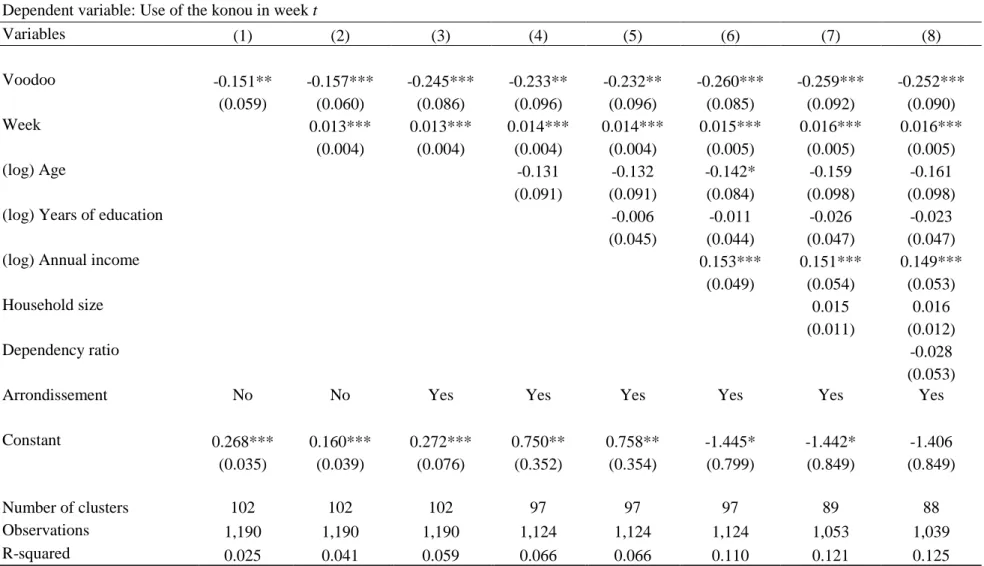
Table A.2: OLS estimation results: Use of the konou and Voodoo adherence (2009 household survey) Dependent variable: Use of the konou in week t
Variables (1) (2) (3) (4) (5) (6) (7) (8) Voodoo -0.151** -0.157*** -0.245*** -0.233** -0.232** -0.260*** -0.259*** -0.252*** (0.059) (0.060) (0.086) (0.096) (0.096) (0.085) (0.092) (0.090) Week 0.013*** 0.013*** 0.014*** 0.014*** 0.015*** 0.016*** 0.016*** (0.004) (0.004) (0.004) (0.004) (0.005) (0.005) (0.005) (log) Age -0.131 -0.132 -0.142* -0.159 -0.161 (0.091) (0.091) (0.084) (0.098) (0.098)
(log) Years of education -0.006 -0.011 -0.026 -0.023
(0.045) (0.044) (0.047) (0.047)
(log) Annual income 0.153*** 0.151*** 0.149***
(0.049) (0.054) (0.053)
Household size 0.015 0.016
(0.011) (0.012)
Dependency ratio -0.028
(0.053)
Arrondissement No No Yes Yes Yes Yes Yes Yes
Constant 0.268*** 0.160*** 0.272*** 0.750** 0.758** -1.445* -1.442* -1.406 (0.035) (0.039) (0.076) (0.352) (0.354) (0.799) (0.849) (0.849)
Number of clusters 102 102 102 97 97 97 89 88
Observations 1,190 1,190 1,190 1,124 1,124 1,124 1,053 1,039
R-squared 0.025 0.041 0.059 0.066 0.066 0.110 0.121 0.125
Notes: Coefficients are reported with individually clustered standard errors in parentheses. ***, ** and * denote significance at the 1, 5 and 10 % levels respectively. Annual income is expressed in CFA; one euro equaled about 656 CFA in 2009. Week refers to a count variable that indicates the survey week.
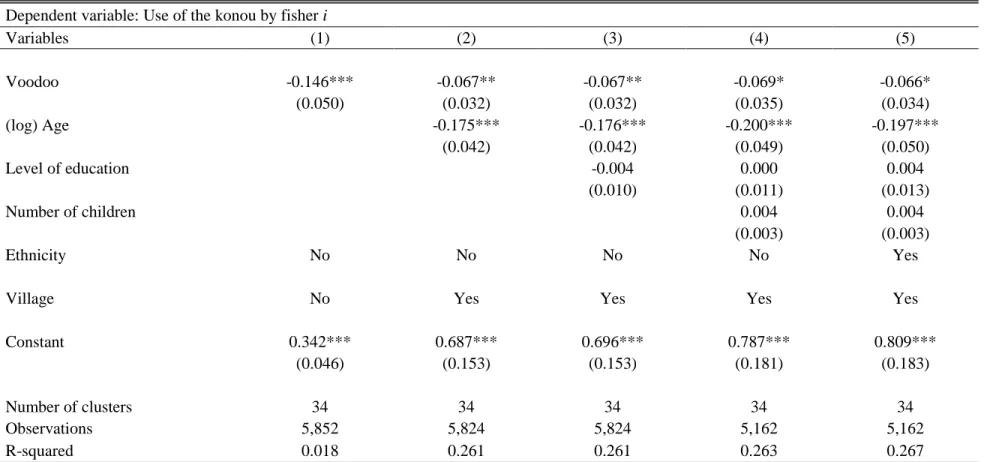
Table A.3: OLS estimation results: Use of the konou and Voodoo adherence (2006 fishery census) Dependent variable: Use of the konou by fisher i
Variables (1) (2) (3) (4) (5) Voodoo -0.146*** -0.067** -0.067** -0.069* -0.066* (0.050) (0.032) (0.032) (0.035) (0.034) (log) Age -0.175*** -0.176*** -0.200*** -0.197*** (0.042) (0.042) (0.049) (0.050) Level of education -0.004 0.000 0.004 (0.010) (0.011) (0.013) Number of children 0.004 0.004 (0.003) (0.003) Ethnicity No No No No Yes
Village No Yes Yes Yes Yes
Constant 0.342*** 0.687*** 0.696*** 0.787*** 0.809***
(0.046) (0.153) (0.153) (0.181) (0.183)
Number of clusters 34 34 34 34 34
Observations 5,852 5,824 5,824 5,162 5,162
R-squared 0.018 0.261 0.261 0.263 0.267
Notes: Coefficients are reported with standard errors clustered at the village level in parentheses. ***, ** and * denote significance at the 1, 5 and 10 % levels respectively. Village refers to dummy variables indicating the village in which the individual lives. Ethnicity refers to ethnicity dummies indicating to which ethnicity the fisherman belongs.
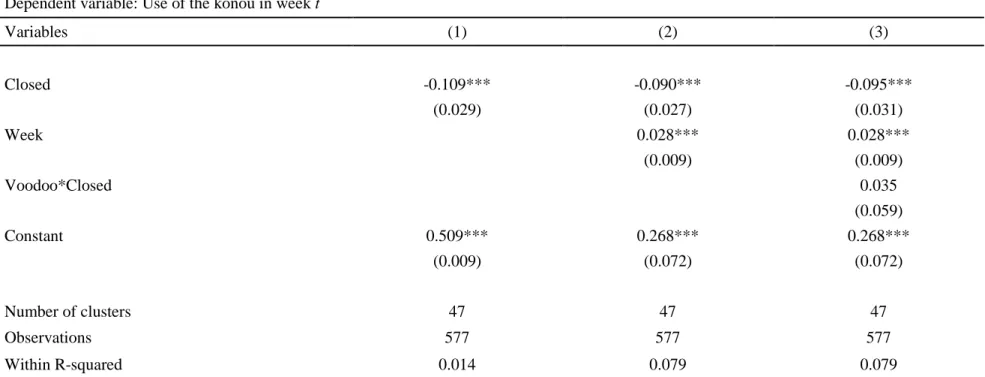
Table A.4 : Individual fixed effects estimation results: Use of the konou in closed weeks (2009 household survey - subsample of konou users)
Dependent variable: Use of the konou in week t
Variables (1) (2) (3) Closed -0.109*** -0.090*** -0.095*** (0.029) (0.027) (0.031) Week 0.028*** 0.028*** (0.009) (0.009) Voodoo*Closed 0.035 (0.059) Constant 0.509*** 0.268*** 0.268*** (0.009) (0.072) (0.072) Number of clusters 47 47 47 Observations 577 577 577 Within R-squared 0.014 0.079 0.079
Notes: Coefficients are reported with individually clustered standard errors in parentheses. ***, ** and * denote significance at the 1, 5 and 10 % levels respectively. For more details on the explanatory variables we refer to the notes below Table A.2.
A.3. Detailed exposition of robustness checks
A.3.1. Alternative sample
Our baseline analysis of the 2009 household survey data relied on a balanced sample of fishers,
i.e. fishers who were visited in all 14 weeks. This choice was motivated by the fact that the
timing of missing weeks may be related to the use of the konou and the fishing committee rule.
For instance, fishers who were violating the fishing committee rule by using the konou in closed
weeks may have avoided to be interviewed in those weeks. It is also possible that fishers who
generally comply to the fishing committee rule take up alternative economic activities in closed
weeks to compensate for the inability to use the konou.
We verify whether our results hold when we re-estimate Eq.(1), (3) and (4) using an
unbalanced sample of fishers, including fishers who were not interviewed in one or more weeks.
1The unbalanced sample includes 121 fishers. We extend Eq.(1) with the regressor Missing weeks
iwhich counts the number of weeks in which the fisher was not interviewed. The OLS estimation
results for Eq.(1) are reported in Table A.5; the individual fixed effects estimation results for
Eq.(3) and Eq.(4) are reported in Table A.6. The results are qualitatively the same and
quantitatively similar to our baseline results.
A.3.2. Alternative estimation model
We check whether we obtain the same results using nonlinear estimations models. We start by
re-estimating Eq.(1)-(4) using a probit model. The results are presented in Tables A.7-A.10 and
are highly similar to the results obtained using linear estimation models. In contrast to the
individual fixed effects model used for the baseline estimation of Eq.(4), the probit model allows
us to estimate the coefficient for Voodoo adherence (a time-invariant variable). Table A.10
1
As there is no time dimension in the census data, this test is not relevant for Eq.(2).
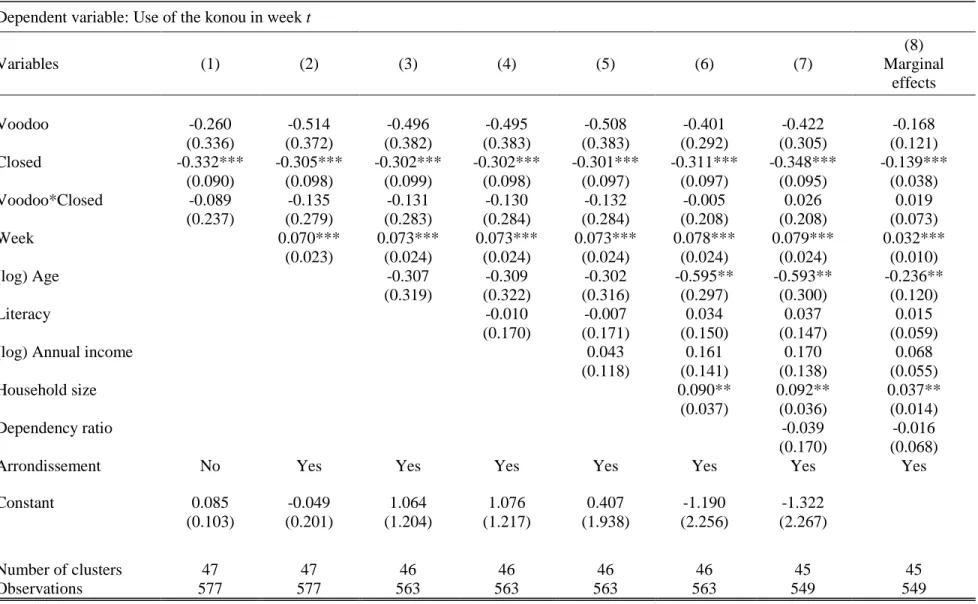
presents the probit estimation results for Eq.(4). The marginal effect for Voodoo adherence has a
negative sign but is not statistically significantly different from zero. This finding might at first
appear to contradict our earlier results regarding the relation between Voodoo adherence and the
use of the konou (Table A.2). However, these earlier results applied for the full sample of fishers,
which includes konou users and fishers who do not use the konou at all. In contrast, the results
presented in Table A.10 hold only for the subsample of konou users. Among these konou users
are Voodoo fishers who have decided to break the traditional rule. Hence, the insignificant result
for Voodoo adherence in Table A.10 indicates that Voodoo fishers, once they have decided to
break the traditional rule, are on average equally likely to use the konou in any given week as
other konou users (all else equal).
We further re-estimate Eq.(3) and (4) using a probit individual fixed effects model (by
adding 47 individual dummy variables as regressors).
2The results for Eq.(3) and (4), presented
in Table A.11, are again quantitatively similar to the main results for Eq.(3) and (4) (cfr. Table
A.4).
A.3.3. Alternative dependent variable
We verify whether our results for Eq.(1) hold when we use an alternative definition of
compliance to the traditional rule. So far we have used a time-varying dependent variable, i.e. the
use of the konou across weeks. This choice is motivated by the fact that the decision to use the
konou depends in part on unobserved time-varying variables such as the growth cycle of shrimp
or local conditions on the lake (e.g. salinity of the water). Looking at the variation in the use of
2 As explained before, we do not apply this robustness check to Eq.(1) and (2) since our variable of interest is
time-invariant.
the konou across weeks allows us to control for these unobserved weekly-varying variables and
produce a more precise coefficient estimate for Voodoo adherence.
Nevertheless, since our regressor of interest – Voodoo adherence – does not vary over
time, we can construct a time-invariant measure of overall compliance to the traditional rule.
More specifically, we take the simple sum of the number of weeks the konou was used by
fisherman i across the observation period of 14 weeks. In Eq.(1), we replace the binary
dependent variable use of the konou in week t by the aggregated variable total use of the konou
by individual i. We estimate this adjusted equation using OLS. We use heteroskedasticity-robust
standard errors rather than clustered standard errors, as we no longer exploit the time dimension
of the data and serial correlation of the error terms is not a concern.
The results are reported in Table A.12 and indicate that a Voodoo fisherman on average
uses the konou 2.9 weeks less than a fisherman who follows another religion (all else equal).
Sample fishermen who are not Voodoo adherents used the konou on average in 3.2 weeks (with
a standard deviation of 3.6 weeks) in total. Hence, the average estimated impact of Voodoo
adherence on total konou use amounts to 90 % of the sample average of total konou use among
non-Voodoo fishers.
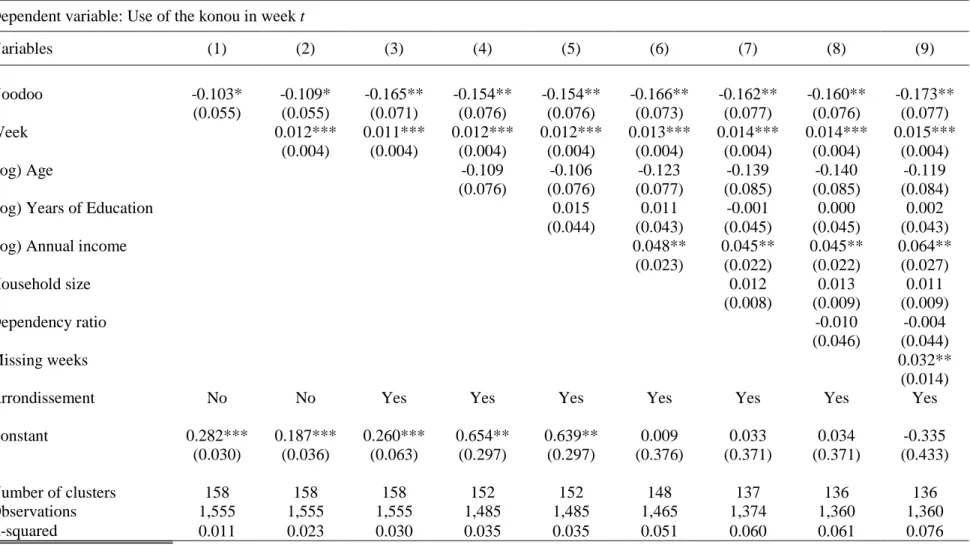
Table A.5: OLS estimation results: Use of the konou and Voodoo adherence – unbalanced sample (2009 household survey ) Dependent variable: Use of the konou in week t
Variables (1) (2) (3) (4) (5) (6) (7) (8) (9) Voodoo -0.103* -0.109* -0.165** -0.154** -0.154** -0.166** -0.162** -0.160** -0.173** (0.055) (0.055) (0.071) (0.076) (0.076) (0.073) (0.077) (0.076) (0.077) Week 0.012*** 0.011*** 0.012*** 0.012*** 0.013*** 0.014*** 0.014*** 0.015*** (0.004) (0.004) (0.004) (0.004) (0.004) (0.004) (0.004) (0.004) (log) Age -0.109 -0.106 -0.123 -0.139 -0.140 -0.119 (0.076) (0.076) (0.077) (0.085) (0.085) (0.084)
(log) Years of Education 0.015 0.011 -0.001 0.000 0.002
(0.044) (0.043) (0.045) (0.045) (0.043)
(log) Annual income 0.048** 0.045** 0.045** 0.064**
(0.023) (0.022) (0.022) (0.027) Household size 0.012 0.013 0.011 (0.008) (0.009) (0.009) Dependency ratio -0.010 -0.004 (0.046) (0.044) Missing weeks 0.032** (0.014)
Arrondissement No No Yes Yes Yes Yes Yes Yes Yes
Constant 0.282*** 0.187*** 0.260*** 0.654** 0.639** 0.009 0.033 0.034 -0.335 (0.030) (0.036) (0.063) (0.297) (0.297) (0.376) (0.371) (0.371) (0.433)
Number of clusters 158 158 158 152 152 148 137 136 136
Observations 1,555 1,555 1,555 1,485 1,485 1,465 1,374 1,360 1,360 R-squared 0.011 0.023 0.030 0.035 0.035 0.051 0.060 0.061 0.076
Notes: Coefficients are reported with individually clustered standard errors in parentheses. ***, ** and * denote significance at the 1, 5 and 10 % levels respectively. The regressor Missing weeks counts the number of weeks for which information is missing for individual i. For more details on the explanatory variables we refer to the notes below Table A.2.
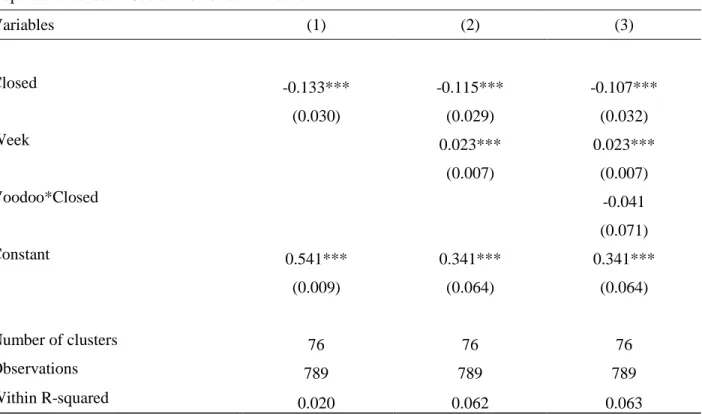
Table A.6: Individual fixed effects estimation results: Use of the konou in closed weeks - unbalanced sample
(2009 household survey - subsample of konou users) Dependent variable: Use of the konou in week t
Variables (1) (2) (3) Closed -0.133*** -0.115*** -0.107*** (0.030) (0.029) (0.032) Week 0.023*** 0.023*** (0.007) (0.007) Voodoo*Closed -0.041 (0.071) Constant 0.541*** 0.341*** 0.341*** (0.009) (0.064) (0.064) Number of clusters 76 76 76 Observations 789 789 789 Within R-squared 0.020 0.062 0.063
Notes: Coefficients are reported with individually clustered standard errors in parentheses. ***, ** and * denote significance at the 1, 5 and 10 % levels respectively. For more details on the explanatory variables we refer to the notes below Table A.2.
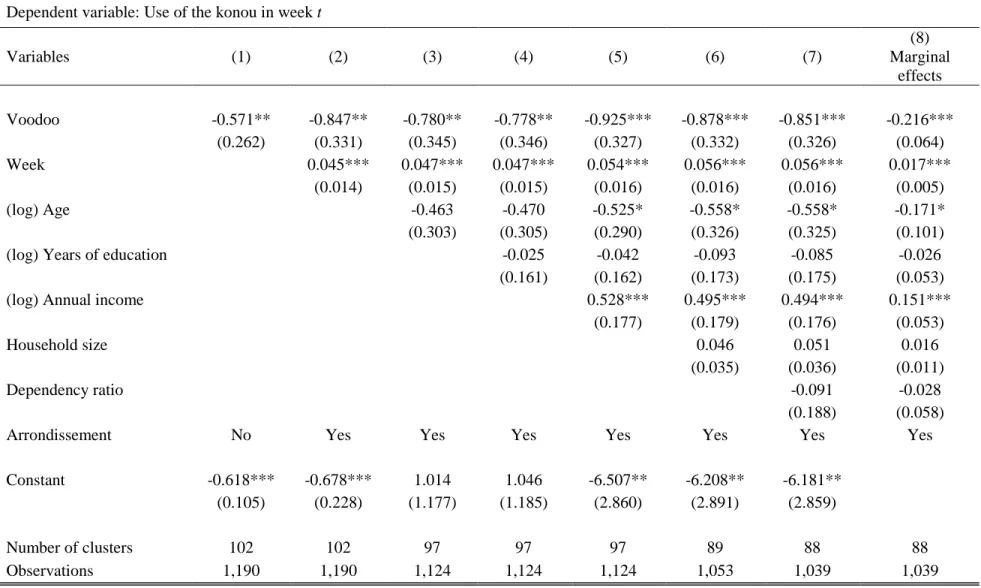
Table A.7: Probit estimation results: Use of the konou and Voodoo adherence (2009 household survey)
Dependent variable: Use of the konou in week t
Variables (1) (2) (3) (4) (5) (6) (7) (8) Marginal effects Voodoo -0.571** -0.847** -0.780** -0.778** -0.925*** -0.878*** -0.851*** -0.216*** (0.262) (0.331) (0.345) (0.346) (0.327) (0.332) (0.326) (0.064) Week 0.045*** 0.047*** 0.047*** 0.054*** 0.056*** 0.056*** 0.017*** (0.014) (0.015) (0.015) (0.016) (0.016) (0.016) (0.005) (log) Age -0.463 -0.470 -0.525* -0.558* -0.558* -0.171* (0.303) (0.305) (0.290) (0.326) (0.325) (0.101)
(log) Years of education -0.025 -0.042 -0.093 -0.085 -0.026
(0.161) (0.162) (0.173) (0.175) (0.053)
(log) Annual income 0.528*** 0.495*** 0.494*** 0.151***
(0.177) (0.179) (0.176) (0.053)
Household size 0.046 0.051 0.016
(0.035) (0.036) (0.011)
Dependency ratio -0.091 -0.028
(0.188) (0.058)
Arrondissement No Yes Yes Yes Yes Yes Yes Yes
Constant -0.618*** -0.678*** 1.014 1.046 -6.507** -6.208** -6.181** (0.105) (0.228) (1.177) (1.185) (2.860) (2.891) (2.859)
Number of clusters 102 102 97 97 97 89 88 88
Observations 1,190 1,190 1,124 1,124 1,124 1,053 1,039 1,039
Notes: Coefficients are reported with individually clustered standard errors in parentheses. ***, ** and * denote significance at the 1, 5 and 10 % levels respectively. Column (8) presents average marginal effects calculated at the mean values of other variables for the specification in column (7). For more details on the explanatory variables we refer to the notes below Table A2.
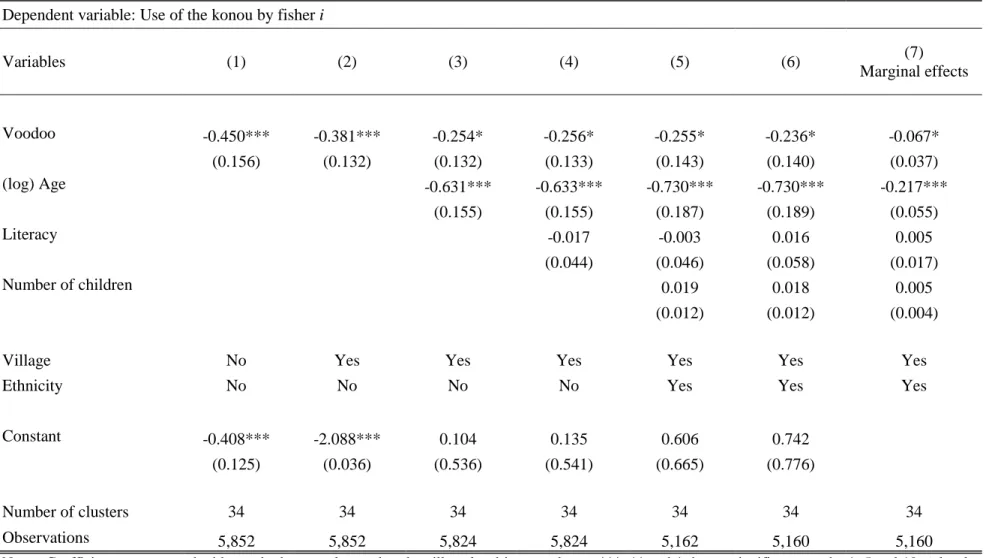
Table A.8: Probit estimation results: Use of the konou and Voodoo adherence (2006 fishery census) Dependent variable: Use of the konou by fisher i
Variables (1) (2) (3) (4) (5) (6) (7) Marginal effects Voodoo -0.450*** -0.381*** -0.254* -0.256* -0.255* -0.236* -0.067* (0.156) (0.132) (0.132) (0.133) (0.143) (0.140) (0.037) (log) Age -0.631*** -0.633*** -0.730*** -0.730*** -0.217*** (0.155) (0.155) (0.187) (0.189) (0.055) Literacy -0.017 -0.003 0.016 0.005 (0.044) (0.046) (0.058) (0.017) Number of children 0.019 0.018 0.005 (0.012) (0.012) (0.004)
Village No Yes Yes Yes Yes Yes Yes
Ethnicity No No No No Yes Yes Yes
Constant -0.408*** -2.088*** 0.104 0.135 0.606 0.742
(0.125) (0.036) (0.536) (0.541) (0.665) (0.776)
Number of clusters 34 34 34 34 34 34 34
Observations 5,852 5,852 5,824 5,824 5,162 5,160 5,160
Notes: Coefficients are reported with standard errors clustered at the village level in parentheses. ***, ** and * denote significance at the 1, 5 and 10 % levels respectively. Column (7) presents average marginal effects calculated at the mean values of other variables for the specification in column (6). For more details on the explanatory variables we refer to the notes below Table A.2.
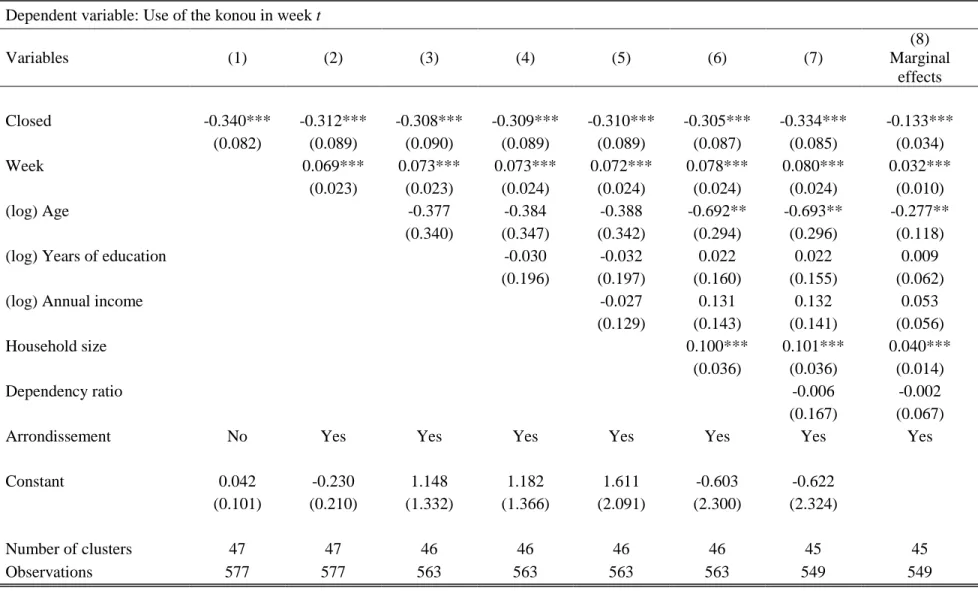
Table A.9: Probit estimation results: Use of the konou in closed weeks (2009 household survey – subsample of konou users) Dependent variable: Use of the konou in week t
Variables (1) (2) (3) (4) (5) (6) (7) (8) Marginal effects Closed -0.340*** -0.312*** -0.308*** -0.309*** -0.310*** -0.305*** -0.334*** -0.133*** (0.082) (0.089) (0.090) (0.089) (0.089) (0.087) (0.085) (0.034) Week 0.069*** 0.073*** 0.073*** 0.072*** 0.078*** 0.080*** 0.032*** (0.023) (0.023) (0.024) (0.024) (0.024) (0.024) (0.010) (log) Age -0.377 -0.384 -0.388 -0.692** -0.693** -0.277** (0.340) (0.347) (0.342) (0.294) (0.296) (0.118)
(log) Years of education -0.030 -0.032 0.022 0.022 0.009
(0.196) (0.197) (0.160) (0.155) (0.062)
(log) Annual income -0.027 0.131 0.132 0.053
(0.129) (0.143) (0.141) (0.056)
Household size 0.100*** 0.101*** 0.040***
(0.036) (0.036) (0.014)
Dependency ratio -0.006 -0.002
(0.167) (0.067)
Arrondissement No Yes Yes Yes Yes Yes Yes Yes
Constant 0.042 -0.230 1.148 1.182 1.611 -0.603 -0.622
(0.101) (0.210) (1.332) (1.366) (2.091) (2.300) (2.324)
Number of clusters 47 47 46 46 46 46 45 45
Observations 577 577 563 563 563 563 549 549
Notes: Coefficients are reported with individually clustered standard errors in parentheses. ***, ** and * denote significance at the 1, 5 and 10 % levels respectively. Column (8) presents average marginal effects calculated at the mean values of other variables for the specification in column (7). For more details on the explanatory variables we refer to the notes below Table A.2.
Table A.10: Probit estimation results: Use of the konou by Voodoo fishers in closed weeks (2009 household survey - subsample of konou users) Dependent variable: Use of the konou in week t
Variables (1) (2) (3) (4) (5) (6) (7) (8) Marginal effects Voodoo -0.260 -0.514 -0.496 -0.495 -0.508 -0.401 -0.422 -0.168 (0.336) (0.372) (0.382) (0.383) (0.383) (0.292) (0.305) (0.121) Closed -0.332*** -0.305*** -0.302*** -0.302*** -0.301*** -0.311*** -0.348*** -0.139*** (0.090) (0.098) (0.099) (0.098) (0.097) (0.097) (0.095) (0.038) Voodoo*Closed -0.089 -0.135 -0.131 -0.130 -0.132 -0.005 0.026 0.019 (0.237) (0.279) (0.283) (0.284) (0.284) (0.208) (0.208) (0.073) Week 0.070*** 0.073*** 0.073*** 0.073*** 0.078*** 0.079*** 0.032*** (0.023) (0.024) (0.024) (0.024) (0.024) (0.024) (0.010) (log) Age -0.307 -0.309 -0.302 -0.595** -0.593** -0.236** (0.319) (0.322) (0.316) (0.297) (0.300) (0.120) Literacy -0.010 -0.007 0.034 0.037 0.015 (0.170) (0.171) (0.150) (0.147) (0.059)
(log) Annual income 0.043 0.161 0.170 0.068
(0.118) (0.141) (0.138) (0.055)
Household size 0.090** 0.092** 0.037**
(0.037) (0.036) (0.014)
Dependency ratio -0.039 -0.016
(0.170) (0.068)
Arrondissement No Yes Yes Yes Yes Yes Yes Yes
Constant 0.085 -0.049 1.064 1.076 0.407 -1.190 -1.322
(0.103) (0.201) (1.204) (1.217) (1.938) (2.256) (2.267)
Number of clusters 47 47 46 46 46 46 45 45
Observations 577 577 563 563 563 563 549 549
Notes: Coefficients are reported with individually clustered standard errors in parentheses. ***, ** and * denote significance at the 1, 5 and 10 % levels respectively. Column (8) presents average marginal effects calculated at the mean values of other variables for the specification in column (7). For more details on the explanatory variables we refer to the notes below Table A.2.
Table A.11: Probit individual fixed effects estimation results: Use of the konou in closed weeks (2009 household survey - subsample of konou users)
Dependent variable: Use of the konou in week t
Variables (1) (2) (3) (4) Marginal effects Closed -0.352*** -0.308*** -0.311*** -0.122*** (0.093) (0.095) (0.105) (0.041) Week 0.092*** 0.092*** 0.036*** (0.030) (0.030) (0.012) Voodoo*Closed 0.029 0.017 (0.250) (0.074) Constant 0.678*** 0.050 0.051 (0.030) (0.192) (0.194) Number of clusters 43 43 43 43 Observations 550 550 550 549
Notes: Coefficients are reported with individually clustered standard errors in parentheses. ***, ** and * denote significance at the 1, 5 and 10 % levels respectively. Column (4) presents average marginal effects calculated at the mean values of other variables for the specification in column (3). For more details on the explanatory variables we refer to the notes below Table A.2.
Table A.12: OLS estimation results: Total use of the konou and Voodoo adherence (2009 household survey) Dependent variable Total number of weeks fisherman i used the konou
Variables (1) (2) (3) (4) (5) (6) (7) Voodoo -1.874*** -2.749*** -2.529** -2.522** -2.809*** -3.002*** -2.884*** (0.668) (0.991) (1.081) (1.089) (0.964) (1.083) (1.086) (log) Age -1.954* -1.980* -2.146** -1.908 -1.935 (1.075) (1.089) (1.012) (1.212) (1.217)
(log) Years of education -0.101 -0.211 -0.354 -0.311
(0.540) (0.536) (0.566) (0.575)
(log) Annual wage 1.784*** 1.722** 1.694**
(0.640) (0.738) (0.739)
Household size 0.090 0.113
(0.136) (0.149)
Dependency Ratio -0.443
(0.598)
Arrondissement No Yes Yes Yes Yes Yes Yes
Constant 3.160*** 4.238*** 11.552*** 11.675*** -13.614 -13.860 -13.230 (0.416) (0.914) (4.209) (4.279) (10.235) (11.660) (11.723)
Observations 103 103 97 97 97 89 88
R-squared 0.058 0.086 0.107 0.107 0.192 0.194 0.199
Notes: Coefficients are reported with heteroskedasticity-robust standard errors in parentheses. ***, ** and * denote significance at the 1, 5 and 10 % levels respectively. For more details on the explanatory variables we refer to the notes below Table A.2.
A.4. Full tables for analysis in section 6 (competing explanations)
A.4.1. Unobserved individual heterogeneity
Table A.13: OLS estimation results: Ownership of recent technologies and Voodoo adherence (2009 household survey - balanced sample)
Dependent variable Individual owns mobile phone Household owns electricity generator Household owns radio Household owns television Variables (1) (2) (3) (4) Voodoo -0.184 0.168 0.084 -0.006 (0.164) (0.133) (0.195) (0.084) (log) Age -0.115 -0.077 -0.327* -0.107 (0.197) (0.152) (0.167) (0.138) (log) Years of education -0.069 -0.081* -0.039 0.021 (0.086) (0.046) (0.083) (0.067)
(log) Annual wage 0.134 -0.121* 0.016 -0.097*
(0.093) (0.063) (0.092) (0.058) Household size 0.016 0.032** -0.001 0.027* (0.017) (0.016) (0.017) (0.015) Dependency Ratio 0.072 -0.076 0.044 -0.035 (0.093) (0.082) (0.083) (0.075) Arrondissement -0.192 -0.026 0.179 -0.020 (0.170) (0.129) (0.174) (0.102) Constant -0.883 2.018* 1.532 1.744 (1.517) (1.153) (1.482) (1.067) Observations 79 79 79 79 R-squared 0.135 0.123 0.073 0.119
Notes: Coefficients are reported with individually clustered standard errors in parentheses. ***, ** and * denote significance at the 1, 5 and 10 % levels respectively. Controls are discussed in section 4.1. of the paper.
Table A.14: OLS estimation results: Ownership of new technologies and Voodoo adherence (2009 household survey – unbalanced sample)
Dependent variable Individual owns mobile phone Household owns electricity generator Household owns radio Household owns television Variables (1) (2) (3) (4) Voodoo -0.076 -0.136 0.043 -0.191** (0.100) (0.108) (0.123) (0.076) (log) Age -0.108 -0.074 -0.243** -0.116 (0.118) (0.108) (0.097) (0.099) (log) Years of education -0.054 -0.011 0.010 0.048 (0.069) (0.057) (0.061) (0.060)
(log) Annual wage -0.002 0.016*** 0.051*** 0.013**
(0.015) (0.006) (0.007) (0.006) Household size 0.016* 0.024** 0.005 0.022** (0.009) (0.010) (0.010) (0.009) Dependency Ratio 0.006 -0.046 -0.020 -0.015 (0.059) (0.069) (0.062) (0.064) Arrondissement -0.289*** -0.015 0.136 0.013 (0.096) (0.100) (0.115) (0.081) Constant 1.140** 0.176 0.807** 0.305 (0.495) (0.389) (0.383) (0.357) Observations 121 121 121 121 R-squared 0.122 0.089 0.116 0.133
Notes: Coefficients are reported with individually clustered standard errors in parentheses. ***, ** and * denote significance at the 1, 5 and 10 % levels respectively. Controls are discussed in section 4.1. of the paper.
Table A.15: OLS estimation results: Voodoo adherence and the use of the konou - inclusion of control variables (2009 household survey) Dependent variable Use of the konou in week t
Variables (1) (2) (3) (4) (5) (6) (7) (8) (9) (10) (11)
Voodoo -0.151** -0.157*** -0.245*** -0.252*** -0.252*** -0.252*** -0.238** -0.233** -0.209* -0.201* -0.201*
(0.059) (0.060) (0.086) (0.090) (0.091) (0.091) (0.098) (0.107) (0.116) (0.113) (0.114)
(log) Age -0.161 -0.217** -0.215** -0.215** -0.145 -0.145 -0.170 -0.170
(0.098) (0.100) (0.101) (0.102) (0.100) (0.097) (0.104) (0.104)
(log) Years of education -0.023 -0.016 -0.016 -0.015 -0.023 -0.028 -0.030 -0.030
(0.047) (0.047) (0.047) (0.047) (0.050) (0.049) (0.050) (0.051)
(log) Annual income 0.149*** 0.158*** 0.157*** 0.159*** 0.140** 0.126** 0.131** 0.131**
(0.053) (0.053) (0.053) (0.053) (0.055) (0.059) (0.060) (0.060)
Household size 0.016 0.018 0.018 0.019 0.016 0.018 0.019 0.019
(0.012) (0.013) (0.013) (0.013) (0.014) (0.013) (0.013) (0.013)
Dependency ratio -0.028 -0.048 -0.047 -0.054 -0.034 -0.047 -0.045 -0.046
(0.053) (0.055) (0.055) (0.054) (0.057) (0.057) (0.057) (0.056)
Relationship household head -0.050** -0.052** -0.056*** -0.043* -0.045* -0.046* -0.046*
(0.021) (0.020) (0.020) (0.026) (0.024) (0.023) (0.023) Marital status -0.027 -0.052 -0.019 -0.046 -0.061 -0.063 (0.123) (0.127) (0.146) (0.144) (0.150) (0.149) Number of wives 0.040 0.039 0.043 0.043 0.044 (0.057) (0.060) (0.060) (0.058) (0.060) Mobile phone 0.107* 0.134* 0.132* 0.132* (0.064) (0.079) (0.079) (0.077) Electricity generator -0.086 -0.077 -0.074 (0.112) (0.114) (0.136) Radio -0.074 -0.074 (0.066) (0.066) TV -0.006 (0.134)
Constant Yes Yes Yes Yes Yes Yes Yes Yes Yes Yes Yes
Week No Yes Yes Yes Yes Yes Yes Yes Yes Yes Yes
Arrondissement No No Yes Yes Yes Yes Yes Yes Yes Yes Yes
Number of clusters 102 102 102 88 88 88 88 79 79 79 79
Observations 1,190 1,190 1,190 1,039 1,039 1,039 1,039 927 927 927 927
R-squared 0.025 0.041 0.059 0.125 0.138 0.138 0.141 0.160 0.164 0.169 0.169
Notes: Coefficients are reported with individually clustered standard errors in parentheses. ***, ** and * denote significance at the 1, 5 and 10 % levels respectively. For more details on the explanatory variables we refer to the notes below Table A.2 and section 6.1. of the paper.
A.4.2. Reporting bias regarding the use of the konou
Full results for the estimation of Eq.(5) and Eq.(6) are presented in Tables A.16 and A.17
respectively.
To verify whether the fluctuations in shrimp fishing revenue across open and closed
weeks are caused by a natural cyclicality in fishing activities rather than the fishing
committee rule, we run a falsification test. We implement the test by comparing the
fluctuations of fishing revenue at lake Nokoué with those of lake Ahémé, another coastal lake
in southern Benin close to lake Nokoué (see Figure 1). At this lake the socio-ecological
system and nature of fishing activities are similar to lake Nokoué. The key differences for our
purpose are the absence of the fishing committee rule and the fact that the government
prohibited the use of the konou at lake Ahémé (and this prohibition is well enforced).
Our falsification test takes the form of a difference-in-differences analysis, which
allows us to examine whether the fluctuations in shrimp fishing revenue at lake Nokoué are
significantly larger than fluctuations in shrimp fishing revenue for the control, i.e. lake
Ahémé. Finding no significant difference between the two lakes would suggest that the
fluctuations observed at lake Nokoué are caused by a cyclicality of fishing activities rather
than the fishing committee rule.
We augment equations (5) and (6) with interaction terms between the sets of closed
and open week indicator variables, and an indicator variable that takes value 1 for lake
Nokoué (and 0 for lake Ahémé).
3We estimate the augmented regression equations for an
extended household survey sample by adding 14 weekly observations for 116 fishermen
living in 6 villages at lake Ahémé. Table A.18 and A.19 presents the estimation results for
closed and open weeks respectively. The coefficient estimates indicate that the drop in shrimp
fishing revenue in the first closed weeks and the jump in shrimp fishing revenue in the first
3
This indicator variable for lake Nokoué is absorbed by the individual fixed effects.
20
open weeks are significantly larger at lake Nokoué compared to lake Ahémé. We therefore
reject the hypothesis that the fluctuations in fishing revenue observed at lake Nokoué are
merely the result of natural cyclicality.
Table A.16: Individual fixed effects estimation results: Shrimp fishing revenue in closed weeks (2009 household survey)
Dependent variable: (log) Average weekly fishing revenue for shrimp in week t
Variable (1) (2) (3) (4) (5)
Closed first week -1.186*** -1.184*** -0.914*** -0.909*** -0.783*** (0.277) (0.275) (0.238) (0.295) (0.253) Closed second week -0.505** -0.499** -0.325 -0.259 -0.094 (0.233) (0.232) (0.210) (0.258) (0.221)
Week 0.011 -0.025 -0.064 -0.002
(0.046) (0.043) (0.051) (0.044)
(log) Fishing days 2.274*** 2.413*** 1.589**
(0.280) (0.812) (0.715)
(log) Persons fishing 1.169 1.563
(1.032) (1.042)
Other fishing gear No No No No Yes
Constant 3.485*** 3.393*** 0.161 -0.941 -1.008 (0.083) (0.372) (0.517) (1.765) (1.724)
Number of clusters 103 103 103 102 102
Observations 1,438 1,438 1,438 1,197 1,184
R-squared 0.016 0.016 0.122 0.027 0.255
Notes: Coefficients are reported with individually clustered standard errors in parentheses. ***, ** and * denote significance at the 1, 5 and 10 % levels respectively. Fishing revenue is expressed in CFA; one euro equaled about 656 CFA in 2009. Week is a count variable that indicates the week of the survey period.
Table A.17: Individual fixed effects estimation results: Shrimp fishing revenue in open weeks (2009 household survey)
Dependent variable: (log) Average weekly fishing revenue for shrimp in week t
Variable (1) (2) (3) (4) (5)
Open first week 1.513*** 1.512*** 1.275*** 1.244*** 1.169*** (0.305) (0.303) (0.264) (0.312) (0.280) Open second week 1.179*** 1.174*** 1.004*** 0.995*** 0.670**
(0.346) (0.339) (0.304) (0.357) (0.311) Open third week 0.990*** 0.986*** 0.687** 0.733** 0.375
(0.347) (0.341) (0.301) (0.351) (0.319) Open fourth week 0.632** 0.631** 0.394* 0.328 0.228
(0.245) (0.242) (0.222) (0.269) (0.243)
Week 0.003 -0.032 -0.069 -0.004
(0.046) (0.043) (0.050) (0.044)
(log) Fishing days 2.278*** 2.373*** 1.558**
(0.278) (0.808) (0.705)
(log) Persons fishing 1.184 1.568
(1.039) (1.047)
Other fishing gear No No No No Yes
Constant 2.487*** 2.462*** -0.547 -1.574 -1.483 (0.168) (0.421) (0.569) (1.820) (1.774)
Number of clusters 103 103 103 102 102
Observations 1,438 1,438 1,438 1,197 1,184
R-squared 0.022 0.022 0.128 0.034 0.260
Notes: Coefficients are reported with individually clustered standard errors in parentheses. ***, ** and * denote significance at the 1, 5 and 10 % levels respectively. Fishing revenue is expressed in CFA; one euro equaled about 656 CFA in 2009. Week is a count variable that indicates the week of the survey period.
Table A.18: Individual fixed effects estimation results
Falsification test: Shrimp fishing revenue in closed weeks at two lakes (2009 household survey) Dependent variable: (log) Average weekly fishing revenue for shrimp in week t
Variable (1) (2) (3) (4) (5)
Closed first week -0.233 -0.322* -0.245 -0.260* -0.272* (0.192) (0.192) (0.148) (0.153) (0.160) Closed second week 0.393*** 0.365*** 0.239** 0.193* 0.092
(0.130) (0.130) (0.105) (0.103) (0.108) Closed first week*Nokoué -1.078*** -1.005*** -0.681** -0.767** -0.566* (0.349) (0.351) (0.290) (0.347) (0.318) Closed second week*Nokoué -0.911*** -0.918*** -0.541** -0.471 -0.186 (0.284) (0.285) (0.250) (0.305) (0.271)
Week -0.087*** -0.105*** -0.119*** -0.070**
(0.031) (0.027) (0.030) (0.029)
(log) Fishing days 3.201*** 3.253*** 2.539***
(0.194) (0.603) (0.567)
(log) Persons fishing 2.493*** 2.671***
(0.568) (0.570)
Other fishing gear No No No No Yes
Constant 5.516*** 6.235*** 1.053*** -1.045 -1.414 (0.049) (0.254) (0.384) (1.218) (1.139)
Number of clusters 219 219 219 218 218
Observations 2,939 2,939 2,939 2,576 2,532
R-squared 0.013 0.023 0.221 0.073 0.213
Notes: Coefficients are reported with individually clustered standard errors in parentheses. ***, ** and * denote significance at the 1, 5 and 10 % levels respectively. Fishing revenue is expressed in CFA; one euro equaled about 656 CFA in 2009. The baseline category for the indicator variable lake Nokoué is lake Ahémé. Week is a count variable that indicates the week of the survey period.
Table A.19: Individual fixed effects estimation results
Falsification test: Shrimp fishing revenue in open weeks at two lakes (2009 household survey) Dependent variable: (log) Average weekly fishing revenue for shrimp in week t
Variable (1) (2) (3) (4) (5)
Open first week 0.353* 0.442** 0.298* 0.292* 0.321* (0.189) (0.188) (0.160) (0.176) (0.188) Open second week 0.122 0.298 0.210 0.254 0.340* (0.203) (0.203) (0.170) (0.180) (0.189) Open third week -0.309 -0.155 -0.067 0.011 0.186
(0.256) (0.260) (0.206) (0.211) (0.215) Open fourth week -0.577*** -0.504*** -0.293* -0.231 -0.141 (0.187) (0.186) (0.152) (0.155) (0.156) Open first week*Nokoué 1.390*** 1.333*** 1.119*** 1.211*** 1.084***
(0.371) (0.371) (0.316) (0.375) (0.356) Open second week*Nokoué 1.222*** 1.166*** 0.973*** 0.977** 0.550
(0.426) (0.428) (0.374) (0.437) (0.400) Open third week*Nokoué 1.358*** 1.305*** 0.762* 0.797* 0.174
(0.459) (0.461) (0.391) (0.449) (0.432) Open fourth week*Nokoué 1.184*** 1.135*** 0.579** 0.505 0.276
(0.324) (0.327) (0.291) (0.342) (0.313)
Week -0.092*** -0.109*** -0.122*** -0.072**
(0.031) (0.027) (0.030) (0.029)
(log) Fishing days 3.192*** 3.209*** 2.485***
(0.191) (0.602) (0.563)
(log) Persons fishing 2.527*** 2.716***
(0.560) (0.558)
Other fishing gear No No No No Yes
Constant 5.103*** 5.784*** 0.750* -1.342 -1.666 (0.100) (0.266) (0.390) (1.214) (1.130)
Number of clusters 219 219 219 218 218
Observations 2,939 2,939 2,939 2,576 2,532
R-squared 0.019 0.031 0.227 0.079 0.219
Notes: Coefficients are reported with individually clustered standard errors in parentheses. ***, ** and * denote significance at the 1, 5 and 10 % levels respectively. Fishing revenue is expressed in CFA; one euro equaled about 656 CFA in 2009. The baseline category for the indicator variable lake Nokoué is lake Ahémé. Week is a count variable that indicates the week of the survey period.
B. Additional information on data collection
B.1. Details on the implementation of the 2009 household survey
For the household survey, households were visited each two weeks during the survey period.
During every visit, two modules were administered: the bi-weekly module and a one-time
module. One-time modules were implemented during one visit only, and each module focused
on a different theme (e.g. individual characteristics of household members, household assets,
schooling and health). Bi-weekly modules were implemented each bi-weekly visit and collected
information for the past two weeks (separately for each week) on revenues, expenditures and
activities of fishers and fishmongers.
As it was not possible to visit all households simultaneously in one week, households
were divided into two groups. These groups were alternately visited during the survey period. In
other words, each week one of the two groups was visited to collect bi-weekly information. This
procedure implies that the first visit to one group of households took place one week earlier than
the first visit to the second group of households. Similarly, the last visit to the second group of
households took place one week after the last visit to the first group. Hence, although each
household was visited bi-weekly during 14 weeks, the total time span of the survey was 15
weeks. Table B.1 illustrates this procedure in detail.
Because of this implementation, in the first week we only have information on fishing
activities for the first group of households; in the last week we only have information on fishing
activities for the second group of households.
Table B.1: Illustration of the implementation of the bi-weekly module in the 2009 household survey
Dates Week Household
group visited Visit number for group 1 Visit number for group 2
Information gathered for group 1
Information gathered for group 2
April 13 - 19 1 visit 1: previous week none
April 20 - 26 2 1 visit 1 visit 1: current week visit 1: previous week April 27 - May 3 3 2 visit 1 visit 2: previous week visit 1: current week May 4 - 10 4 1 visit 2 visit 2: current week visit 2: previous week May 11 - 17 5 2 visit 2 visit 3: previous week visit 2: current week May 18 - 24 6 1 visit 3 visit 3: current week visit 3: previous week May 25 - 31 7 2 visit 3 visit 4: previous week visit 3: current week June 1 - 7 8 1 visit 4 visit 4: current week visit 4: previous week June 8 - 14 9 2 visit 4 visit 5: previous week visit 4: current week June 15 - 21 10 1 visit 5 visit 5: current week visit 5: previous week June 22 - 28 11 2 visit 5 visit 6: previous week visit 5: current week June 29 - July 5 12 1 visit 6 visit 6: current week visit 6: previous week July 6 - 12 13 2 visit 6 visit 7: previous week visit 6: current week July 13 - 19 14 1 visit 7 visit 7: current week visit 7: previous week
July 20 - 26 15 2 visit 7 none visit 7: current week
Our results are basically unchanged when we exclude the observations in the first and last
week (i.e. weeks 1 and 15), with some minor changes in coefficient sizes for the variables of
interest (results not reported, but available on request). We have therefore chosen to include the
first and last weeks in our empirical analysis in order to take full advantage of the information
available in the survey.
B.2. Details on variable measurement and questions asked
For both the 2009 household survey and the 2006 fishery census we provide a detailed
exposition of how variables were measured and which questions were asked to obtain the
necessary information.
Information on religious adherence was obtained in the one-time module on household
member characteristics by asking the following question: “What is the main religious confession
of this person?”.
4The answer coding included a separate code for Voodoo or animism
(animiste). Weekly information on the use of the konou was obtained in the fishing activity
questionnaire of the bi-weekly module. The administrator asked the following question: “What
fishing instruments have you used in the past two weeks?”
5and consequently read out loud a list
of fishing instruments used at lake Nokoué. For each fishing instrument, the respondent indicated
whether he had used it in the past week and the week before, up to a maximum of three
instruments. If more than three fishing instruments had been used, the interviewer recorded the
three most important ones. Included in the list of fishing instruments was the konou.
The fishery census collected information on fishing activities and a limited number of
socio-economic variables through a one-time visit. The census questionnaire inquired after
4 “Quelle est la principale confession religieuse de cette personne?”. 5
“Quels engins de pêche avez-vous manipulés les 2 semaines passées?”.
28
religious adherence through a question about ‘religion’ (no full sentence was specified). The
answer coding included a separate code for Voodoo or animism (Vodoun).
6Information on the use of the konou was obtained in the census by asking the following
question: “Which of these fishing instruments/techniques do you use?”
7One of the categories
listed below this question was the konou.
Information on the closing of the lake during the household survey period was obtained
through semi-structured and open-ended interviews with members of the fishing committees.
Table B.2 provides a summary of the variables used in our analysis and how information
regarding these variables was collected in the survey and census.
6 Another answer category was ‘other traditional religions’. This answer category was not recorded in the entire
census dataset, indicating that there are no other important traditional or animistic religions besides Voodoo in this region.
7
“Lesquelles de ces unités/systèmes de pêches pratiquez-vous?”.
29
Table B.2: Summary of variables measured and questions asked Panel A: Household survey
Question/Definition Variable measured
"What fishing instruments have you used in the past two weeks?" Konou "What is the main religious confession of this person?" Voodoo Lake Nokoué was closed to the use of the konou during this week Closed
Age Age
"During how many years was this person in school (present, even
without passing)?" Years of education
Average daily earnings*days worked in 2008 per activity, summed
across activitiesa Annual income
Total number of persons living in the household Household size Ratio of dependent and active household membersb Dependency ratio "Provide the total value in FCFA obtained from the sales of shrimp
catches." Fishing revenue for shrimp
"How many days have you fished in each of the two past weeks?" Number of fishing days "Who has accompanied you while fishing during the past two
weeks?" Number of persons fishing
"What fishing instruments have you used in the past two weeks?" Other fishing gear
Panel B: Fishery Census
Question/Definition Variable measured
"Which of these fishing instruments/techniques do you use?" Konou
Religion Voodoo
Age Age
Level of education (categories, not years) Education
Number of dependent children Number of dependent children
Ethnicity Ethnicity
Source: Author’s 2009 household survey implemented and 2006 fishery census implemented by the government of Benin (UCN/PMEDP/Direction des Pêches) for FAO. Notes:
a: The corresponding questions in the survey are: "How many days per month did you engage in this activity in 2008?" and "How much did you earn on average per working day from this activity (net, i.e. after deduction of costs)?"
b: Dependent individuals are children (age<15) and elderly (age>60). Active members are individuals aged between 15 and 60.
C. The history of Voodoo and fisheries management in the south of Benin
According to Pliya (1980), in pre-colonial times the traditional Voodoo governance institution
managed to keep resource exploitation in check, even in the face of population growth. The
system started to fail, however, when the colonization of Benin brought about profound
socio-economic changes (Dangbégnon, 2000; Pliya, 1980). The traditional politico-religious structures
were undermined by new colonial and post-colonial powers, and these powers also introduced
Christian religions that started to compete with Voodoo. As the power of Voodoo declined, the
deterring effect of sanctions decreased. At the same time, the benefits of shirking increased with
the rising value of fishery products following commercialization and market integration of the
economy. The economic opportunities created by a growing fishing sector, combined with a
booming population, brought about large flows of internal migration to the southern lakes.
Newly settled agricultural communities started exploiting the lake resources as well, engaging in
a competition with the communities who had been full-time fishers since pre-colonial times.
These part-time fishers showed little respect for the traditional Voodoo system, fishing whenever
and wherever they chose, openly disobeying rules and undermining the authority of Voodoo
priests. The influx of outsiders thus further eroded the power of the Voodoo system and reduced
the incentives to obey the rules (Pliya, 1980).
The waning power of the traditional Voodoo institution led to an institutional vacuum,
which the Beninese government attempted to fill by creating new governance institutions. Yet,
these governmentally created institutions failed to effectively regulate fishing activities
(Dangbégnon, 2000; Pliya, 1980). Rules were left unmonitored, sanctions were too lenient and
punishments were rarely and inconsistently implemented. For instance, civil servants designated
to inspect the use of fishing gear explained to us that in the run-up to elections, the incumbent
attempts to win the votes of fishers by halting monitoring and certainly sanctioning (see also
Dangbégnon, 2000). Besides failing to effectively regulate the fishing activity, the central
government undermined the authority of Voodoo priests and the traditional rules that they
represented by creating new fishery management institutions and replacing traditional leaders
with government administrations (Pliya, 1980). For example, by enforcing the individual
property claim of acadja owners
8, the government broke with the long-established Voodoo
principle that preserved the lake and its resources as common property (Pliya, 1980).
Under the Marxist-Leninist regime in Benin (1972-1989) the government took a hostile
attitude towards Voodoo, actively targeting it with anti-religious campaigns and laws against
sorcery (Tall, 1995b). With the democratic renewal in the 1990s the tide turned: authorities
actively supported the Voodoo religion and promoted it as a symbol of national identity and
cultural heritage. Important signals of the new attitude towards Voodoo were the organization of
an annual national Voodoo festival and the enlistment of Voodoo in the constitution as an
official religion. The Voodoo religion regained vitality and became more and more organized as
a national traditional religion (Tall, 1995b).
8 The acadja is a type of brush park fishery where branches are placed in the bottom of the lake and fenced with a
fishing net. Owners guard their acadjas and allow no one else to harvest fish inside the fenced area.
32