HAL Id: hal-02413832
https://hal.inria.fr/hal-02413832v3
Submitted on 21 May 2020
HAL is a multi-disciplinary open access
archive for the deposit and dissemination of sci-entific research documents, whether they are pub-lished or not. The documents may come from teaching and research institutions in France or abroad, or from public or private research centers.
L’archive ouverte pluridisciplinaire HAL, est destinée au dépôt et à la diffusion de documents scientifiques de niveau recherche, publiés ou non, émanant des établissements d’enseignement et de recherche français ou étrangers, des laboratoires publics ou privés.
De novo long reads assembly using integer linear
programming
Victor Epain
To cite this version:
Victor Epain. De novo long reads assembly using integer linear programming. Operations Research [cs.RO]. 2019. �hal-02413832v3�
Université de Rennes 1
UFR Sciences de la Vie
et de l’Environnement
De novo long reads assembly
using integer linear programing
BioInformatic Master 1
Internship report
-Victor Epain
Inria research laboratory
RBA - Campus de Beaulieu 35042 Rennes CEDEX
GenScale Team
Under the responsabilty of:
Rumen Andonov, Inria
Dominique Lavenier, CNRS
Thanks
I would like to thank Rumen Andonov - my internship supervisor, for having shared with me the New Mexico and the research world incredible experiences, and Dominique Lavenier for sharing the ideas and accepting me in the GenScale team.
Also thank Hristo Djidjev for welcoming Mr Andonov and me at Los Alamos National Laboratory and having shared his knowledge in graph partitioning.
Thanks for Marie Le Roïc for being patient and helping me in administrative tasks, and for Émeline Roux for sharing her knowledge about bacteria genomes.
Finally, I would like to thank Sebastien François for helping me and discussing about the researches.
This internship has been supported by Inria associated team international program Hipcogen.
Contents
1 Introduction 1
1.1 The de novo assembly . . . 1
1.2 The linear optimization: a mathematical exact approach . . . 2
1.3 The loreas program: the first step of a long read assembler . . . 2
2 Material and methods 3 2.1 Material and tools . . . 3
2.2 Methods . . . 4
2.2.1 Using graph partition for huge overlaps graph . . . 7
2.2.2 Results obtention and options used . . . 8
3 Results 9 3.1 Long reads generation and alignment filter . . . 9
3.2 Ordering results . . . 9
3.3 The execution time . . . 11
4 Discussion 12 4.1 Expected filters behaviour . . . 12
4.2 Positive results for seven out of ten tested genomes . . . 12
4.3 loreas program is fast for bacteria genome . . . 12
4.4 One misplaced read for S. enterica: a strong repetition consequence . . . . 13
4.5 Unfeasibility of finding a path in the overlaps graph in A. baumannii: a wrong path in the parts graph . . . 13
4.6 Unfeasibility of finding a path in the parts graph in P. sp. MIT 0604 due to a cycle in the graph . . . 13
A Host Presentation ii A.1 The Inria Rennes laboratory . . . ii A.2 The GenScale team . . . ii A.3 The Los Alamos National Laboratory . . . ii
B Personal Review iii
C Supplementary methods iv
C.1 The heaviest path in an overlaps graph . . . iv C.2 The heaviest path in a parts graph . . . vi
D Supplementary data viii
D.1 Mapping coordinates variations results . . . viii D.2 A. baumannii supplementary figures . . . ix D.3 P. sp. MIT 0604 supplementary figures . . . ix
Introduction
1.1
The
de novo assembly
The long reads assembly advantage against repetitions in genomes In order to sequence a genome, it has to be cut in several sequences - called reads, with a reasonable length. Indeed, as assembly is based on similarity between two reads, it is important to know if this similarly does make sense or if it is an artefact due to too small sequences. Artefacts can be obtained because of repetitions in the genome - large repetitions imply more similarity artefacts. For bacteria genome, short repeated sequences are more abun-dant [1] due to evolution [2] but in the human genome repetitions are longer and in high frequency [3]. So using long reads permits to decrease the number of assembly errors due to artefacts, as they are more likely to contain the entire repetition - and especially an extremity which allows the differentiation of two same repetitions.
The long reads sequencing technology errors issue For the moment, short reads assembly seems to be more used than long reads assembly. Indeed, while Illumina tech-nology uses short reads and has a little error rate - with some substitutions, long reads sequencing technology as the Oxford Nanopore technology has approximately ten times more error with indel error type [4]. Also, the cost is two times higher according to the same source.
The current long reads assemblers For citing a couple of long reads assemblers, wtdbg2 [5] uses De Bruijn Graph just like spades [6], but combines normal k-mers and homopolymers-compressed k-mers to find read overlaps. Very fast, it should be more interesting using it for larger eukaryote genomes because of limited ressources it requires [7].
1.2
The linear optimization: a mathematical exact
ap-proach
While previously cited assemblers use De Bruijn Graph and heuristics, linear optimization permits to find an exact solution. Linear means that all the equations in the mathematical model are written as linear variables combinaison. As an example:
n X
i=1
Ci∗ xi ≤ B,where xi are variables, Ci and B constants, and n integers.
In a linear model, there is an objective function representing the aim of the math-ematical solver: maximize or minimize the value of a linear expression. Then, there are linear constraints directing the objective function to a wanted solution. The set of possibilities is reduced by these constraints and the permissible solutions are in the new subset.
As this project is based on mixed integer linear programming (MILP), the wanted variables for the solution are integer types, and finding the solution can be slow. The solving method is Branch and Bound [8]: it explores the tree of possibilities with using lower and upper bounds - compared with the current value of an admissible solution, in order to find the optimal solution or eliminate nodes - so reducing the tree exploration.
Choosing an exact approach with finding optimal solution should reducing assembly errors, added to sequencing errors. But this approach can be more time consuming than using heuristics.
1.3
The loreas program: the first step of a long read
assembler
Two steps composed the proposed assembly method: first, a main structure of the genome has to be found with ordering long reads, then a consensus sequence has to be done. The implemented pipeline named loreas during this internship executes the first step : it permits to obtain an order of long reads using MILP on overlaps graph - described in section 2.2, paragraph 3.
Material and methods
2.1
Material and tools
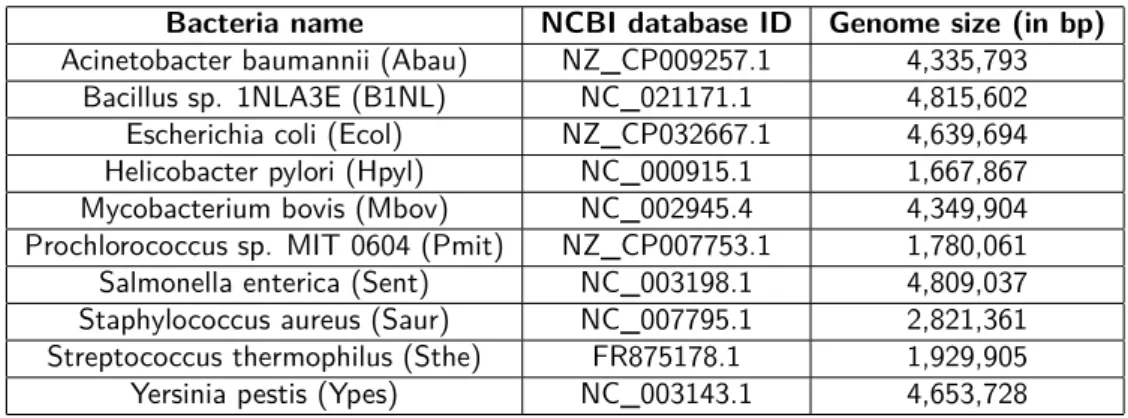
Bacteria genomes The following table contains the genomes used by loreas program in this study. All genomes were extracted from ncbi:
Bacteria name NCBI database ID Genome size (in bp)
Acinetobacter baumannii (Abau) NZ_CP009257.1 4,335,793
Bacillus sp. 1NLA3E (B1NL) NC_021171.1 4,815,602
Escherichia coli (Ecol) NZ_CP032667.1 4,639,694
Helicobacter pylori (Hpyl) NC_000915.1 1,667,867
Mycobacterium bovis (Mbov) NC_002945.4 4,349,904
Prochlorococcus sp. MIT 0604 (Pmit) NZ_CP007753.1 1,780,061
Salmonella enterica (Sent) NC_003198.1 4,809,037
Staphylococcus aureus (Saur) NC_007795.1 2,821,361
Streptococcus thermophilus (Sthe) FR875178.1 1,929,905
Yersinia pestis (Ypes) NC_003143.1 4,653,728
Table 2.1: The first column contains the name of bacteria used by LOREAS, while the second and the third columns report their NCBI ID and their size respectively.
DeepSimulator 1.5 [9] - an Oxford Nanopore long reads generator Deep-Simulator is an open source software which generates - thanks to machine learning, long reads from a reference genome with error generation close to Oxford Nanopore sequencing errors.
minimap2 2.17 [10] for long reads alignment minimap2 is a long reads aligner. It can make the mapping of long reads against a reference or make the overlap alignment of long reads against long reads. The advantage of minimap2 is the possibility of choosing the long reads sequencing origin - as Oxford Nanopore does or PacBio.
ampl 3.5.0 [11] optimization mathematical implementation language ampl is a mathematical commercial language. All the integer linear problems were written in this language.
gurobi 8.1.0 [12] solver to solve the implemented problems in ampl gurobi is a solver which solves MILP.
metis 5.1.0 [13] - a graph partitioner metis is a partitioner of undirected graphs.
Implementation with Python 3.6.8 [14] and Linux Bash 4.4.19 [15] All the programs were written in Python 3.6.8 version language. Also, the program uses the Python packages NetworkX 2.3 [16] for graph manipulation, matplotlib 3.1.1 [17] for graphic generation and NumPy 1.17.0 [18]. The scripts for the commands of the project and for the full pipeline were implemented in Bash 4.4.19.
gephi 0.9.2 [19] gephi 0.9.2 is an open free tool for visualizing graphs.
Run material The programs were executed on a personal laptop, on ubuntu 18.10 os. The laptop had 16 GB of ram, a processor Intel i5 7th generation with 2.50GHz of CPU and a nvidia GeForce GTX 1050 as GPU.
2.2
Methods
Long reads generation with DeepSimulator Long reads from bacteria genomes cited above were generated with DeepSimulator, using the Oxford Nanopore Technol-ogy official base-caller Albacore. The depth sequencing was set to 30X. In order to obtain the coordinates of long reads on the genome, minimap2 was used for mapping long reads on the reference genome with the option map-ont. In the sequel, these coordinates are called mapping coordinates.
Reads all vs all alignment with minimap2 and filter wanted overlap types All reads are aligned versus all the others. The alignments have to be filtered according the following overlap definition: an alignment between two long reads is considered as an overlap if the suffix of the first read overlaps with the prefix of the second read.
Because of sequencing issue, it is necessary to define a threshold, denoted xthr which permits flexibility on the read suffix-prefix definition.
However, if an alignment between two sequences, with respect to the threshold xthr, represents a read subsequence of the other, then this alignment is eliminated.
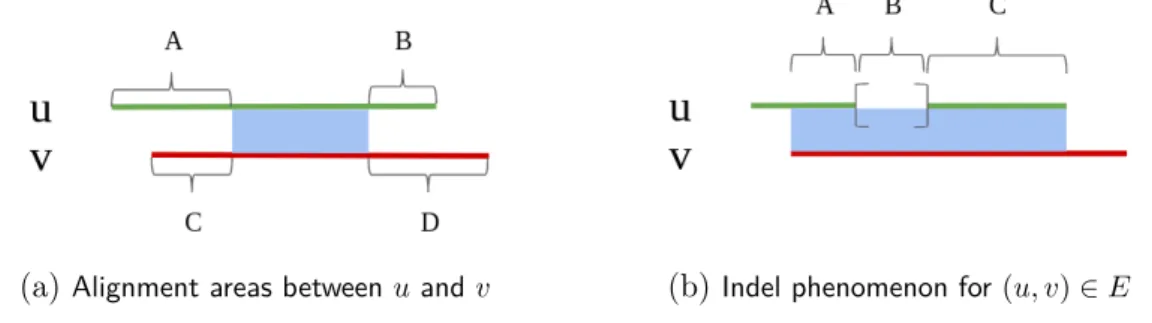
Let define in figure (2.1a) some alignment areas for reads u and v - aligned by min-imap2, in order to mathematically filter alignments:
(a)Alignment areas between u and v (b)Indel phenomenon for (u, v) ∈ E
Figure 2.1: u and v are two reads aligned each other by MINIMAP2. In (2.1a): the alignment area -so the nucleotide similarity between u and v, is represented by the blue colour; A, B, C and D are integers and represent the length of areas whose u and v nucleotides sequences were not considered as similar by the alignment software. In (2.1b): the square brackets represent the consequence of an indel on read u - it can be a deletion on u, or an insertion on v if the overlap between u and v is biologically true. A, B and C are now lengths of sub-overlapping where B is the length of the indel.
We assume, according figure (2.1a), that u overlaps v if, and only if:
(u, v) ∈ E ⇐⇒ C < xthr B < xthr C < A B < D
where E is the set of overlaps
During the sequencing step, some reads could have extra parts or at the opposite did not have nucleotide sequences from the real sequencing DNA fragment. Extra parts and deleted parts are respectively called insertion and deletion. More globally, both represent indel errors.
In order to take in account potential indel errors in a long reads alignment, we filter on the difference between the two read alignment lengths. Consider other areas for representing indel phenomenon with the figure (2.1b). The overlap (u, v) ∈ E is accepted
-according figure (2.1b), if and only if: B ≤
2×A+2×C+B 2 10
When the minimap2 alignments were filtered respecting the overlap definition and the indel threshold, let define the overlap length of the overlap (u, v) ∈ E λuv = A + B + C. Furthermore, let define guv the length of the global indel for the overlap (u, v) ∈ E as follow: guv = 0 if the indel is on u B else
Then, all the overlaps are considered on their overlap length by a global threshold -denoted by λmin, when λuv > λmin.
Creation of the overlaps graph Towards to order the reads, graph modelling is used. The overlaps graph G is defined as follow: G = (V, l, E, λ) where V is the set of vertices i.e. the set of long reads v of size lv, and E the set of edges i.e. the set of couples (u, v) ∈ V2, weighted by λuv. In the overlaps modelling, the graph G is directed, i.e. for u ∈ V and v ∈ V, if (u, v) ∈ E, (v, u) is not necessary in E.
So V is the set of long reads and E the set of overlaps. Depending of the local reads orientation - because the two complementary DNA strands are read in the opposite direction, the letters F and R - respectively for F orward and Reverse (which means the reverse complement of a read sequence), are ordered to nodes name. Let suppose the following overlap:
Figure 2.2: u and v are overlapping together: u in reverse orientation overlaps v in forward orientation is equivalent to say the reverse of v overlaps the forward of u. λuv is the length of the overlap (in blue). By
convention, λuRvF = λvRuF = λuv
It results in graph modelling as: uR vF λuRvF
or uF vR λvRuF
As the overlap graph is oriented, an orientation of all the reads has to be chosen. An arbitrary read is chosen and an orientation is given for it (let take the forward orientation). Then, all its neighbours, i.e. all the reads overlapping with it, obtain an
orientation according the overlap orientation. In the above example, if u is chosen F , then v has to be chosen R. When all the neighbours of the current read have an orientation, all the neighbours of a new oriented read have to get an orientation etc.
However, if a read w is discovered in both orientation then it and all the overlaps containing it are eliminated.
Finding the heaviest path in the overlap graph with mathematical program-ming approach Ordering the reads can be done by finding a path in the overlaps graph. We assume that a correct order of long reads is the heaviest path in the overlap graph i.e. finding a path that maximizes the number of overlaps under main constraints described bellow, using MILP:
• a long read can participate at most once - so it is either a starter, either an inter-mediate, either a terminal, or it does not participate in the path;
• there is only one starter read and only one terminal read;
• if the overlap (u, v) ∈ E - u and v two oriented reads, is chosen, the u’s right position and this of v must respect the overlap length λuv, the size of the reads and the gap guv.
All the mathematical model is described and interpreted in appendix C.1.
2.2.1
Using graph partition for huge overlaps graph
In loreas program, an overlaps graph G = (V, l, E, λ) is considered huge if card(E) > 2000. In this case, the graph G is partitioned in several parts.
Partitioning G using metis metis requires an undirected input graph. So temporar-ily, ∀(u, v) ∈ V2, (u, v) ∈ E =⇒ (v, u) ∈ E. Long reads are partitioned in several parts using the length of reads (the size of a node) and the overlap lengths (the weight of an edge): these partitioning options are specified with the option fmt = 011 in metis input file. Each of these parts is required to be one connected component1. If this condition is not satisfied, the corresponding part is separated in several connected components.
1"In graph theory, [...] a connected component, of an undirected graph is a sub-graph in which any
two vertices are connected to each other by paths" From Wikipedia, the free encyclopedia - Component (graph theory).
Parts graph modelling Denote by P the set of parts obtained in this way. As explained above, any of them is one connected component. Any couple (Pi, Pj) ∈ P is connected by an edge of the size wPiPj which corresponds to the total number of cut overlaps between
the reads in Pi and the reads in Pj:
Pi Pj
wPiPj
The graph ˜G = (P, Ep, wp)is called parts graph.
Finding the heaviest path in ˜G We want to know the order the parts have to be solved. This can be done by finding a path in the parts graph ˜G, so MILP is used to find the heaviest path i.e. choosing the maximum of cut overlaps under main constraints described bellow:
• a part must participate in the path, so it is either a starter, either an intermediate, or a terminal;
• there is only one starter part and only one terminal part.
The entire mathematical model is described and interpreted in appendix C.2.
Once the heaviest path in ˜G is found, each one of the parts Pi has to be solved, that is finding the heaviest path in the overlaps graph GPi = (VPi, EPi, λ). So the first part in
the path is solved, with taking care of the possibility to make the link with the second one, and this until the last part in the parts graph.
Merging all the paths obtained in any of the parts Once each part Pi of the parts in ˜G is solved with finding its path pathi, all the paths are merged to obtain the final path pathf. Let us denote by Vf the set of reads in pathf, and by Ef the set of couple (u, v) ∈ Vf2, where u and v are two consecutive reads in pathf.
2.2.2
Results obtention and options used
The following table contains the final tests options for each bacteria:
Bacteria id Abau B1NL Ecol Hpyl Mbov Pmit Sent Saur Sthe Ypes
λmin 5000 5000 5000 5000 7000 5000 5000 5000 5000 4000
xthr 100 100 100 100 100 100 100 100 100 100
Table 2.2: Options used for obtaining LOREAS results. The λmin represents the threshold of minimum
overlap length; xthr is the threshold described in section 2.2, paragraph 2. When the overlaps graphs have to
Results
3.1
Long reads generation and alignment filter
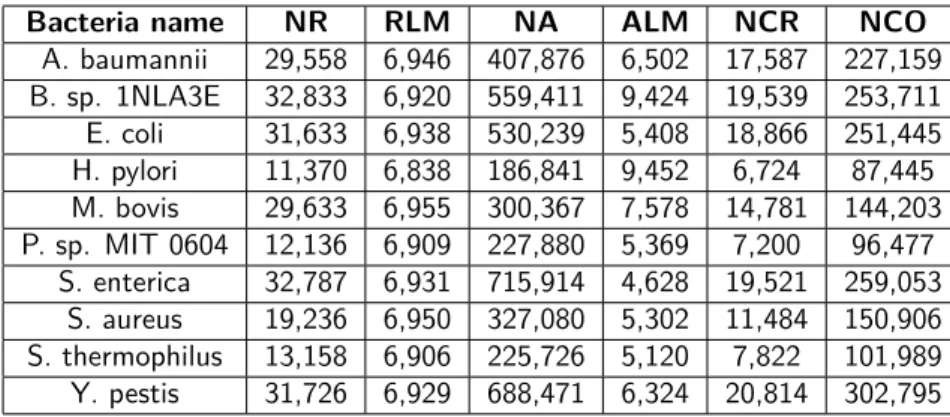
The following table summarizes the long reads generation with DeepSimulator, shows the effect on the number of minimap2 alignments and on the number of reads after filtering according the overlap definition given in section 2.2, paragraph 2:
Bacteria name NR RLM NA ALM NCR NCO
A. baumannii 29,558 6,946 407,876 6,502 17,587 227,159 B. sp. 1NLA3E 32,833 6,920 559,411 9,424 19,539 253,711 E. coli 31,633 6,938 530,239 5,408 18,866 251,445 H. pylori 11,370 6,838 186,841 9,452 6,724 87,445 M. bovis 29,633 6,955 300,367 7,578 14,781 144,203 P. sp. MIT 0604 12,136 6,909 227,880 5,369 7,200 96,477 S. enterica 32,787 6,931 715,914 4,628 19,521 259,053 S. aureus 19,236 6,950 327,080 5,302 11,484 150,906 S. thermophilus 13,158 6,906 225,726 5,120 7,822 101,989 Y. pestis 31,726 6,929 688,471 6,324 20,814 302,795
Table 3.1: For each bacteria, the number of long generated reads (NR), the median of generated reads lengths (RLM), the number of MINIMAP2 alignments (NA), the median of MINIMAP2 alignments lengths (ALM), the number of considered overlaps (NCO) and the number of considered reads (NCR) are given.
3.2
Ordering results
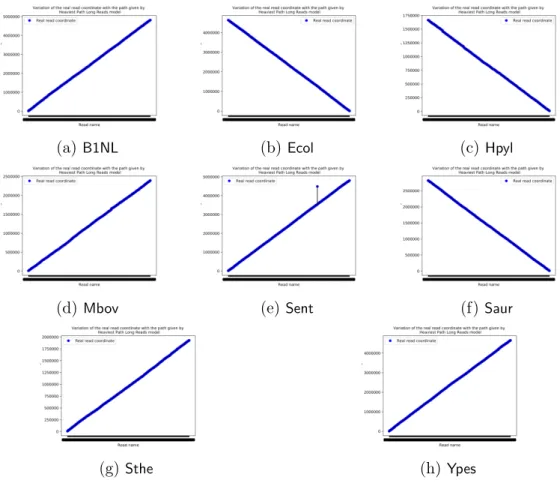
In order to know if the final order was correct, local and global mapping coordinates variations were visualized. Indeed, if the global mapping coordinates variation was monotonous, then the order is correct. Two measures were used and compared: the global increasing variation (GIV ) and the global decreasing variation (GDV ) calculated as following: GIV = X (u,v)∈Ef cv−cu>0 (cv − cu) GDV = X (u,v)∈Ef cv−cu<0 |cv− cu|
where Ef is defined above in subsection 2.2.1, paragraph 4, cu and cv are respectively the mapping coordinate of reads u and v on the reference genome.
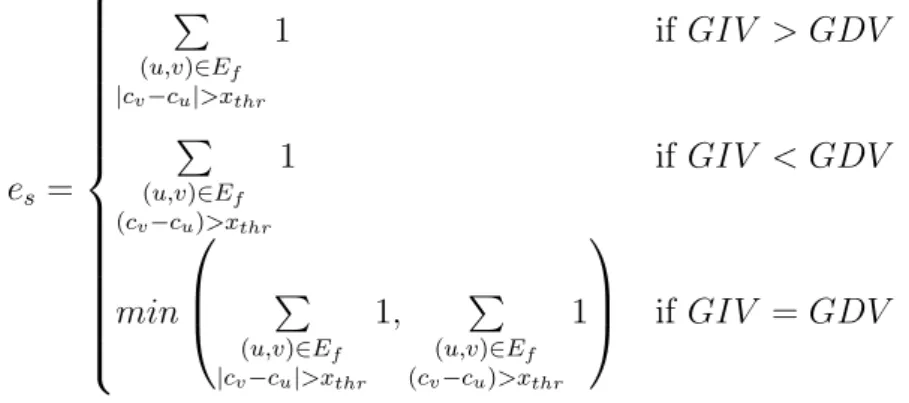
Also, let us denote by es the number of misplaced reads defined by:
es= P (u,v)∈Ef |cv−cu|>xthr 1 if GIV > GDV P (u,v)∈Ef (cv−cu)>xthr 1 if GIV < GDV min P (u,v)∈Ef |cv−cu|>xthr 1, P (u,v)∈Ef (cv−cu)>xthr 1 if GIV = GDV
Where u is the predecessor of v in the final path pathf. Indeed, some variations were due to indel error type and not to an incorrect ordering.
Finally, let introduce the ratio RC = |GIV −GDV | sizegenome .
The following table summarizes the GIV , GDV , es and RC values for each tested genomes:
Bacteria name GIV (in bp) GDV (in bp) es RC (in %)
A. baumannii Unfeasible: impossibility of linking two parts
B. sp. 1NLA3E 4,796,947 4 0 99.61
E. coli 20 4,632,003 0 99.83
H. pylori 4 1,656,989 0 99.35
M. bovis 2,385,520 0 0 54.84
P. sp. MIT 0604 Unfeasible: no paths could be found in the parts graph
S. enterica 5,751,209 951,718 1 99.80
S. aureus 7 2,812,231 0 99.68
S. thermophilus 1,921,092 19 0 99.54
Y. pestis 4,647,944 37 0 99.87
Table 3.2: For each bacteria, global mapping coordinates variations GIV and GDV , the number of mis-placed reads esand the ratio RC are written. In case of infeasibility i.e. if no solutions were given, the reason
is described.
All the variations graphics are in appendix D, section D.1. A. baumannii and P. sp. MIT 0604 supplementary results are specified in appendix D, sections D.2 and D.3 respectively.
3.3
The execution time
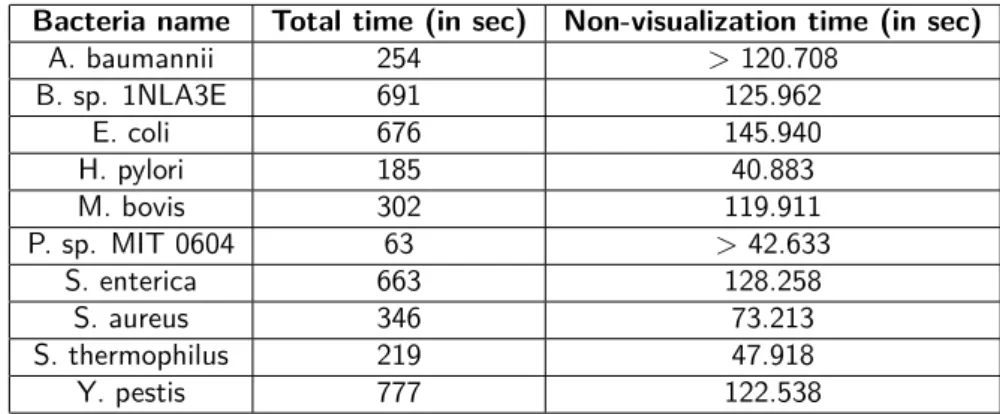
In any of the cases, graphs - in order to visualize existing graph issue, and mapping coordinates variation graphics were build. The total real time takes in account the real execution time of graph-graphic building while non-visualization time does not:
Bacteria name Total time (in sec) Non-visualization time (in sec)
A. baumannii 254 > 120.708 B. sp. 1NLA3E 691 125.962 E. coli 676 145.940 H. pylori 185 40.883 M. bovis 302 119.911 P. sp. MIT 0604 63 > 42.633 S. enterica 663 128.258 S. aureus 346 73.213 S. thermophilus 219 47.918 Y. pestis 777 122.538
Table 3.3: Real execution times for each tested bacteria. The total time takes in account all the visualization needed for verifying the solution and the execution time of inputs creation while non-visualisation time is the sum of MINIMAP2, METIS, finding paths in parts graph and in all the overlaps graphs execution times.
Discussion
4.1
Expected filters behaviour
According to Table (3.1), for all the tested genomes, the number of considered overlaps was expected with regard to the value of ALM comparing to the threshold λmin chosen. Surprisingly, for all the genomes, the number of filtered long reads is approximately the half of the original number.
4.2
Positive results for seven out of ten tested genomes
According Table (3.2) with figures (D.1a), (D.1b), (D.1c), (D.1d), (D.1f), (D.1g) and (D.1h), all ordered reads were correctly placed, in the case of genomes B. sp. 1NLA3E, E. coli, H. pylori, M. bovis, S. aureus, S. thermophilus and Y. pestis.
Furthermore, according to Table (2.1) and Table (3.2), for the same genomes except for M. bovis, the ratio RC are all greater than 99% - without taking in account the size of the first chosen read in the final path pathf, because of the mapping coordinate which is at the right end of the reads.
The ratio RC for M. bovis is due to the threshold λmin = 7000. So it seems that the ends of the genomes were missing in the ordering.
4.3
loreas program is fast for bacteria genome
For all the genomes, the real execution time with taking care of graphs and results visu-alizations is low (less than 12 minutes) while mathematical optimization was used.
4.4
One misplaced read for S. enterica: a strong
repe-tition consequence
The ratio min(GIV,GDV )
max(GIV,GDV ) for S. enterica is equals to 16.55% and the huge value of GDV was due to the only one misplaced read - according to the definition of es. Indeed, the global monotonous of the function f(pi) = mappingCoordinates - where pi is the sequence of ordered reads that gives for i ∈ N the ith reads in the overlaps graph path, is affected by just this read, with respect to figure (D.1e).
4.5
Unfeasibility of finding a path in the overlaps graph
in A. baumannii: a wrong path in the parts graph
loreas program raised a part linking error. Indeed, according to figures (D.2a) and (D.2b), the path in the parts graph was wrong. The impossibility of making a link can be explained by the fact that the parts graph was undirected while when the parts had to be solved sequentially, their overlaps graph was directed. In this case, the edge (11,10) in (D.2b) should not have been chosen. It was because the link between part 11 and part 10 is very strong, due to repeated regions. According to the model, choosing this edge and choosing this path maximizes the value of the objective function and made it greater than if the real path was chosen.
4.6
Unfeasibility of finding a path in the parts graph
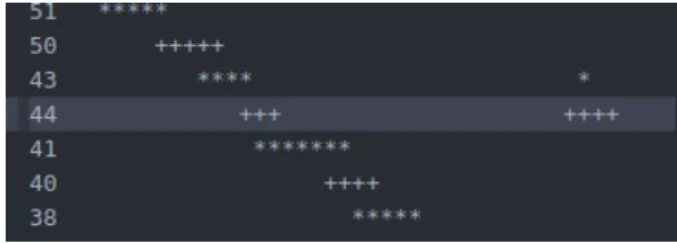
in P. sp. MIT 0604 due to a cycle in the graph
With respect to figure (D.3a), the parts graph had a cycle, with origin the part 44. The figure (D.3b) shows the cause of this cycle: the part 44 had two distinct genome regions. The non-separation and the non-existence of two distinct connected components in the part 44 overlaps graph is due to strong repeated region. As only the part 44 made the link between 43 - 44 and between its two neighbouring parts, a cycle is formed in the parts graph. As all the parts have to be chosen once - and only once, finding a path in the parts graph infeasible because of this cycle.
Conclusion
loreas program gave very positive results for seven out of ten bacteria genomes in a reasonable execution time for a low simulated long reads sequencing depth. However, even using long reads sequencing, strong repeated regions continued to be source of errors. As the verification of misplaced reads depends on the mapping coordinates on the reference genome, using minimap2 for determining reads’ coordinates with mapping reads on the reference genome is questionable: when a read has been mapped on two regions, the better region is chosen. However, with indel errors, it is not ensured that the sequenced read is a part of the better region - especially for repeated regions.
In order to prevent wrong path in the parts graph, we intend to make it directed by choosing an arbitrary read and orient it in order to giving a global orientation. The same algorithm as described in section 2.2, paragraph 3, can be used for this purpose.
Furthermore, to prevent cycle in the parts graph, merge all parts of the cycle with the cycle origin can be done. Another idea is to partition the cycle origin part.
Also, avoiding misplaced reads when solving the heaviest path in an overlaps graph can be realized using an a posteriori verification of non-created-inexistant-overlaps with the found ordering.
Another issue is the lost of genome extremities coverage when the threshold λmin on the overlaps length is too stringent. To solve this, keeping the positive result of a higher threshold execution and add overlaps with a lower overlap length was envisaged. But currently, no working algorithm with positive result was created.
In this study, the second task - building a consensus sequence, was not realized. Mak-ing it will allow to add genome extremities with mappMak-ing the filtered reads on the pre-consensus sequence got with a higher λmin threshold.
Bibliography
[1] Ekaterina Avershina and Knut Rudi. Dominant short repeated sequences in bacterial genomes. Genomics, 105(3):175–181, March 2015.
[2] Nicholas Delihas. Impact of Small Repeat Sequences on Bacterial Genome Evolution. Genome Biology and Evolution, 3:959–973, January 2011.
[3] A. P. Jason de Koning, Wanjun Gu, Todd A. Castoe, Mark A. Batzer, and David D. Pollock. Repetitive Elements May Comprise Over Two-Thirds of the Human Genome. PLoS Genetics, 7(12), December 2011.
[4] Stephane Derocles, David Bohan, Alex J. Dumbrell, James Kitson, François Massol, Charlie Pauvert, Manuel Plantegenest, Corinne Vacher, and Darren Evans. Biomoni-toring for the 21st Century: Integrating Next-Generation Sequencing Into Ecological Network Analysis. Advances in Ecological Research, 58:1–62, January 2018.
[5] Jue Ruan and Heng Li. Fast and accurate long-read assembly with wtdbg2. Nature Methods, 17(2):155–158, February 2020.
[6] Anton Bankevich, Sergey Nurk, Dmitry Antipov, Alexey A. Gurevich, Mikhail Dvorkin, Alexander S. Kulikov, Valery M. Lesin, Sergey I. Nikolenko, Son Pham, Andrey D. Prjibelski, Alexey V. Pyshkin, Alexander V. Sirotkin, Nikolay Vyahhi, Glenn Tesler, Max A. Alekseyev, and Pavel A. Pevzner. SPAdes: a new genome assembly algorithm and its applications to single-cell sequencing. Journal of Compu-tational Biology: A Journal of CompuCompu-tational Molecular Cell Biology, 19(5):455–477, May 2012.
[7] Ryan Wick. Benchmarking of long-read assembly tools for bacterial whole genomes: rrwick/Long-read-assembler-comparison, July 2019. original-date: 2019-05-10T07:03:32Z.
[9] Yu Li, Renmin Han, Chongwei Bi, Mo Li, Sheng Wang, and Xin Gao. DeepSimu-lator: a deep simulator for Nanopore sequencing. Bioinformatics, 34(17):2899–2908, September 2018.
[10] Heng Li. Minimap2: pairwise alignment for nucleotide sequences. Bioinformatics, 34(18):3094–3100, September 2018.
[11] David M. Gay. The AMPL Modeling Language: An Aid to Formulating and Solv-ing Optimization Problems. In Mehiddin Al-Baali, Lucio Grandinetti, and Anton Purnama, editors, Numerical Analysis and Optimization, volume 134, pages 95–116. Springer International Publishing, Cham, 2015.
[12] Edward Rothberg, Robert Bixby, and Zonghao Gu. Gurobi Optimization - The State-of-the-Art Mathematical Programming Solver.
[13] George Karypis and Vipin Kumar. A Fast and High Quality Multilevel Scheme for Partitioning Irregular Graphs. SIAM J. Sci. Comput., 20(1):359–392, December 1998.
[14] Python Software Foundation. Python Language Reference. [15] Chet Ramey. GNU Bourne-Again SHell.
[16] Aric A. Hagberg, Daniel A. Schult, and Pieter J. Swart. Exploring Network Structure, Dynamics, and Function using NetworkX. In Gaël Varoquaux, Travis Vaught, and Jarrod Millman, editors, Proceedings of the 7th Python in Science Conference, pages 11 – 15, Pasadena, CA USA, 2008.
[17] J. D. Hunter. Matplotlib: A 2D Graphics Environment. Computing in Science Engineering, 9(3):90–95, May 2007.
[18] Stéfan van der Walt, S. Chris Colbert, and Gaël Varoquaux. The NumPy Array: A Structure for Efficient Numerical Computation. Computing in Science & Engineering, 13(2):22–30, March 2011.
[19] M. Bastian, S. Heymann, and M. Jacomy. Gephi: an open source software for exploring and manipulating networks. International AAAI Conference on Weblogs and Social Media, 2009.
[20] Sebastien François, Rumen Andonov, Dominique Lavenier, and Hristo Djidjev. Global optimization approach for circular and chloroplast genome assembly. bioRxiv, page 231324, December 2017.
[21] Sebastien François, Rumen Andonov, Hristo Djidjev, and Dominique Lavenier. Global Optimization Methods for Genome Scaffolding. September 2016.
Host Presentation
A.1
The Inria Rennes laboratory
The Inria Rennes is a computer science laboratory, associated with irisa laboratory. The laboratory maintains collaborations with CentraleSupélec, CNRS, ENS Rennes, IMT Atlantique, INSA Rennes, Université de Bretagne Sud (UBS) and Uni-versité de Rennes 1.
A.2
The GenScale team
The GenScale team is a bio-informatics research team. The team develops scalable methods, algorithm and software for processing genomic data. It is composed by re-searchers teachers, engineers, post-PhD, PhD students. Collaborations exist with inter-national teams, for example with HipcoGen. I worked with Rumen Andonov, a Rennes 1 researcher teacher, Dominique Lavenier, the group leader and CNRS Research Di-rector, and Sebastien François, the PhD student of Mr Andonov.
A.3
The Los Alamos National Laboratory
During this internship, I had the luck to visiting the Los Alamos National Lab-oratory, in New Mexico, USA. The laboratory has several departments in computer sciences. Mr Andonov, Mr Lavenier and me visiting Hristo Djidjev, for working on graph partitioning, and working on integer linear programming.
Personal Review
During this internship, I had the great opportunity to discover the research world, and especially internationally thanks to working at Los Alamos National Laboratory and participating in a 3-days conferences at sfaf meeting in Santa Fe.
I really appreciated working with Mr Andonov, Mr Lavenier and Mr Djidjev. Indeed, sharing scientific ideas was very efficient and interesting.
I was really focused on my work during these three months and this was very instructive for building my scientific reasoning.
However, this remembered me that sleeping correctly is important to be concentrated and so as to remain psychologically stable.
I have learned a lot of things especially in programming optimisation with Python, in graph modelling and in mathematical approaches.
This experience confirms my willingness to continue towards a thesis, and then engage in the world of scientific research.
Supplementary methods
C.1
The heaviest path in an overlaps graph
Validity hypothesis
• There are at least two reads;
• There is only one connected component; • There is no read subsequence of an other.
The data Let the overlaps graph G = (V, l, E, λ), where V the set of vertices - the set of long reads of size l, E the set of edges the overlaps, and λ the associated weight -where ∀(u, v) ∈ E, λuv is the (u, v) overlap length. Too, let define ∀v ∈ V, lv the length of read v, ∀(u, v) ∈ E, guv the (u, v) overlap gap defined in section 2.2, paragraph 2, and M = P
v∈V lv.
Let define the set S ⊆ V - the set of long reads starter candidates, the set I ⊂ V - the set of long reads knowing for sure as intermediate or not participating reads, and the set T ⊆ V - the set of long reads terminal candidates.
This model uses the GAT formulation [20]. The variables Let define
∀(u, v) ∈ E, Xuv =
1 if the edge (u, v) is participating in the path 0 else
∀v ∈ V:
• sv ∈ [0, 1]1, where sv = 1 if the read v is the first part in the final path, else sv = 0; • iv ∈ [0, 1]1, where iv = 1 if the read v is an intermediate part in the final path, else
iv = 0;
• tv ∈ [0, 1]1, where tv = 1 if the read v is the first part in the final path, else tv = 0. The objective function maximize P
(u,v)∈E
Xuv: choosing the final path participating edges - the participating overlaps, with maximizing the number of overlaps.
The constraints • ∀(u, v) ∈ E
yv ≥ yu+ (lv− λuv+ guv) ∗ Xuv− (1 − Xuv) ∗ M yv ≤ yu+ (lv− λuv+ guv) ∗ Xuv+ (1 − Xuv) ∗ M
If the overlap (u, v) is chosen, then the right positions of u and v must respect the overlaps features;
• ∀v ∈ V, yv ≥ sv ∗ lv: initializes the value of y for the first chosen read;
• ∀v ∈ V, sv+ iv+ tv ≤ 1: the read is starter, intermediate, terminal, or not partici-pating in the final path;
• P v∈V
sv = 1: there is only one starter read; • P
v∈V
tv = 1: there is only one terminal read; • ∀v ∈ V, P
(v,u)∈E
Xvu = sv + iv: a starter or an intermediate read has at least one successor in the final path;
• ∀v ∈ V, P (u,v)∈E
Xuv = iv + tv: an intermediate or a terminal read has at least one predecessor in the final path;
• P v∈S
sv = 1: there is only one starter candidate which is starter; • P
v∈I
sv+ tv = 0: an intermediate candidate cannot be either a starter or a terminal; • P
v∈T
tv = 1: there is only one terminal candidate which is terminal;
• ∀v ∈ V, iv + tv ≤ |{(u, v) ∈ E}|: if there are no input edges, the read v cannot be intermediate or terminal;
• ∀v ∈ V, sv+ iv ≤ |{(v, u) ∈ E}|: if there are no output edges, the read v cannot be starter or intermediate;
C.2
The heaviest path in a parts graph
Validity hypothesis
• There are at least two parts;
• There is only one connected component.
The data Let the parts graph G = (V, E, w), where V the set of vertices - the set of parts, E the set of edges - the parts links, and w the associated weight - where ∀(u, v) ∈ E, wuv is the number of cut overlaps between part u and part v. Finally, let define M =P
(u,v)∈Ewuv. This model uses the GAT formulation [20]. The variables Let define
∀(u, v) ∈ E, Xuv =
1 if the edge (u, v) is participating in the path 0 else
∀v ∈ V:
• yv ∈ [0, |V | + 1] the position of part v in the final path;
• sv ∈ [0, 1]1, where sv = 1 if the part v is the first part in the final path, else sv = 0; • iv ∈ [0, 1]1, where iv = 1if the part v is an intermediate part in the final path, else
iv = 0;
• tv ∈ [0, 1]1, where tv = 1 if the part v is the first part in the final path, else tv = 0. The objective function maximize P
(u,v)∈E
Xuv∗ wuv: choosing the final path partici-pating edges with maximizing the weight so the number of cut overlaps between parts.
The constraints • P
(u,v)∈E
Xuv= |V | − 1: all the parts participate in the final path;
• ∀(u, v) ∈ E, yv ≥ (yu+ 1) ∗ Xuv− (1 − Xuv) ∗ M: a part participate only once; • ∀v ∈ V, yv ≥ sv: initializes the value of y for the first chosen part;
• ∀v ∈ V, sv + iv + tv ≤ 1: the part is starter, intermediate, or terminal; • P
v∈V
sv = 1: there is only one starter part; • P
v∈V
tv = 1: there is only one terminal part; • ∀v ∈ V, P
(v,u)∈E
Xvu = sv + iv: a starter or an intermediate part has at least one successor in the final path;
• ∀v ∈ V, P (u,v)∈E
Xuv = iv + tv: an intermediate or a terminal part has at least one predecessor in the final path;
• ∀v ∈ V, iv+ tv ≤ |{(u, v) ∈ E}|: if there are no input edges, the part v cannot be intermediate or terminal;
• ∀v ∈ V, sv+ iv ≤ |{(v, u) ∈ E}|: if there are no output edges, the part v cannot be starter or intermediate;
Supplementary data
D.1
Mapping coordinates variations results
(a) B1NL (b)Ecol (c)Hpyl
(d)Mbov (e)Sent (f)Saur
(g)Sthe (h) Ypes
Figure D.1: Ordered reads mapping coordinates variation graphics. For all graphics, the x axis is the name of reads, in y axis there are the coordinates. (D.1a) B. sp. 1NLA3E; (D.1b) E. coli; (D.1c) H. pylori; (D.1d) M. bovis; (D.1e) S. enterica; (D.1f) S. aureus; (D.1g) S. thermophilus; (D.1h) Y. pestis.
D.2
A. baumannii supplementary figures
(a)Reads in parts mapped on reference (b) Parts graph and the chosen path in green
Figure D.2: The cause of the error for A. baumannii: a wrong path in the parts graph. In (D.2a), the vertical axis represents the parts name which are sorted according to where the majority of their reads are on the reference genome, the horizontal axis represents where the longer reads of a part maps on the reference genome. In (D.2b) is represented the place of the parts graph where the path - in green, is wrong.
D.3
P. sp. MIT 0604 supplementary figures
(a) Parts graph with the cycle, whose part 44 is the cycle origin
(b)Reads in parts mapped on reference
Figure D.3: The cause of the error for P. sp. MIT 0604: a cycle in the parts graph. In (D.3a) is represented the parts graph with a cycle. In (D.3b), the vertical axis represents the parts name which are sorted according to where the majority of their reads are on the reference genome, the horizontal axis represents where the longer reads of a part maps on the reference genome.
De novo long reads assembly using integer linear programming
In silico studying a genome requires two steps: sequencing it with cloning and cutting the genome in several reads, and then, assembling the reads. It is well known that the number of sequencing errors is proportional to the reads’ size. However, the use of long reads can be an advantage against genome repeated regions issues. De novo is an assembly method which does not use a reference. The purpose of the described here tool, named loreas, is to be a de novo assembler in two tasks: first, ordering the long reads, and then, obtaining a consensus sequence of the ordered reads. Currently, only the first task was realised. While other de novo long reads assemblers use heuristics and De Bruijn graphs, loreas is based on overlaps similarity between all the long reads. It uses integer linear programming, to find the heaviest path in a graph G = (V, E, λ), where V is the vertices set corresponding to the long reads set, E the set of edges associated with the overlaps between long reads - weighted by λ: the overlap length. When this graph is too huge, the set of reads V is partitioned in several parts. Then, all the parts are solved sequentially. Here we present the solution concerning the first task related to ten bacteria genomes. Seven of them have been successfully solved for less than 12 minutes on a laptop.
overlaps graph - mathematical programming - graph partitioning - exact algorithm - heaviest path problem
Assemblage de novo de longues lectures par programmation linéaire
Étudier in silico un génome nécessite deux principales tâches : le séquencer, en le clonant puis en le découpant en plusieurs lectures, puis assembler les lectures. Les erreurs de séquençage dépendent de la taille des lectures générées : le taux d’erreur pour les longues lectures est plus important que celui des courtes lectures. Toutefois, les longues lectures permettent de contrer les problèmes issus des régions génomiques répétées. L’assemblage de novo est une méthode qui n’a pas besoin de référence. Le programme présenté loreas, a pour but d’être un assembleur de novo en deux étapes : la première consiste à donner un ordonnancement des longues lectures, la deuxième, réaliser une séquence consensus des lectures ordonnancées. Pour le moment, seule la première étape fut réalisée. Alors que d’autres assembleurs de novo usent d’heuristiques et des graphes de De Bruijn, loreas est basé sur les similarités de chevauchements entre toutes les lectures. À cette fin, la programmation linéaire en nombres entiers permet de trouver le plus lourd chemin dans un graph G = (V, E, λ), où V est l’ensemble des sommets qui sont les longues lectures, E l’ensemble des arcs représentant les chevauchements entre les longues lectures - pondérés par λ, la longueur de chevauchement. Si le graphe précédent est trop important, l’ensemble V est partitionné en parties distinctes, puis toutes les parties sont résolues séquentiellement. Dix génomes de bactéries simulés séquencés furent résolus pour la tâche d’ordonnancement des longues lectures. Il en résulte sept résultats positifs sur dix obtenus en moins de 12 minutes sur un ordinateur portable.
graphe de chevauchements - programmation mathématique - partitionnement de graphes - algorithme exact - problème du plus lourd chemin