Supplementary material S2 - Supplementary tables and figures
Automated conservation assessment of the orchid family using deep learning
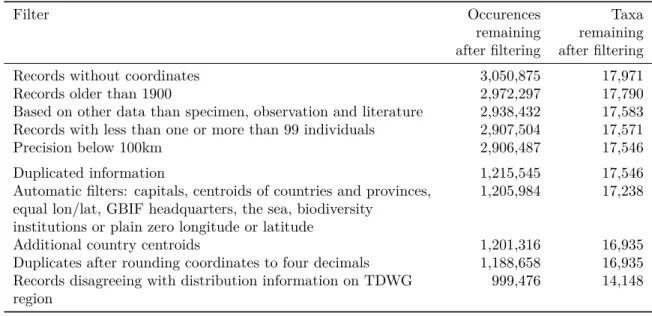
Table 1: The impact of individual geographic filters on the number of occurrence records and taxa available. Filter Occurences remaining after filtering Taxa remaining after filtering
Records without coordinates 3,050,875 17,971
Records older than 1900 2,972,297 17,790
Based on other data than specimen, observation and literature 2,938,432 17,583 Records with less than one or more than 99 individuals 2,907,504 17,571
Precision below 100km 2,906,487 17,546
Duplicated information 1,215,545 17,546
Automatic filters: capitals, centroids of countries and provinces, equal lon/lat, GBIF headquarters, the sea, biodiversity
institutions or plain zero longitude or latitude
1,205,984 17,238
Additional country centroids 1,201,316 16,935
Duplicates after rounding coordinates to four decimals 1,188,658 16,935 Records disagreeing with distribution information on TDWG
region
999,476 14,148
Table 2: The confusion matrices for index-based automated conservation assessment methods compared to conservation assessments provided on the IUCN RL in four detailed categories.
IUCN Assessment AA method Spatial cleaning CR EN VU LC or NT ConR CR full 31.4 26.1 10.5 32.0 EN full 11.3 36.7 12.3 39.7 VU full 2.7 35.1 18.2 43.9 LC or NT full 0.8 8.3 15.8 75.1 CR medium 29.1 27.3 12.7 30.9 EN medium 13.1 38.5 11.2 37.2 VU medium 3.1 34.4 22.1 40.5 LC or NT medium 1.1 8.7 15.2 75.1 CR raw 36.6 24.2 11.1 28.1 EN raw 15.0 39.8 9.8 35.5 VU raw 2.8 32.8 23.2 41.2 LC or NT raw 0.7 10.3 15.2 73.8 rCat CR full 27.6 28.3 9.4 34.6 EN full 8.1 56.6 12.1 23.2 VU full 2.2 39.8 21.5 36.6 LC or NT full 1.9 14.0 15.7 68.3 SPGC CR full 42.9 42.9 0.0 14.3 EN full 21.7 36.1 10.4 31.8 VU full 2.1 40.4 21.3 36.2
Table 3: The confusion matrix for the prediction based IUC-NN model predicting detailed IUCN RL classes. IUCN assessment IUC-NN CR EN VU NT LC Best Model CR 46.2 30.8 0.0 0 23.1 EN 4.2 83.3 4.2 0 8.3 VU 0.0 57.1 0.0 0 42.9 NT 0.0 0.0 0.0 25 75.0 LC 0.0 11.8 0.0 0 88.2 All features CR 38.5 46.2 0.0 0 15.4 EN 0.0 87.5 0.0 0 12.5 VU 7.1 35.7 14.3 0 42.9 NT 0.0 50.0 0.0 0 50.0 LC 2.9 11.8 0.0 0 85.3
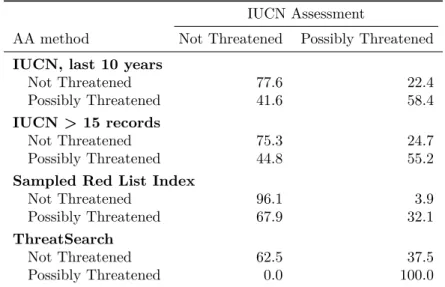
Table 4: The confusion matrix for ConR using different data than the global IUCN RL as gold standard. IUCN Assessment
AA method Not Threatened Possibly Threatened IUCN, last 10 years
Not Threatened 77.6 22.4
Possibly Threatened 41.6 58.4
IUCN > 15 records
Not Threatened 75.3 24.7
Possibly Threatened 44.8 55.2
Sampled Red List Index
Not Threatened 96.1 3.9
Possibly Threatened 67.9 32.1
ThreatSearch
Not Threatened 62.5 37.5
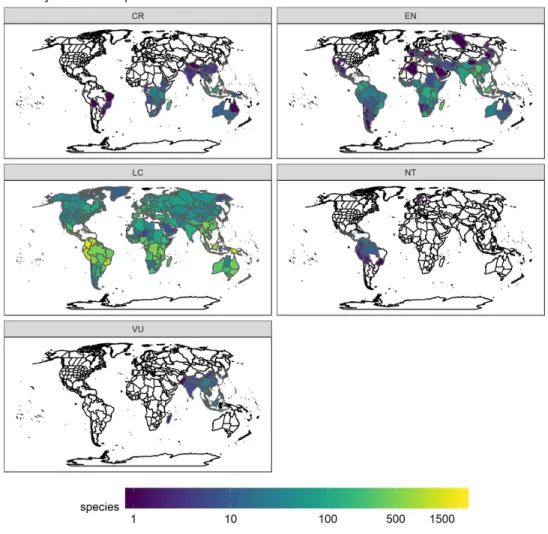
Figure 1: The number of orchid species classified as Critically Endangered (CR), Endangered (EN), Vulnerable (VU), Near Threatened (NT), and Least Concern (LC) by the automated conservation assessment using
Tundra Boreal forest Flooded savanna and grassland Temperate savanna & grassland Mangrove Temperate coniferous forest Desert & xeric shrubland Mediterranean woodland Tropical coniferous forest Temperate mixed forest Tropical dry broadleaf forest Tropical savanna & grassland Montane grassland and shrubland Tropical moist broadleaf forest
0 3000 6000 9000
Species
Critically Endangered (CR) Endangered (EN) Vulnerable (VU) Near Threatened (NT) Least Concern (LC)Figure 2: Detailed conservation status of orchids per biome, based on the automated assessment. Biomes following Olson et al. (2001), the biome names have been shortened for better readability.
Figure 3: The relationship between prediction accuracy of automated assessments and the threat categories identified by IUCN RL for a species.
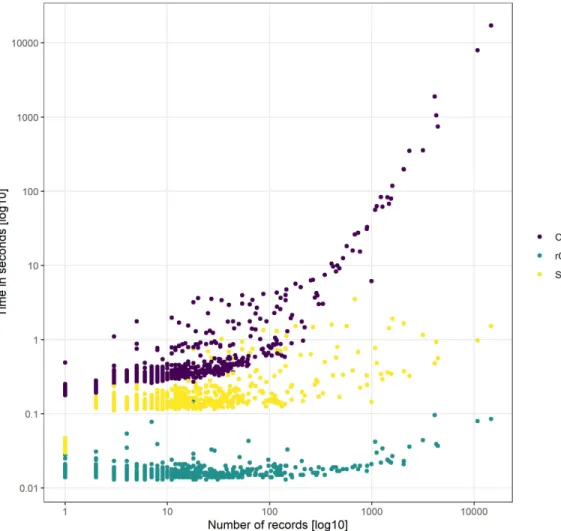
Figure 4: The computation time necessary for index-based AA with different methods. Computation time increases with the number of records, most importantly so for the ConR method. Note the log transformation of both axes. Most species were evaluated in less than one second.