HAL Id: hal-00525936
https://hal.archives-ouvertes.fr/hal-00525936
Submitted on 13 Oct 2010
HAL is a multi-disciplinary open access
archive for the deposit and dissemination of
sci-entific research documents, whether they are
pub-lished or not. The documents may come from
teaching and research institutions in France or
abroad, or from public or private research centers.
L’archive ouverte pluridisciplinaire HAL, est
destinée au dépôt et à la diffusion de documents
scientifiques de niveau recherche, publiés ou non,
émanant des établissements d’enseignement et de
recherche français ou étrangers, des laboratoires
publics ou privés.
Social dynamics in conferences: analyses of data from
the Live Social Semantics application
Alain Barrat, Ciro Cattuto, Martin Szomszor, Wouter van den Broeck, Harith
Alani
To cite this version:
Alain Barrat, Ciro Cattuto, Martin Szomszor, Wouter van den Broeck, Harith Alani. Social dynamics
in conferences: analyses of data from the Live Social Semantics application. The 9th International
Semantic Web Conference, Nov 2010, Shanghai, China. pp.1. �hal-00525936�
Social dynamics in conferences: analyses of data from
the Live Social Semantics application
Alain Barrat,1,2Ciro Cattuto,2Martin Szomszor,3Wouter Van den Broeck,2 Harith Alani4
1
Centre de Physique Th´eorique (CNRS UMR 6207), Marseille, France [email protected]
2
Complex Networks and Systems Group
Institute for Scientific Interchange (ISI) Foundation, Turin, Italy [email protected], [email protected]
3
City eHealth Research Centre, City University, UK 4
Knowledge Media institute, Open University, UK [email protected]
Abstract. Popularity and spread of online social networking in recent years has given a great momentum to the study of dynamics and patterns of social inter-actions. However, these studies have often been confined to the online world, neglecting its interdependencies with the offline world. This is mainly due to the lack of real data that spans across this divide. The Live Social Semantics appli-cation is a novel platform that dissolves this divide, by collecting and integrat-ing data about people from (a) their online social networks and taggintegrat-ing activities from popular social networking sites, (b) their publications and co-authorship net-works from semantic repositories, and (c) their real-world face-to-face contacts with other attendees collected via a network of wearable active sensors. This pa-per investigates the data collected by this application during its deployment at three major conferences, where it was used by more than 400 people. Our analy-ses show the robustness of the patterns of contacts at various conferences, and the influence of various personal properties (e.g. seniority, conference attendance) on social networking patterns.
1
Introduction
Participation in online social networking has been growing at an unprecedented speed, with sites such as Facebook logging more than 400 million active users in only a few years since its birth. This new online phenomena is arming today’s researchers in many disciplines with very rich and rapidly evolving social environment which is proving invaluable for the study and analyses of social dynamics, collective behaviour, commu-nity formation, etc.
Nevertheless, in spite of the surge in investigations of online social networks, these studies have largely overlooked the association of these networks with each other, and with the offline, real-world networks. Social networks, in all their shapes and forms, often reflect each other in a variety of ways. The lack of comparative analyses of such heterogenous networks is mainly due to the shortage of data that spans this online-offline divide. Additionally, to better inform the analyses of real-world face-to-face
(F2F) contact networks, researchers need to take into account the already-existing so-cial relationships between users. Existing relationships can have a high impact on the shape, dynamics, and strengths of interaction between the subjects. Such multi-relation analyses (called multiplexity in social networks [6, 2]) remains underinvestigated [12, 13].
We have designed, developed, and deployed an application that bridges the divides between offline and online, and between real-time and historical social networks and relationships. This is achieved by integrating various heterogeneous and distributed networks. More specifically, Live Social Semantics (LSS) collects and integrates data about people from (a) their online social networks and tagging activities from popular social networking sites such as Facebook, Twitter, Flickr, and Last.fm (b) their publi-cations and co-authorship networks from semantic repositories of publipubli-cations, such as data.semanticweb.organd rkbexplorer.org, and (c) their real-world face-to-face (F2F) proximity, considered as a proxy for a social interaction, recorded with a network of wearable sensors (sociopatterns.org). To the best of our knowl-edge, this is the first time that an application is deployed that is capable of gathering and integrating this type of data.
1.1 Main contribution
The main contribution of this paper is the investigation of the data collected by the LSS application during its deployment at three major conferences (section 4), where it was used by more than 400 people. We analyse the data for contacts patterns and the impact of parameters such as seniority and role on these patterns. We also compare the networks from online social networking sites with those generated from real F2F contacts, as well as with co-authorship networks. More specifically, we investigate the following:
– Face-to-face interactions in scientific conferences (section 5.1): We start our analyses by looking for common statistical characteristics in the F2F interaction networks we collected from three scientific conferences. We focus our attention to F2F contacts frequency and duration and how they compare across all three confer-ences.
– Networking behaviour of frequent users (sections 5.2). Here we focus our ana-ysis on users who participated in two LSS deployments (section 4). We measure the networking behaviour of these users quantitatively and qualitatively, and across conferences, in comparison to the behavior of other one-time users of LSS. – Scientific seniority of users (section 5.3). This analysis aims to study the impact
of seniority on social activity. Seniority is approximated from (a) number or publi-cations, (b) h-index, and (c) organisational roles at the conference where LSS was deployed. In this analysis we search for correlations between seniority of users and the seniority of their F2F contacts, as well as the general strength of their social net-work. We also compare scientific seniority of users to the number of their Twitter followers.
– Comparison of F2F contact network with Twitter and Facebook (section 5.4): We compare the size of F2F network of users to the size of their Facebook and/or
Twitter social network. The idea is to see if there is a clear correlation between the two parameters; i.e whether people with strong online social presence are also very active in F2F networking and vice versa.
– Social networking with online and offline friends (section 5.5): We analyse F2F contact networks while taking into account any co-authorship relationships be-tween users, which we obtain from data.semanticweb.org, and any online social relationship, taken from Facebook or Twitter.
The purpose of our analyses is to provide novel insights into the comparability of on-line and offon-line networks, and to better understand the impact of specific drivers and parameters on the social contact behaviour of individuals and groups in scientific com-munities and gatherings. Such knowledge can feed into the design of better tools for supporting networking at conferences and at similar events. It can also be used for the identification of future scientific leaders and event organisers.
In the following section we describe some work related to monitoring live social interactions and to online network analysis. In section 3 we briefly describe the appli-cation and its main components, and then summarise the outcome of its deployments so far in section 4. Section 5 details the analyses we applied to our data collection and the main results obtained. Discussion and future work related to LSS and to our results is given in section 6, followed by conclusions in section 7.
2
Related Work
Using sensor devices for detecting contacts at conferences is not a novel idea by itself. IBM used RFIDs to track sessions and meal attendance at a conference [17]. Bluetooth-enabled mobiles were also used to track networking of conference attendees [10] and for sensing organisational aspects [8]. Networks from blutoothed mobiles were also studied for characterising some statistical properties of human mobility and contact [14]. Wu and colleagues used what they call “sociometric badges” to investigate impact of F2F interactions on productivity [18]. These badges used radio frequency to detect physical proximity, infra red to detect F2F body alignments, and voice sensors to detect conver-sations. All these works focus on only one type of network which is based on proximity of users, irrespective of whether these users interacted with each other (e.g. had a F2F contact) or were already closely linked in other social contexts.
Recently, the SocioPatterns project (http://sociopatterns.org) developed an RFID platform that is scalable and attains reliable detection of F2F interactions [4, 5]. They used this platform to investigate patterns of human contacts at various so-cial gatherings [11]. The LSS application presented here leverage that platform to mine real-time social contacts. To the best of our knowledge, the Live Social Semantics ap-plication is the first where real-world F2F contacts are mashed up in real time with semantic data from on-line social networking systems.
Social scientists identify several parameters that influence and motivate social and communication networks, such as physical and digital proximity, social support and community belonging, and homophily; similarity of individuals [?]. Such parameters were the focus of many works on characterising social networks (e.g. [?,?,?]). However, such works are often limited to online social networks.
The novelty of the analyses we present in this paper resides in the integration of heterogeneous data sources for the analysis of social networks.
3
Live Social Semantics application
The Live Social Semantics (LSS) [3, 16] is an innovative application that tracks and supports social networking between conference attendees. The application integrates data and technologies from the Semantic Web, online social networks, and a F2F contact sensing platform. It helps researchers to find like-minded and influential researchers, to identify and meet people in their community of practice, and to capture and later retrace their real-world networking activities at conferences.
LSS integrates (a) the available wealth of linked semantic data, (b) the rich social data from existing major social networking systems, and (c) a physical-presence aware-ness infrastructure based on active radio-frequency identification (RFID).
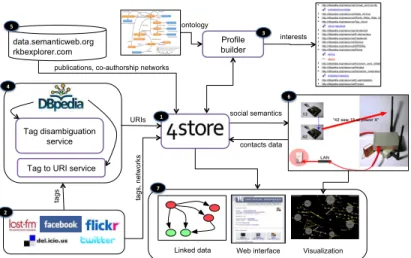
Figure 1 shows the main components of LSS. At the center of this architecture is a 4Store5 triplestore for storing, integrating, and accessing the heterogenous data
col-lected by LSS from various distributed resources. LSS gathers tagging and social net-working information on registered users from selected sites (component 2 in Figure 1). This tagging data is then used by component 3 for building semantic user profiles, which applies a series of services (component 4) for filtering tags [15], disambiguating tags [9], and associating them with semantics from DBpedia [16].
In [16], we focused on describing and evaluating the generation of semantic profiles of interest from the tags shared by LSS users on Delicious and Flickr. The evaluation demonstrated the relative high accuracy of 85% achieved by our fully automatic tag-to-URI association algorithm which maps every tag to a DBpedia tag-to-URI.
Information on user’s publications and co-authorship networks are collected from data.semanticweb.organd rkbexplorer.com. Co-authorship networks rep-resent another type of social networking that LSS integrates with the networks it collects from online social networking sites and from F2F contact networks.
Real-world F2F interactions of conference attendees are mined using RFID hard-ware and softhard-ware infrastructure developed by the SocioPatterns project [4, 5]. The RFID platform is represented by component 5 in the architecture, and it is responsi-ble for collecting and processing readings from active weararesponsi-ble RFIDs carried by the conference attendees who participated in using the LSS application. This information is periodically uploaded to the triple store via RDF/HTTP and integrated with the other data layers. Details of using RFID in LSS can be found in [7].
4
Data from LSS deployments
Live Social Semantics was deployed at three conferences. Below are some statistics on participation in each of these deployments.
triple store Profile builder
Tag disambiguation service
Tag to URI service
ontology ta g s, n e tw o rks interests Linked Data Web interface
Linked data Visualization URIs ta g s social semantics contacts data data.semanticweb.org rkbexplorer.com
publications, co-authorship networks
3 4 2 1 7 6 5
Fig. 1. General architecture of LSS application. A triple store is the central point of integration for all LSS components.
– ESWC 2009: The first deployment of LSS was at the European Semantic Web Conference (ESWC) in Crete, 1-4 June 2009. This conference was attended by 305 people, out of which 187 participated in LSS. Out of the 187 who collected an RFID badge, 139 of them also created accounts on our LSS application website. LSS participants in this conference were allowed to declare their Facebook, Delicious, Flickr, and LastFm accounts. Results of this deployment are fully described in [3]. – HT 2009: HyperText (HT), Turin, June 29-July 1, 2009: Attended by around 150 people. 113 of them collected an RFID, and 97 registered with LSS. Full description of these results can be found in [16].
– ESWC 2010: Extended Semantic Web Conference (ESWC) in Crete, May 31-June 3, 2010. There were around 315 attendees at this conference. 175 people collected an RFID, and 132 of them registered on the LSS site.
5
Data Analyses and Results
Understanding the correlations between the characteristics of users who are linked in a social network is a long-standing problem in social sciences, ecology and epidemi-ology: a typical pattern, referred to as “assortative mixing”, describes the tendency of nodes of a network (here, the users), to link to other nodes with similar properties.
In this section we describe a variety of analyses that we applied to the data we gathered from LSS deployments. In this analyses we take several parameters into ac-count, such as degree and strength of F2F networks, size of online social networks, co-authorship relations, conference chairing roles, and scientific seniority of users. These analyses are aimed at identifying patterns, or testing and verifying various conceptions, on how people connect socially at conferences.
We start by showing the high similarity of the social networks we obtained from all three deployments. Therefore, to save space, we sometimes only report the results of
applying our analysis to data from ESWC2010. However, the results for the other two conferences are quite similar.
5.1 Face-to-face interactions in scientific conferences
The aim of this analysis is to determine the statistical characteristics of F2F networks, and assess their uniformity across multiple conferences.
The Sociopatterns platform [5] used by LSS enables the detection of F2F proximity of attendees wearing the RFID badges. The LSS architecture registers the contact events taking place within the range of our RFID readers, and stores this data in RDF in the LSS triplestore. The data is also stored as a network, allowing to build the aggregated contact network of the conference as follows: nodes represent individuals, and an edge is drawn between two nodes if at least one contact event took place between the corre-sponding attendees. Each edge is weighted by the number of contact events or the total duration spent in face to face proximity. For each node, the degree of a node (number of neighbours on the network) gives the number of different attendees with whom the user has been in contact, and the “strength” (sum of the weights of the links) is defined by the total time this person spent in F2F interaction with other attendees.
Tables 1 and 2 give the main characteristics of the observed behavior of the par-ticipants in the three LSS deployments. The data show a very high level of uniformity across the three conferences,
Contact characteristics ESWC 2009 HT 2009 ESWC 2010
Number of contact events 16258 9875 14671
Average contact length (s) 46 42 42
Fraction of contacts ≤ 1 mn 0.87 0.89 0.88
Fraction of contacts ≤ 2 mn 0.94 0.96 0.95
Fraction of contacts ≤ 5 mn 0.99 0.99 0.99
Fraction of contacts ≤ 10 mn 0.998 0.998 0.998
Table 1. Some characteristics of the contact events between LSS participants during three con-ferences. The F2F contact pattern is very similar for all three concon-ferences.
Network characteristics ESWC 2009 HT 2009 ESWC 2010
Number of users 175 113 158
Average degree 54 39 55
Average strength (s) 8590 7374 7807
Average edge weight (s) 159 189 141
Fraction of weights ≤ 1 mn 0.7 0.67 0.74
Fraction of weights ≤ 5 mn 0.9 0.89 0.93
Fraction of weights ≤ 10 mn 0.95 0.94 0.96
Table 2. Some characteristics of the aggregated network of contacts between participants. The degree of a user is the number of other users with whom s/he has had at least one contact. The weight of an edge between two users is given by the total time they have spent in F2F interaction.
More in detail, Table 1 shows that most contacts are very short, but that some very long contacts are also measured. In fact, the distributions of contact durations are broad,
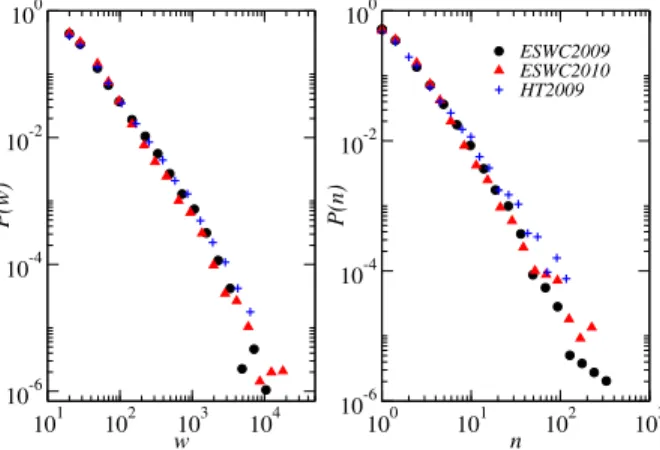
as also observed in other settings [5, 11]. Figure 2 shows that the distributions of total time spent in F2F interaction by two attendees, and of the number of contact events between two attendees, are also broad, and are very similar in all three conferences.
101 102 103 104 w 10-6 10-4 10-2 100 P(w) ESWC2009 ESWC2010 HT2009 100 101 102 103 n 10-6 10-4 10-2 100 P(n)
Fig. 2. Probability distribution of (left) the total time spent in F2F interaction, and (right) the number of contact events, between two participants to the LSS deployments. The X-axis is the total time (left) and the number (right) of contact events, and the Y-axis gives the probability to observe such a value.
Interestingly, the observed general behaviours across conferences are remark-ably similar, both qualitatively and quantitatively, from the point of view of the contact durations and for what regards cumulated contacts between participants: The average contact durations and total time spent F2F by two individuals are very close,6 and in
fact, the whole statistical distributions can be superimposed, as shown in Figure 2.
5.2 Face-to-face networking behaviour of frequent attendees
The successive deployment of the LSS architecture at ESWC in 2009 and 2010 enables not only the comparison of the overall attendees behavior, as shown in the previous paragraphs, but also to focus on the persons who attended both deployments. These common participants turn out to be33. It is thus interesting to investigate their charac-teristics, in order to understand if these participants are in some aspects different from the others.
Table 3 compares the main characteristics of the contacts between returning par-ticipants with the overall average characteristics. It highlights how the attendees who participated in LSS in both ESWC 2009 and ESWC 2010 conferences were much more active, in terms of F2F interactions, than those who used LSS only once.
We observe that the average number of distinct participants with whom returning attendees have interacted is larger. The total time spent in F2F proximity with other
6
Note that since the distributions are broad, the precise value of the averages is rather sensitive to rare events in the distribution tail.
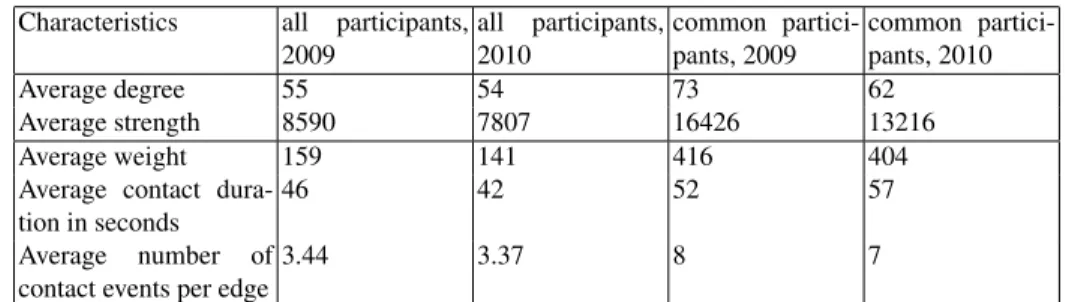
Characteristics all participants, 2009 all participants, 2010 common partici-pants, 2009 common partici-pants, 2010 Average degree 55 54 73 62 Average strength 8590 7807 16426 13216 Average weight 159 141 416 404
Average contact dura-tion in seconds
46 42 52 57
Average number of
contact events per edge
3.44 3.37 8 7
Table 3. Average characteristics in each year of the participants to both ESWC 2009 and ESWC 2010, and of the contact patterns between these returning participants, as compared to the average over all participants.
attendees (strength) is close to twice the interaction time averaged over all participants. This feature can be investigated in more details by measuring the average weight of a link between a returning attendee and any of his/her neighbours, or also between two returning attendees. We find that returning attendees have a larger average inter-action time (212 seconds, against a global average of 141 seconds) and interact more frequently with their neighbours (4.3 contact event per edge, against 3.44 overall).
When focusing the analyses to only those interactions that took place between the returning attendees, Table 3 shows an even stronger effect, with an average total du-ration of interaction (link weight) of about400 seconds. Interestingly, this strong dif-ference in total interaction time comes mostly from a much larger number of contact events, while the average duration of a single contact event is only slightly larger for re-turning attendees. Overall, rere-turning attendees interact more frequently and longer than average, especially among each other.
Stability of F2F interactions across conferences In section 5.1 we showed that the general statistical patterns of F2F networking are very similar across all three confer-ences where LSS was deployed. Then in section 5.2 we showed that frequent users have stronger F2F networks. Another interesting question is whether these common users show similar social-networking behaviour from one year to the next.
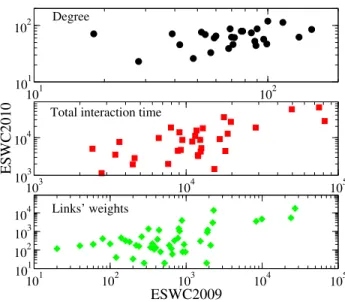
To this end, we study the correlation between the properties of individuals and of their links in the interaction network in 2009 and 2010. More precisely, we plot in Fig-ure 3 for each individual the number of neighbours in 2010 versus the number of neigh-bours in 2009 (top). We also plot the total time spent in F2F interaction in 2010, versus the same quantity measured at ESWC2009 (middle plot). For the links observed in both 2009 and 2010, we also plot the weight in 2010 versus the weight in 2009 (bottom plot). The plots show a clear correlation pattern. More quantitatively, the Pearson correlation coefficients7 are0.37 for the degrees, 0.76 for the total time spent in interaction, and
0.75 for the link weights. What this implies is that although people interacted with a different set of people during these two conferences, the time they spent in these interactions was very similar.
7
The Pearson correlation coefficient between two variables is defined as the covariance of the two variables divided by the product of their standard deviations. It measures the correlation (linear dependence) between these two variables, and is comprised between −1 when the variables are perfectly anti-correlated and +1 when they are perfectly correlated.
101 102 101 102 103 104 105 103 104 ESWC2010 101 102 103 104 105 ESWC2009 101 102 103 104 Degree
Total interaction time
Links’ weights
Fig. 3. Correlation between the characteristics of a returning attendee in 2009 and 2010. The X-axis gives the value of the charateristics of an attendee measured in 2009, and the Y-axis gives the value of the same characteristics measured in 2010. Black circles: degree, giving the number of other participants with whom an attendee has interacted. Red squares: total time spent in interaction by an attendee. Green diamonds: total time spent in F2F interaction by a pair of returning attendees in 2010, versus the same quantity measured in 2009.
Since people’s social behaviour seems to remain rather stable from one conference to the next, we can assume that they will show homogenous behaviour at other similar conferences, and that the typical changes in conference programs and events have little impact on the behaviour of attendees.
5.3 Scientific seniority and F2F network patterns
One interesting parameter to investigate in conference F2F networks is the scientific seniority of people. This section investigates this parameter and its influence on F2F networking dynamics.
We consider two different ways to quantify the scientific seniorityseu of a user
u: (i) the number of papers authored by an individual at semantic web related confer-ences,8 and (ii) the h-index.9While the publication and citation patterns change from
one community to the next, we are here dealing with scientists coming from the same community, so that these quantities are reasonable indicators of how senior a person is. To quantitatively answer the question of whether people tend to only mix with their peers or not, we compute for each useru in the aggregated contact graph the average
8Number of papers is obtained from data.semanticweb.org and is therefore limited to
the conferences metadata available in this repository. However, these numbers give a good approximation of seniority for the attendees of the conferences in question.
seniority of nearest neighbours seunn= 1 ku X v∈V(u) sev (1)
where the sum is over thekuusers with whomu has been in contact at the conference.
We also compute the average seniority of the neighbours of users with seniorityse
senn(se) = 1
|u/seu= se|
X
u/seu=se
seunn. (2)
The study of the F2F interaction patterns has however shown that not all contacts are equivalent. On the contrary, the amount of time spent by two users in F2F proximity is strongly heterogeneous (see Fig. 2). Since Eq. (1) performs an unweighted average of the seniority of all neighbours, we generalize it to take into account the contact diversity:
seunn,w= 1 su X v∈V(u) wuvsev (3)
wherewuvis the total time spent in F2F proximity byu and v, and su =Pt∈V(u)wut
is the total time spent byu in F2F proximity with other users. We also consider for each useru the strongest link, and define seu
nn,maxas the seniority of the userv with whom
the corresponding contacts took place.
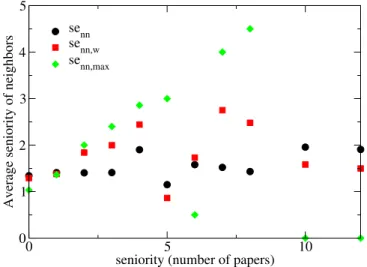
Figure 4 displays the average seniority of the neighbours of users with seniorityse, Eq. (2), as a function of the seniorityse, measured as the number of papers authored by an individual. No clear pattern is observed if the unweighted average over all neighbours in the aggregated network, Eq. (1), is considered. The picture is different when the time spent in F2F interaction is considered in order to compute an average in which each neighbour is weighted by the time spent with him/her, as in Eq. (3). An assortative trend is then observed, which is even stronger if considering for each individual only the neighbour with whom the most time has been spent. Such procedures allow to filter out short encounters which are then given small importance, or completely ignored.
Our analyses unveils a clear assortative mixing behavior, in which people tend to mix with others with similar seniority levels. In other words, more senior individu-als tend to spend more time with other senior individuindividu-als, and junior people are more likely to mix with their peers. Similar results are obtained when the h-index is consid-ered as a measure of seniority. It is important to note that relying only on unweighted contacts, i.e., the only knowledge of who has met whom, would not have allowed to reveal this assortative mixing, and that information on the temporal aspects is crucial in this respect.
Conference chairing and F2F networks Another indicator of seniority is whether a person has taken a chairing role at the conference or not. Conference chairing and organ-isational roles were retrieved for all LSS users at ESWC2010 from data.semanticweb. organd used in this analysis.
0 5 10 seniority (number of papers) 0 1 2 3 4 5
Average seniority of neighbors
senn senn,w
senn,max
Fig. 4. Average seniority of the neighbours of a user, versus the user’s own seniority. Black circles correspond to an unweighted average over all neighbours, Eqs. (1) and (2). Red squares show the weighted average Eq. (3), and green diamonds show the seniority of the neighbour with whom the strongest link is observed.
Characteristics all participants, 2009 chairs 2009 all participants, 2010 chairs, 2010
average degree 55 77.7 54 77.6
average strength 8590 19590 7807 22520
average weight 159 500 141 674
average number of events 3.44 8 3.37 12
per edge
Table 4. Some characteristics of the ESWC 2010 chairs, and of the links between chairs, com-pared with the overall averages.
Table 4 explores this particular aspect of the relationship between “seniority” and social activity at the conference. Track chairs are indeed typically more senior. We ob-serve that the chairs interact with more distinct people (larger average degree), and spend more time in F2F interaction (almost three times as much as a random par-ticipant). Moreover, the contact events between chairs tend to be longer, and edges between chairs in the aggregated network correspond to many contact events. The den-sity of the subnetwork of chairs is also very large (80% of all possible encounters are observed, against35% for the possible encounters between all participants).
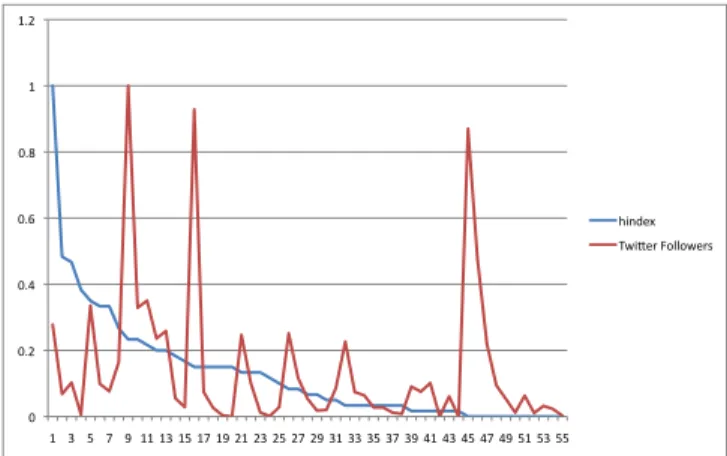
Scientific seniority and twitter followers A comparison between seniority and the number of followers on Twitter (i.e. number of Twitter users who follow the person in question) is given in Figure 5 for ESWC2010. It is interesting to see that of all LSS users, the most senior scientists are not the mostly followed on Twitter. Also, a number of less senior people in terms of h-index were followed by many Twitter users. It is worth noting that the first two peaks on the Twitter line in the figure belong
to researchers with high visibility and who have taken on chairing responsibilities in other conferences conference events (sessions, tracks, workshops, etc.). The third peak belong to a developer in a semantic web company and not to a researcher (hence the zero h-index). In future work we will consider other parameters, such as user’s Twitter activity levels and time since Twitter account was created.
0 0.2 0.4 0.6 0.8 1 1.2 1 3 5 7 9 11 13 15 17 19 21 23 25 27 29 31 33 35 37 39 41 43 45 47 49 51 53 55 hindex Twi5er Followers
Fig. 5. Comparison between people’s scientific seniority and the number of people following them on Twitter. Y-axis is the h-index normalized by the maximum h-index among participants, or the number of Twitter followers, as well normalized by the maximum number of followers observed, and X-axis is the 55 people who gave LSS their Twitter accounts during ESWC2010, ranked in decreasing order of h-index.
What these results show is that the number of Twitter followers is not necessarily a good indication of pure seniority in the context of scientific communities, but rather it is a reflection of popularity of individuals and of the work they do (more in section 6).
5.4 Face-to-face interactions and size of online social networks
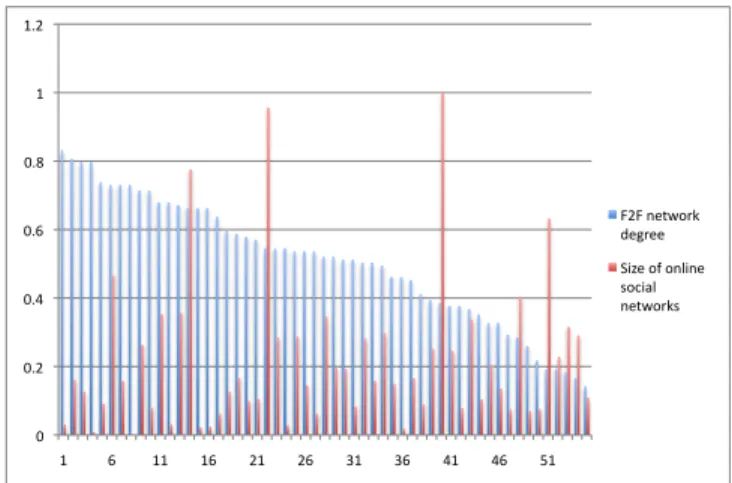
Figure 6 shows the average amount of F2F networking of participants during ESWC 2010, alongside the size of their online social networks from Facebook and/or Twitter (followers and followees). The figure does not show any strong correlation between these two parameters. In other words, people who were active in F2F contacts do not necessarily have the largest online social networks, and vice versa. Note that these online networks include people who were not present at the conference, or who were present but did not participate in LSS. These online networks also include people from outside the research community (e.g. family, friends, or even spam). The figure also shows a large discrepancy for some of those with low degree of F2F contacts. In a closer look at the data, we found that these readings belong to people who were not researchers in the semantic web field, but were nevertheless present at the conference. It is therefore reasonable to expect these people not to know many of the attendees, which limited their social interactions at the conference.
0 0.2 0.4 0.6 0.8 1 1.2 1 6 11 16 21 26 31 36 41 46 51 F2F network degree Size of online social networks
Fig. 6. X-axis shows the LSS users who declared their Facebook and/or Twitter accounts during ESWC2010 deployment. The Y-axis shows the total size of their online social networks, normal-ized by the maximal size observed, and the degree in the F2F interaction network of ESWC2010, divided by the maximum degree. There is no strong correlation between the amount of F2F con-tact activity and the size of online social networks. In other words, it appears that people who have a large number of friends on Twitter and/or Facebook are not necessarily the most socially active in the offline world.
5.5 Social networking with online and offline “friends”
A social relationship between two individuals can be defined from different points of view. They can be friends, colleagues, co-workers, and the relationship can exist in real life and/or in online social networking sites. The concept of multiplexity refers to the extent to which multiple ties coexist between the same persons. The LSS platform offers an interesting way to crosslink data concerning on the one hand real life interactions taking place on short times and on the other hand professional or online social links. We focus here on the ESWC 2010 deployment, although the other deployments give very similar results.
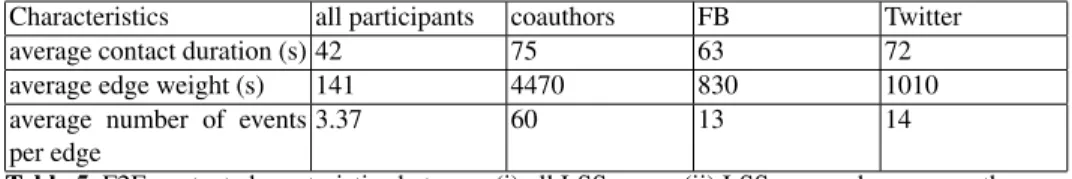
Among the participants to the ESWC 2010 deployment,26 links of co-authorship are found, together with194 links of Facebook friendship, and 112 pairs in which at least one individual follows the other on Twitter. Table 5 gives the average contact char-acteristics for pairs of LSS users who share a social relationship either at a professional level or online. The average duration of a contact is much larger than for a random pair of attendees, but remains of the same order of magnitude.
The total time spent in F2F interaction is instead much larger, due to the fact that individuals sharing an online or professional social link meet much more often than other individuals. Moreover, while the two different online social networks give very similar results, the average number of encounters -and total time spent in interaction- is highest for co-authors.
Characteristics all participants coauthors FB Twitter
average contact duration (s) 42 75 63 72
average edge weight (s) 141 4470 830 1010
average number of events per edge
3.37 60 13 14
Table 5. F2F contact characteristics between (i) all LSS users, (ii) LSS users who are coauthors, (iii) LSS users who are friends on Facebook, and (iv) pairs of users who are linked on Twitter.
6
Discussion and Future Work
The analyses we report in this paper is based on data from three conferences. When we closely compared the list of users of HT2009 with those of ESWC2009 and ESWC2010, it was clear that there was negligible overlap between these users lists. For this reason, some of our analyses that required common users was limited to ESWC data only. However, in our analyses we showed that behaviour in F2F networking of groups and of individuals is very similarly from one conference to the other (sections 5.1 and 5.2). Our data is naturally sparse, since not all conference attendees participated in LSS, and not all users of one LSS deployment attended, or participated in other LSS de-ployments. Also, for some deployments, many F2F contacts were taking place outside the perimeters of our RFID readers (e.g. at the bar, during meals), and therefore could not be logged by LSS. However, we believe that the patterns we identified were strong enough in spite of this data sparsity. To overcome this problem, SocioPatterns.org is currently developing RFID with on-board memory, thus enabling F2F contacts to be logged regardless of distance to RFID readers.
As we report in this paper, there are often many parameters and types of relation-ships that influence social networks and their analyses. In this paper we focused our analyses on a number of such parameters, and our results are based on the network data we gathered from LSS deployments. Such data however, might contain some bias, caused by that data’s inherited limitation to only those users who registered to use LSS, and to only those conferences where LSS was deployed. Other parameters can be taken into account in future deployments and analyses, such as users’ affiliations, and project membership (e.g. from rkbexplorer.org). Deploying LSS at non-computer sci-ence confersci-ences will also help to widen the scope of our analyses.
Chronology of social relationships could be taken into account when analyzing so-cial networks, to investigate the influence of existing relationships between users on the dynamics of their networks. Some temporal relationships can be obtained from further LSS deployments over longer periods of time, where F2F, and online social networks can be monitored more frequently, and compared with each other over time.
Additionally, we currently do not consider when an online social networking ac-count was set up, or whether the owner is an active user of these acac-counts or not. Such information can strengthen the analyses of these networks. We are currently building models and tools for generating rich user profiles that can acquire and represent user’s activities in various social networking systems. Such profiles can then be analysed to identify usage and social behaviour, influence, trends, and interests.
With respect to estimating scientific seniority of LSS users, we relied on the number of their papers, their h-index, and their chairing roles at the conferences where LSS was deployed (section 5.3). Other features could be taken into account, such as their chairing roles in other previous conferences, or their overall number of publications. However, based on our knowledge of who’s who in the semantic web community, we find that the seniority results from our approaches were very realistic approximations.
Linked Data resources such as data.semanticweb.org and rkbexplorer. orgproved invaluable for this work. We used these resources for obtaining information on publications, co-authorships, chairing roles at various conferences, etc. Such initia-tives should be supported and extended further, emphasizing quality as well as quantity of the data they store.
Work on LSS so far has concentrated on building the platform and website. Fu-ture work will instead focus on providing users with added-value services that use the collected data and analyses results to, for example, recommend new contacts to add to online social networks, to meet or collaborate with certain users F2F, attend specific talks, etc.
7
Conclusions
Data from LSS gave us the opportunity to analyse and compare various types of online as well as offline social networks for conference attendees, and to better understand their characteristics, dynamics, and dependencies. Below we summarize the main finding from our analyses:
– Statistical properties of the F2F social contact patterns were very similar across all three conferences. (section 5.1).
– Frequent conference attendees (i.e. used LSS in more than one conference) were more socially active in F2F networking than others, with %22 more F2F interac-tions and %50 more interaction time than other users (section 5.2).
– Time spent on F2F networking by frequent conference attendees remained stable, even though the list of people they networked with change (section 5.2).
– Conference attendees tend to networks with others of similar levels of scientific seniority. We also show that conference chairs meet more people and spend 3 times as much time in F2F networking than other users (section 5.3).
– People who have the highest number of Twitter follower are not necessarily the most senior in terms of their h-index, although they have high visibility, popularity, and experience (section 5.3).
– No visible correlation is found between size of online social networks of users in Facebook and Twitter and the number of people they met face to face (section 5.4). – People’s F2F contacts with their Facebook friends and Twitter mutual followers were respectively %50 and %71 longer, and %286 and %315 more frequent than with others. They have also spent %79 more time in F2F contacts with the people they co-authored papers with, and they met them %1680 more times than they met non co-authors (section 5.5).
References
1. http://www.sociopatterns.org.
2. W. A and F. K. Social Network Analysis: Methods and applications. Cambridge University Press, Cambridge, 1994.
3. H. Alani, M. Szomszor, C. Cattuto, W. V. den Broeck, G. Correndo, and A. Barrat. Live social semantics. In 8th International Semantic Web Conference (ISWC), near Washington, DC, USA, 2009.
4. A. Barrat, C. Cattuto, V. Colizza, J.-F. Pinton, W. V. den Broeck, and A. Vespig-nani. High resolution dynamical mapping of social interactions with active rfid, 2008. http://arxiv.org/abs/0811.4170.
5. C. Cattuto, W. V. den Broeck, A. Barrat, V. Colizza, J.-F. Pinton, and A. Vespignani. Dy-namics of person-to-person interactions from distributed rfid sensor networks. PLoS ONE, 2010.
6. F. CS. To dwell among friends. University Chicago Press, 1982.
7. W. V. den Broeck, C. Cattuto, A. Barrat, M. Szomszor, G. Correndo, and H. Alani. The live social semantics application: a platform for integrating face-to-face proximity with on-line social networking. In Workshop on Communication, Collaboration and Social Networking in
Pervasive Computing Environments (PerCol 2010), IEEE Int. Conf. on Pervasive Computing and Communications (PerCom), Mannheim, Germany, 2010.
8. N. Eagle and A. (Sandy) Pentland. Reality mining: sensing complex social systems. Personal
Ubiquitous Comput., 10(4):255–268, 2006.
9. A. Garca-Silva, M. Szomszor, H. Alani, and O. Corcho. Preliminary results in tag dis-ambiguation using dbpedia. In Knowledge Capture (K-Cap’09) - Workshop on Collective
Knowledge Capturing and Representation - CKCaR’09, CA, USA, 2009.
10. P. Hui, A. Chaintreau, J. Scott, R. Gass, J. Crowcroft, and C. Diot. Pocket switched net-works and human mobility in conference environments. In WDTN ’05: Proc. 2005 ACM
SIGCOMM workshop on Delay-tolerant networking, New York, NY, USA, 2005. ACM. 11. L. Isella, J. Stehl´e, A. Barrat, C. Cattuto, J.-F. Pinton, and W. V. den Broeck. What’s in a
crowd? analysis of face-to-face behavioral networks. arXiv:1006.1260, 2010.
12. M. M, S.-L. L, and C. JM. Birds of a feather: Homophily in social networks. Annual Review
of Sociology, 27:415–444, 2001.
13. S. M, L. R, and T. S. Trade, conflict and sentiments: multi-relational organization of large-scale social networks, 2010. arXiv:1003.5137.
14. A. Scherrer, P. Borgnat, E. Fleury, J.-L. Guillaume, and C. Robardet. Description and simu-lation of dynamic mobility networks. Comput. Netw., 52(15):2842–2858, 2008.
15. M. Szomszor, I. Cantador, and H. Alani. Correlating user profiles from multiple
folk-sonomies. In Proc. Int. Conf. Hypertext (HT08), Pittsburgh, PA, USA, 2008.
16. M. Szomszor, C. Cattuto, W. V. den Broeck, A. Barrat, and H. Alani. Semantics, sensors, and the social web: The live social semantics experiments. In 7th Extended Semantic Web
Conference (ESWC), Crete, Greece, 2010.
17. P. Thibodeau. IBM uses RFID to track conference attendees, 2007.
http://pcworld.about.com/od/businesscenter/IBM-uses-RFID-to-track-confere.htm. 18. L. Wu, B. Waber, S. Aral, E. Brynjolfsson, and S. Pentland. Mining face-to-face interaction
networks using sociometric badges: Evidence predicting productivity in it configuration. In