-
1/21-Hygrothermal effect on moisture kinetics and mechanical
properties of hemp/polypropylene composite: experimental
and numerical studies.
LOTFI TOUBAL1, JEAN-CHRISTOPHE CUILLIÈRE2, KARIM BENSALEM1,2, VINCENT FRANCOIS2, PAPA -BIRAME GNING3
1Laboratoire de Mécanique et Éco-matériaux (LMEM), Département de Génie Mécanique, Université du Québec à
Trois-Rivières, Trois-Rivières, Québec, Canada
2Équipe de Recherche en Intégration Cao-Calcul (ERICCA), Département de Génie Mécanique, Université du
Québec à Trois-Rivières, Trois-Rivières, Québec, Canada
3 DRIVE-ISAT, Université de Bourgogne, Département de Génie Mécanique, Nevers, France
Corresponding author: Jean-Christophe Cuillière
Université du Québec à Trois-Rivières, Trois-Rivières (Qc) G8Y 3X8, Canada 819-376-5011 #3920
Abstract: The exposition of thermoplastic composites reinforced with natural fibres to moisture and heat is likely to lower their mechanical properties and restrain their use in the design of parts. The present work is focussed on investigating the effects of hygrothermal aging on the mechanical behaviour of injected polypropylene reinforced with short hemp fibres. Moreover, the kinetic of isothermal moisture absorption has been studied for four immersion temperatures. The experimental results show that the time taken to reach saturation decreases significantly with increase in immersion temperature. These tests also reveal that moisture absorption in this type of materials does not follow Fick’s law. Thus, a new model is proposed to predict this behaviour by the use of a variable coefficient of diffusion. This model is implemented using both analytical and finite element analysis (FEA) approaches. The results obtained with this new model show a very good correlation between experimental, analytical and FEA absorption curves.
Keywords: Biocomposites; Moisture; Mechanical Properties; Finite Element Analysis; Non-Fickian
This is the peer reviewed version of the following article: Toubal, L., Cuillière, J.-C., Bensalem, K., Francois, V., & Gning, P.-B. (2016). Hygrothermal effect on moisture kinetics and mechanical properties of hemp/polypropylene composite: Experimental and numerical studies. In Polymer Composit, which has been published in final form at https://doi.org/10.1002/pc.23414. This article may be used for non-commercial purposes in accordance with Wiley Terms and Conditions for Use of Self-Archived Versions.
- 2/21-
1 Introduction
In addition to be recyclable, natural fiber reinforced polymer composites (NFCs) feature interesting mechanical properties and can be successfully used to replace conventional non-degradable materials for many applications. However, the most important obstacle to a wider development and use of NFCs is the fact that their exposure to some environments, especially heat, ultraviolet radiation and moisture, may cause their premature deterioration and make them inadequate to fulfill their function. Heterogeneity of composite materials in general makes the study of their aging and damage processes more complex, especially in the case of injected thermoplastic matrixes reinforced with vegetable fibers. Indeed, the hydrophilic behavior of fiber reinforcements opposes hydrophobicity of the matrix, thereby inducing different absorption mechanisms and behaviors. Moisture absorption leads to fiber degradation, to swelling and plastic deformation of the matrix and to degradation of the fiber-matrix interface. Thus, discontinuities are induced inside the material, which results in its weakening and in the decrease of its mechanical properties [1-7]. Assessing the initial mechanical properties of these composite materials has been done by several authors, which is not the case for assessing the evolution of these properties along moisture absorption. Moreover, the kinetics of moisture diffusion in NFCs itself depends on several parameters i.e. fibers nature (chemical composition, geometry, volume fraction, variability), matrix properties, presence of porosities and quality of fiber/matrix adhesion. Also, the time required for a sample to reach moisture saturation strongly depends on the environment to which it is exposed (moisture percentage or immersion, temperature, water purity, etc.).
Significant research work has been done towards studying and modelling the diffusion of moisture in composite materials. It appears that kinetics of moisture absorption in some of these materials can be modelled using Fick’s equation (1) [2, 4, 8-10].
2 2 2 2 2 2
z
C
D
y
C
D
x
C
D
t
C
z y x
(Eq. 1)In this equation, C(x,y,z,t) represents the transient distribution of moisture concentration across the material andDx, D and y D are diffusion coefficients along x, y and z axes respectively. Considering the z material as homogeneous and isotropic, it can be assumed that Dx Dy Dz D and equation (1)
simplifies to:
2 2 2 2 2 2z
C
y
C
x
C
D
t
C
(Eq. 2)Panthapulakkal and Sain [4], along with other authors [8, 9], have used this model with a constant diffusion coefficient
D
. Similarly, Kushwaha and Kumar [3] found that water diffusion in bamboo-polyester composites is also fickian. However, other materials exhibit different types of non-fickian- 3/21- behaviors as synthesized by Weitsman [11]. Indeed, it is commonly considered that kinetics of diffusion cannot be considered as fickian if the initial trend (i.e. when moisture absorption is less than 60% of saturation) of the absorption curve as a function of the square root of time is not linear [12]. Among non fickian models, Alamri et al. [1] presented two saturation stages. Weitsman [13] proposed a model with a varying diffusion coefficient. In Weitsman’s work, the diffusion coefficient D is a function of time and immersion temperature. A similar approach, considering a time-dependent diffusivity, can be found in [14]. Also, Yeh et al. [15] showed that diffusion in a cyanate ester resin features two stages. Authors have shown that, for this material, the first stage of absorption is fickian followed by a second stage that is characterized by a decreasing diffusion coefficient with time.
In the present work, the influence of hygrothermal aging on the mechanical behavior of injected polypropylene (PP) reinforced with short hemp fibers is studied at different stages of water absorption. Correlations between experimental, analytical and FEA water absorption results are presented for specimens that have been immersed in water at 4 different temperatures.
2 Specimens and testing procedure
2.1 Material
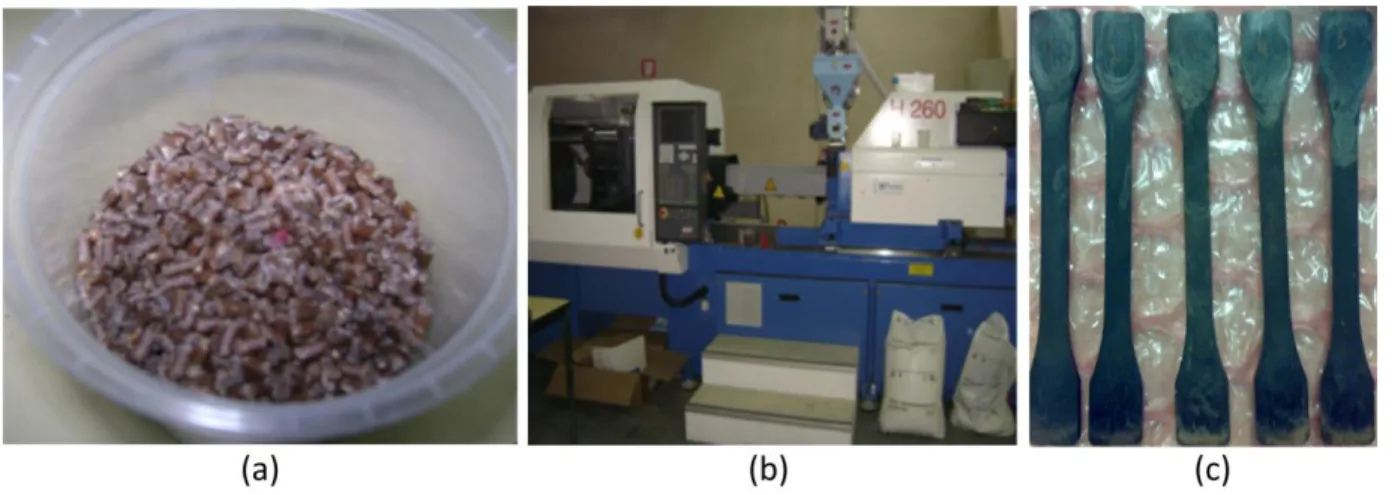
The specimens tested were made of hemp/PP granules with a 30% reinforcement weight fraction, supplied by AFT Plasturgie. (Figure 1a). Compounds were injected at the temperature of 200°C with a thermoplastic injection machine, with a 100 tons capacity in the mold closing force (Figure 1b). Dumbbell shaped tensile specimens were molded in conformity with ISO 294 standard (Figure 1c). Specimen central zone dimensions are 150mm (length), 10mm (width) and 4 mm (thickness). For comparison, specimens made of pure polypropylene were also fabricated in the same conditions and with the same dimensions.
Figure 1: (a) Hemp/polypropylene granules, (b) Electric injection machine, (c) Injected tensile specimens
- 4/21- All quasi-static tests were performed according to the ASTM D 3039 standard, with a crosshead speed of 2 mm/minute on a 4206 Instron machine with a load sensor calibrated in the range of 0 to 10 kN. The strains were measured by a mechanical extensometer and recorded with a frequency of 10 Hz.
2.3 Wettability tests
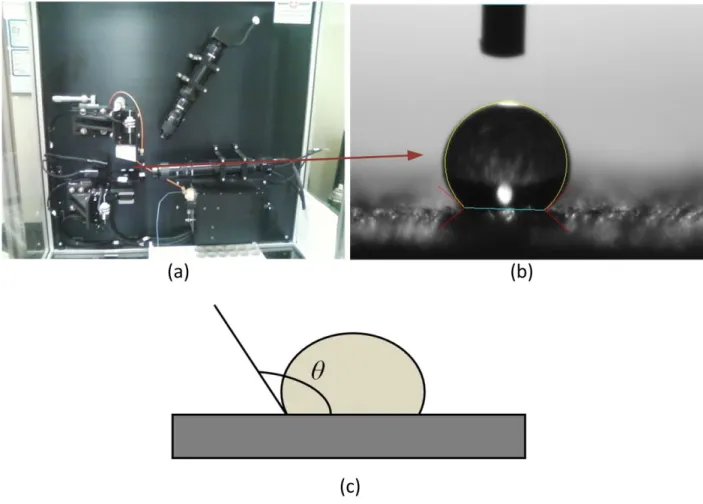
The ability of water to spread on a material is referred to as wettability, which has been source of interest for a long time [16]. Wettability of a surface is associated with the contact angle that results from the equilibrium of a drop resting on it under the action of surface tensions as illustrated in Figure 2.
Figure 2: The contact angle (a) Measuring system (b) Zoom on a drop (c) Definition.
The contact angle θ is defined as the angle between the tangent to the profile of the drop and the surface around the contact circle. Analyzing the nature of the interaction between the liquid and the solid, either for polar and non-polar liquids, allows assessing if the surface of a given material is more or less hydrophilic or hydrophobic [16, 17]. Indeed, for θ between 0° and 180°, it appears that:
If θ = 0°, wettability of the surface is maximum, which means that the liquid wets the solid completely.
If θ < 90°, the liquid partially wets the solid. In this case the liquid mostly wets the solid (mostly wetting).
- 5/21- If 180° > θ >90°, wettability is low and the liquid mostly non-wets the solid (mostly non-wetting). If θ = 180°, wettability of the surface is null (complete non-wetting).
Thus, when the contact angle θ < 90°, the solid surface is considered hydrophilic and when θ >90°, the solid surface is considered hydrophobic.In order to assess the hydrophilic behavior of the studied material, we made contact angle measurements on both raw and polished surfaces of 5 samples.
2.4 Moisture absorption tests
Absorption tests were done in thermostated distilled water baths in accordance with the ASTM D570-98 standard test method. At first, all specimens were oven dried at 75°C to remove any residual moisture that may be present in the material. Drying has been applied until the mass of specimens remained constant. Then the specimens were immersed in baths at 20°C, 40°C, 60°C and 80°C in order to study the water uptake with time. The samples were weighed daily with a mg precision balance. For each temperature, a batch of ten specimens were aged in order to measure the evolution of moisture content as a function of time t . The effects of moisture content on the degradation of the composite mechanical properties have been measured through regular tensile tests on pairs of specimens, from the beginning of moisture absorption until saturation.
3 Experimental results
3.1 Effect of moisture on tensile strength
Figure 3 shows sets of stress-strain plots of specimens previously immersed at 20°C, 40°C, 60°C and 80°C at different stages of along moisture absorption.
- 6/21-
Figure 3: Typical stress-strain curves for different mass gains at (a) 20°C, (a) 40°C, (a) 60°C, (a) 80°C.
For each immersion temperature, the corresponding relative weight gain, in percentage, until saturation is evaluated. The relative weight gain with time M
t is calculated using relation (3), in which m(t) and0
m represent the specimen’s mass along moisture absorption and the specimen’s mass before immersion
respectively. 0 0 ) ( ) ( m m t m t M (Eq. 3)
Of course, M
t globally increases and its highest value is reached at saturation. Once saturation is achieved, M
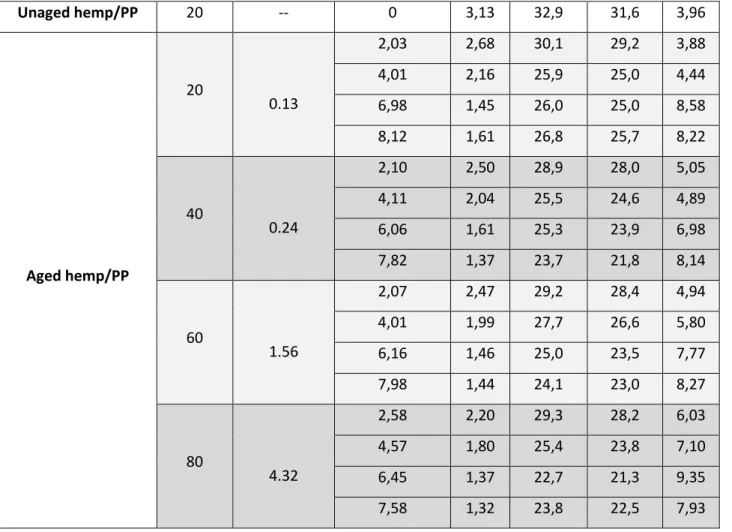
t remains constant (around 8% for all immersion temperatures as shown in Table 1).Specimen type (°C) T Dmean (10-12m2/s) M(t) (%) E (GPa) σmax (MPa) σult (MPa) εult (%) Unaged PP 20 -- 0 0,99 -- -- --
- 7/21- Unaged hemp/PP 20 -- 0 3,13 32,9 31,6 3,96 Aged hemp/PP 20 0.13 2,03 2,68 30,1 29,2 3,88 4,01 2,16 25,9 25,0 4,44 6,98 1,45 26,0 25,0 8,58 8,12 1,61 26,8 25,7 8,22 40 0.24 2,10 2,50 28,9 28,0 5,05 4,11 2,04 25,5 24,6 4,89 6,06 1,61 25,3 23,9 6,98 7,82 1,37 23,7 21,8 8,14 60 1.56 2,07 2,47 29,2 28,4 4,94 4,01 1,99 27,7 26,6 5,80 6,16 1,46 25,0 23,5 7,77 7,98 1,44 24,1 23,0 8,27 80 4.32 2,58 2,20 29,3 28,2 6,03 4,57 1,80 25,4 23,8 7,10 6,45 1,37 22,7 21,3 9,35 7,58 1,32 23,8 22,5 7,93
Table 1. Average mechanical properties of specimens at different moisture absorption levels and temperatures.
Tensile tests on unaged (after oven drying and before immersion) bio-based and pure PP specimens at 23°C after being warmed at 75°C for 48 hours, were also performed as reference to assess the influence of moisture absorption on specimens Young’s modulus E, maximum tensile stress
max, ultimate tensile stress
ult and ultimate strain
ult.The materials mechanical properties measured at each stage of moisture absorption and for each immersion temperature T are listed in Table 1. It is important to note in Table 1 that unaged specimens added with 30% fibers in weight show a Young’s modulus that is over three times higher than Young’s modulus of unaged pure PP ones (3.13 Gpa compared to 0.99 Gpa).
Overall, the evolution of plots in Figure 3 illustrates and quantifies the degradation of mechanical properties as the moisture absorption increases. It also shows that the behavior of specimens converges to that of the pure PP ones. These curves show a decrease of specimens Young’s modulus, maximum stress and ultimate tensile stress along moisture absorption. Conversely, ultimate strain increases with the moisture content, which is not surprising. Absorption of moisture by the material caused by the hydrophily
- 8/21- of vegetal fibers results in the degradation of the hemp/PP interface, which leads to discontinuity in the load transfer. This phenomenon justifies the tendency shown by hemp/PP specimens, as the water uptake increases, towards getting closer to the behavior of pure PP specimens. Furthermore, the curves clearly show that temperature has a significant effect on the decrease of mechanical properties. The higher immersion temperature is, the closer to the behavior of non-reinforced thermoplastic samples is that of bio-based composites.
Interpolated surfaces showing the evolution of
E
,
max,
ult and
ult as functions of bath temperature and moisture absorption are plotted in Figure 4. The test results on unaged hemp/PP specimens are taken as reference (Table 1) and the decrease of mechanical properties (in %) is evaluated with respect to these unaged hemp/PP specimens. Overall, as mentioned above, these surfaces exhibit a relative loss forE
,max
and
ultand a relative increase for
ult.The surfaces are relatively smooth due to a low dependency to immersion temperature. The trends are monotonic until the peak is reached. However, maximum values do not necessarily correspond to the saturation point, especially for
ult. The decrease of Young’s modulusE
reaches 49% and 58% at saturation for specimens that have been aged at 20°C and 80°C, respectively. For
maxand
ult, this decreasing trends are similar since they respectively attain 31% and 33% at saturation. For both tensile strength and tensile modulus, these results very similar to those measured in [4, 6] for a hemp/polypropylene composite with a 40% hemp reinforcement weight fraction (if compared with 30 % in our case). Besides,
ult increases until 136% of the strain of unaged hemp/PP. As shown in Table 1, the ultimate strain
ultfor pure PP specimens could not be measured due to the limited stroke of the testing machine.- 9/21-
Figure 4: Surface graphs of relative a) tensile modulus loss, b) maximum stress loss, c) ultimate stress loss and d) ultimate strain gain as a function of mass uptake and immersion temperature.
3.2 Wettability of the material
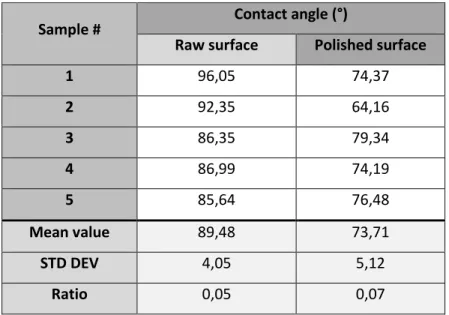
As introduced in section 2.3, hydrophilic behavior of the studied material is assessed through the measurement of the contact angle for 5 raw and polished samples. Wettability results are listed in Table 2 for the 5 samples. It appears that the mean value of the contact angle for raw samples is 89.48° (θ ≈ 90°). This means that raw surfaces of the material show partial wetting. It can be noted that wettability is quite lower for the two first samples. The mean value of the contact angle for polished samples is 73.71° (θ < 90°). Consequently, wettability is higher for polished surfaces and the mean decrease of the contact angle is around 16° if compared with raw samples. This means that, as expected, polishing increases the surface wettability for this material. The surface is more hydrophilic after polishing because more hemp fibers are in contact with the exterior, which makes that the surface is more likely to diffuse liquid to the interior of the material. Overall, these results show that wettability of raw samples is quite low. This suggests that moisture absorption tests should take a long time, especially at room temperature.
- 10/21-
Sample # Contact angle (°)
Raw surface Polished surface
1 96,05 74,37 2 92,35 64,16 3 86,35 79,34 4 86,99 74,19 5 85,64 76,48 Mean value 89,48 73,71 STD DEV 4,05 5,12 Ratio 0,05 0,07
Table.2. Contact angle measurements.
3.3 Moisture absorption
The evolution of moisture absorption as a function of the square root of time (expressed in days) for the immersed specimens at 20°C, 40°C, 60°C and 80°C is presented in Figure 5.
Figure 5: Typical relative moisture uptake as a function of the square root of time for aged samples.
It clearly appears that water diffusion depends on time and on water temperature. The curves slopes are inversely proportional to bath temperatures. The higher the immersion temperature, the steeper the slope is, which means a faster diffusion of water inside the material, which is consistent with results presented in [4]. This can be explained by the outbreak of several types of diffusion with increasing temperature that
- 11/21- accompanies the rapid degradation of fibers and of the fiber-matrix interface [2]. Slopes of these absorption curves clearly highlight a non-linear initial trend of the absorption curve as a function of the square root of time. This trend confirms results that are presented in [6] for hemp/glass fiber hybrid polypropylene composites with different glass fiber content. Thus the behavior associated to moisture absorption in this material is not fickian and it suggests that the actual uptake could be modeled using a variable diffusion coefficient
D
as proposed in [1, 13, 15]. The mean values of diffusion coefficients are presented in Table 1 for the 4 immersion temperatures. These values are between 0.13 10-12 to 4.32 10-12 m2/s, which can be compared with results presented in [4] for a hemp/polypropylene composite with a 40% hemp reinforcement weight fraction (if compared with 30 % in our case). The values measured in [4] are higher, which is consistent with the fact that the reinforcement fraction is higher. The equilibrium moisture content at saturation is around 8%. It is also consistent with the equilibrium moisture content at saturation (around 8.5%) presented in [4, 6], since in our case the reinforcement weight fraction is lower. Also, the saturation level depends on water temperature and it seems globally higher at lower temperatures (Table 1). The difference for minimum and maximum temperatures (20°C and 80°C) is around 7%. This trend is again very similar to that presented in [4].For information, the reach of specimen saturation is time consuming, especially for low immersion temperatures. For example, more than one year was needed to reach saturation for samples immersed at 20°C.
3.4 Comparison test/model
The experimental results obtained for moisture absorption with time have been compared to simulation models derived from Fick’s equation (Eq. 2).
3.4.1
Analytical solution of Fick’s equationA first model is considered by assuming that, due to the specimen dimensions, the moisture diffusion mainly occurs along specimen’s thickness h (4 mm in our case). This allows the use of a one-dimensional form of Fick’s equation, which can be solved analytically [8, 18]. Thus the analytical solution gives the evolution of the relative weight gain as a function of time M(t)
n n t h n D sn
e
M
t
M
0 1 2 2 2 2 2 21
2
1
8
1
)
(
(Eq. 4)In this solution, Msis the relative weight gain at saturation (when t ).
Relation (4) can be considered as a first approximation for thin specimens. In the present study, this analytical solution is first used for comparison with experimental data and FEA results. However, its
- 12/21- principal interest is for setting up of the parameters of a new model that features a variation of the diffusion coefficient D, as presented in section 4.
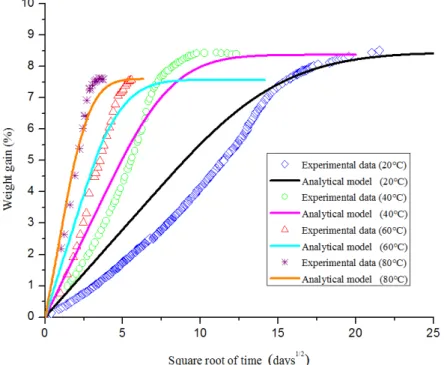
The experimental and analytical evolutions of water absorption with time for a specimen immersed in 20°C, 40°C, 60°C and 80°C water as a function of the square root of time are compared in Figure 6.
Figure 6: Experimental results of water isothermal diffusion compared with an analytical solution based on a purely fickian diffusion for temperatures 20 °C, 40 °C, 60 °C, and 80 °C.
Overall, the analytical evolution of water absorption with time exhibits the same increase trend than the experimental data. Of course, analytical and experimental results tend to the same saturation level. However it can be noticed that analytical results do not correlate with experimental data all along the absorption. This difference can be explained by the fact that the actual behavior of moisture absorption in this material cannot be considered as purely fickian. Moreover, as introduced in the previous section, the shape of these experimental curves suggests that the actual diffusion coefficient D is not constant and that it increases during the absorption process.
3.4.2
FEA solution of Fick’s equationFEA [19] has shown great capabilities in solving many problems, among witch mass (in this case moisture) diffusion. Even if a few FEA commercial packages allow solving the 3D version of Fick’s equation (equation 2) explicitly [18], a common way of doing it is using the analogy [8, 20] between Fick’s equation and the equation governing heat transfer [21]:
- 13/21-
2 2 2 2 2 2z
T
y
T
x
T
t
T
(Eq. 5)Practically, using a thermal-diffusion analogy is a very interesting option since the great majority of commercial and open source FEA solvers feature heat transfer modules. In this work, we used such an analogy and solved Fick’s equation using a commercial heat transfer FEA solver [22]. In this analogy, temperature T is thus equivalent to moisture concentration C and thermal diffusivity α is equivalent to the diffusion coefficient D. The only restriction in doing such an analogy is that both moisture and temperature diffusion cannot be solved together. In our case, due to the fact that moisture diffusion is extremely slow, the temperature can reasonably be considered as constant with space coordinates and time, for the specimens and also for the thermostated water used for immersion. Thus, heat transfer has no effect on our experiments and the thermal analogy can be used.
3.4.3
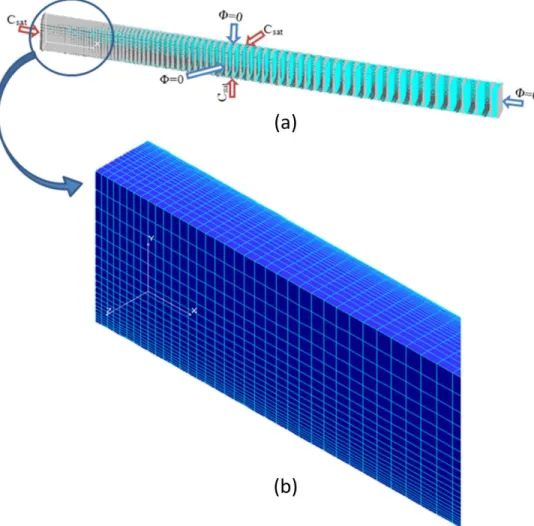
FEA boundary conditions and elementsThe FEA model used (see Figure 7) takes advantage of the fact that the geometry of specimens features 3 planes of symmetry, which allows only modelling and meshing one eight of specimens.
In this FEA model, these planes of symmetry are modelled using zero-flux boundary conditions (BCs) as shown in Figure 7a. The initial distribution (at t0) of moisture concentration C(x,y,z,t) inside the material is taken as C(x,y,z,0)0(except for the faces that are in contact with immersion water as explained just below). This assumption states that the initial moisture concentration can be neglected with respect to moisture uptake after immersion. Since the geometry is very simple, 8 nodes linear hexahedrons can easily be used to mesh it automatically, as illustrated in Figure 7b. As introduced above, the mesh represents one eight of the specimens due to symmetry. It features 38 400 linear hexahedrons and 42 525 nodes. Also, Figure 7b shows that the element size distribution has been adapted and optimized to obtain accurate FEA results in less CPU time. Indeed, refined layers of elements have been used close to the exterior faces, which means close to BCs representing the contact with immersion water. These BCs (see Figure 7a) are classically applied [18] as an imposed concentrationCsatthat corresponds to the maximum concentration reached once saturation occurs. Refined layers of finite elements used close to these BCs actually contribute to improve the accuracy of FEA simulations because the maximum concentration gradient occurs close to the contact with water, as shown in Figure 8. Indeed, Figure 8 shows the evolution of moisture concentration versus time across the full section of a specimen that has been immersed in water at temperature 20º C, as calculated with such a FEA simulation.
- 14/21-
Figure 7: The FEA model, (a) BCs (b) mesh.
Figure 8: FEA results for the concentration across a section of a specimen along immersion (20º C).
3.4.4
Computing the weight uptake from FEA resultsOnce taken into account the thermal-diffusion analogy, the raw result provided by the FEA solver is the transient evolution of moisture concentration C(x,y,z,t) as an interpolation of nodal values calculated
- 15/21- on the FEA mesh. The comparison with experimental results and with the analytical model presented in section 3.4.1 requires calculating the relative weight gain at time t M(t)from the field C(x,y,z,t).
) (t
M is basically obtained by integrating C(x,y,z,t) over the specimen volume V:
Vdxdydz
t
z
y
x
C
m
t
M
(
)
1
.
,
,
,
.
0 (Eq. 6)This integral is calculated from the interpolation of FEA nodal results across each finite element using a Gauss-Legendre quadrature [19]. Since, as introduced above, the initial distribution (at time t0) of moisture concentration is considered as C(x,y,z,t)0, it implies that the initial moisture uptake is considered as M( 0) 0.
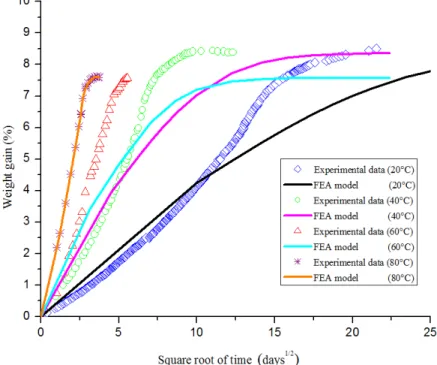
The experimental and FEA evolutions of water absorption with time for a specimen immersed in 20°C, 40°C, 60°C and 80°C water as a function of the square root of time are compared in Figure 9.
Figure 9: Experimental results of water isothermal diffusion compared with FEA simulations based on a purely fickian diffusion for temperatures 20 °C, 40 °C, 60 °C, and 80 °C.
Like in the case of the analytical solution, the moisture in both cases exhibits the same increase trend and FEA and experimental results tend to the same saturation level. Also, for the same reasons as introduced in the previous section, FEA results do not correlate with experimental curves along the absorption, which confirms that the actual behavior of moisture absorption in this material cannot be considered as fickian and that a new model with a varying diffusion coefficient D should be considered.
- 16/21-
4 A new non-fickian model
4.1 Variation of the diffusion coefficient
The observation of experimental results indicates that the diffusion kinetics studied is not fickian and by the way, experimental results of diffusion cannot be represented using equation (2) with a constant diffusion coefficient D. Indeed, when diffusion is purely fickian, the slope of the absorption curve is constant and coefficient D can be estimated from this slope between time t1 and t2 using [23, 24]:
2 1 2 1 2 2 s t t M M M 4 h D (Eq. 7)
In this equation, M1 and M2 represent relative weight gain at times t1 and t2 respectively, Ms is the relative weight gain at saturation and h is the specimen thickness.
The curves illustrated in Figure 5 suggest that, in our case, coefficient D varies along the process since this slope in not constant. This variation can be explained considering physical and chemical phenomena occurring along water penetration inside the composite. In the literature, several authors have studied the absorption of water by natural fiber composites. The exposure to water of a composite reinforced by natural fibers, known for their hydrophilic nature, causes swelling in the fiber which causes micro cracks in the matrix and then the separation of the fiber-matrix interface, thereby creating additional passages for the water particles which increases the rate of water penetration [25, 26]. Therefore, we propose replacing the constant diffusion coefficient D in Fick’s equation, by a new coefficient that varies with time. Also, we propose to model the variation of this diffusion coefficient with the water immersion temperature T. In this objective, we used the analytical solution introduced in section 3.4.1 to setup a model for the variation of diffusion coefficientD( tT, ). By doing that, we found that the following form of equation leads to a very good correlation with experimental results:
2 ). ( 0( ) ) , (T t D T e T t D (Eq. 8)
In this new model D0 represents the initial diffusion coefficient (the initial slope of absorption curves) and ω is a corrective coefficient. As stated in equation 8, both D0 and ω vary with water immersion temperature. The variation of these coefficients with immersion temperature can be derived from experimental data presented in section 3.3 for each temperature.
Figure 10 shows that the variation of the initial diffusion with water immersion temperature is consistent with Arrhenius equation [27] since Ln(D0) as a function of T1 (with T in Kelvin) is linear. Thus D0(T) can be expressed as:
RT Eae
d
T
D
0(
)
0 (Eq. 9)- 17/21-
where
d0: index of water permeability in the material Ea: activation energy for diffusion
R: ideal gases constant
T: immersion temperature (expressed in Kelvin)
Figure 10: Variation of Ln(D0 ) with the inverse of immersion temperature (Kelvin).
From the approximation shown in Figure 10 on our experimental data, we obtain the following result for ) (D0 Ln and D : 0
T T D Ln 0( ) 8.466388.36 e T T D 36 . 6388 4 0( ) 2.12 10 (Eq.10)Then, from the approximation shown in Figure 11, we obtain the evolution of ω (in s-2) with water immersion temperature T (also with T in Kelvin):
T e T) 5.64 10 25 0.081
(
(Eq. 11)Consequently, the new diffusion coefficient model D( tT, ) finally writes as follows (for T in Kelvin and t in sec):
T - t e T .e
D(T,t)
5.64 1025 2 0.081 36 6388 410
12
.
2
(Eq. 12)- 18/21-
Figure 11: Variation of ω with immersion temperature (Kelvin).
Table 3 summarizes the values of parameters Ms, D0, ω, R, d0 and Ea obtained for each water immersion
temperature. As expected, for all immersion temperatures, values measured for the initial diffusion coefficient D0 are lower than those of the mean diffusion coefficient Dmean as summarized in Table 1.
T (oC) 20 40 60 80 Ms (%) 7.56 7.85 7.57 7.58 D0 (10-12 m2/s) 0.075 0.298 0.926 3.150 ω (10-15 s-2) 3.9 51.6 267.9 1338.2 R (J/mol K) 8,31 8,31 8,31 8,31 d0 (10-5 m2/s) 21.2 21.2 21.2 21.2 Ea (J/mol) 53 116 53 116 53 116 53 116
Table.3. Diffusion parameters at different temperatures obtained from experimental data.
4.2 Comparison with experimental data
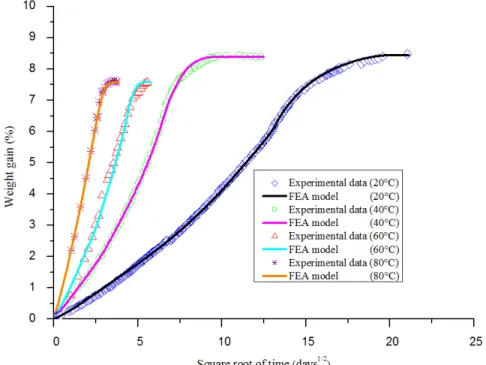
Figure 12 illustrates the comparison between experimental results and simulation results obtained using the analytical solution of the diffusion equation (see equation 4) inside which is introduced the model presented in the previous section forD(T,t).
- 19/21-
Figure 12: Experimental results of water isothermal diffusion compared with the new analytical model of diffusion for temperatures 20 °C, 40 °C, 60 °C, and 80 °C.
It appears clearly that, for the four water immersion temperatures considered, the correlation is much better than when using a constant diffusion coefficient. It must be reminded that the analytical model is based on solving a one-dimensional form of Fick’s equation. The next step consists of applying the new model forD(T,t)in the FEA simulations introduced in section 3.4.2. Indeed, the FEA solution is based on a 3D version of Fick’s equation and thus results obtained with FEA are expected to better fit experimental data. Figure 13 shows the comparison between the experimental results of hydrothermal aging, at the 4 temperatures considered, with FEA simulations, using this new model forD(T,t). These results illustrate that, as expected, the correlation with experimental data is much better than when using a model with a constant diffusion coefficient, and this for the 4 water temperatures considered. It also illustrates that, as expected, the correlation with experimental data is better when using a 3D version of Fick’s equation (with FEA) than when using its one dimensional version (with the analytical solution).
5 Conclusion
In this contribution, the kinetics of moisture diffusion and the associated degradation of mechanical properties in a polypropylene (PP) composite reinforced with short hemp fibers are studied. It shows that the degradation of mechanical properties, as the moisture absorption increases, makes that the behavior of specimens converges to that of pure PP ones. Also, immersion tests in isothermal baths filled with distilled water at different temperatures have been conducted and it appears that the absorption process is always
- 20/21- non-fickian since the first stage of diffusion over the square root of time is clearly nonlinear. For the 4 immersion temperatures studied, the diffusion coefficient increases with time through an exponential law. A new model, based on the introduction of a variable diffusion coefficient in Fick’s diffusion equation, has been successfully considered. Experimental results also show that the diffusion coefficient strongly depends on water temperature, and therefore, the time required to reach saturation also strongly depends on water temperature.
Figure 13: Experimental results of water isothermal diffusion compared with FEA simulations based on the new model of diffusion for temperatures 20 °C, 40 °C, 60 °C, and 80 °C.
6 Acknowledgement
This study was carried out as part of a project supported by research funding from the Québec Nature and Technology Research Fund and by the Natural Sciences and Engineering Research Council of Canada (NSERC).
7 References
1. Alamri, H., A. Alhuthali, and I.M. Low, Mechanical properties and moisture absorption
behaviour of cellulose-fibre reinforced polymer composites, in Green Composites: Properties, Design and Life Cycle Assessment. 2010. p. 175-197.
2. Dhakal, H.N., Z.Y. Zhang, and M.O.W. Richardson, Effect of water absorption on the mechanical
properties of hemp fibre reinforced unsaturated polyester composites. Composites Science and
Technology, 2007. 67(7-8): p. 1674-1683.
3. Kushwaha, P.K. and R. Kumar, Studies on water absorption of bamboo-polyester composites:
Effect of silane treatment of mercerized bamboo. Polymer - Plastics Technology and Engineering,
- 21/21- 4. Panthapulakkal, S. and M. Sain, Studies on the water absorption properties of short hemp-glass
fiber hybrid polypropylene composites. Journal of Composite Materials, 2007. 41(15): p.
1871-1883.
5. Pickering, K., Properties and Performance of Natural-Fibre Composites. 2008: Woodhead Publishing. 576.
6. Panthapulakkal, S. and M. Sain, Injection-molded short hemp fiber/glass fiber-reinforced
polypropylene hybrid composites -mechanical, water absorption and thermal properties. Journal
of Applied Polymer Science, 2007. 103(4): p. 2432-2441.
7. Ray, B.C. and D. Rathore, Environmental damage and degradation of FRP composites: A review
report. Polymer Composites, 2014.
8. Jost, W., Diffusion in solids, liquids, gases. 1960: New York Academic Press. 652.
9. Wang, W., M. Sain, and P.A. Cooper, Study of moisture absorption in natural fiber plastic
composites. Composites Science and Technology, 2006. 66(3-4): p. 379-386.
10. Grace, L.R. and M.C. Altan, Non-fickian three-dimensional hindered moisture absorption in
polymeric composites: Model development and validation. Polymer Composites, 2013. 34(7): p.
1144-1157.
11. Weitsman, Y., Fluid Effects in Polymers and Polymeric Composites. Mechanical Engineering Series. 2012: Springer. 176.
12. Advanced Composite Materials-Environmental Effects. 1978: ASTM special technical
publication. 298.
13. Weitsman, Y., Diffusion with Time-Varying Diffusivity, with Application to Moisture-Sorption in
Composites. Journal of Composite Materials, 1976. 10: p. 193-204.
14. Roy, S., et al., Anomalous moisture diffusion in viscoelastic polymers: modeling and testing. Journal of Applied Mechanics, Transactions ASME, 2000. 67(2): p. 391-396.
15. Yeh, R.J., P.W. Lin, and K.F. Lin, Two-stage moisture absorption behavior and hydrolysis of
cured dicyanate ester resins. Journal of Polymer Research, 2002. 9(1): p. 31-36.
16. Zisman, W.A., Relation of the Equilibrium Contact Angle to Liquid and Solid Constitution, in
Contact Angle, Wettability, and Adhesion. 1964, AMERICAN CHEMICAL SOCIETY. p. 1-51.
17. Kwok, D.Y. and A.W. Neumann, Contact angle measurement and contact angle interpretation. Advances in Colloid and Interface Science, 1999. 81(3): p. 167-249.
18. Daly, H.B., et al., Experimental characterization and numerical simulation of the humidity
absorption process in glass reinforced composites under dissymmetric exposure conditions.
Polymer Composites, 2009. 30(12): p. 1825-1836.
19. Bathe, K.J., Finite Element Procedures. 1996: Prentice-Hall.
20. Yoon, S., B. Han, and Z. Wang, On moisture diffusion modeling using thermal-moisture analogy. Journal of Electronic Packaging, Transactions of the ASME, 2007. 129(4): p. 421-426.
21. Welty, J.R., et al., Fundamentals of momentum, heat and mass transfer. 2000: Wiley.
22. COSMOS/M - Theory manual - 2010 Version, ed. SRAC.
23. Ben Daly, H., et al., Investigation of water absorption in pultruded composites containing fillers
and low profile additives. Polymer Composites, 2007. 28(3): p. 355-364.
24. Shen, C.-H. and G.S. Springer, Moisture Absorption and Desorption of Composite Materials. Journal of Composite Materials, 1976. 10(1): p. 2-20.
25. Dhakal, H., Z. Zhang, and M. Richardson, Effect of water absorption on the mechanical
properties of hemp fibre reinforced unsaturated polyester composites. Composites Science and
Technology, 2007. 67(7): p. 1674-1683.
26. Bismarck, A., et al., Surface characterization of flax, hemp and cellulose fibers; surface
properties and the water uptake behavior. Polymer composites, 2002. 23(5): p. 872-894.