HAL Id: hal-03060510
https://hal.archives-ouvertes.fr/hal-03060510
Submitted on 14 Dec 2020
HAL is a multi-disciplinary open access
archive for the deposit and dissemination of sci-entific research documents, whether they are pub-lished or not. The documents may come from teaching and research institutions in France or abroad, or from public or private research centers.
L’archive ouverte pluridisciplinaire HAL, est destinée au dépôt et à la diffusion de documents scientifiques de niveau recherche, publiés ou non, émanant des établissements d’enseignement et de recherche français ou étrangers, des laboratoires publics ou privés.
Characterization by APT and TEM of Xe nano-bubbles
in CeO 2
Carine Perrin-Pellegrino, Myriam Dumont, Mohamed Fadel Keïta, Thomas
Neisius, Georges Mikaelian, Dominique Mangelinck, Gaëlle Carlot, Philippe
Maugis
To cite this version:
Carine Perrin-Pellegrino, Myriam Dumont, Mohamed Fadel Keïta, Thomas Neisius, Georges Mikaelian, et al.. Characterization by APT and TEM of Xe nano-bubbles in CeO 2. Nuclear In-struments and Methods in Physics Research Section B: Beam Interactions with Materials and Atoms, Elsevier, 2020, 469, pp.24-27. �10.1016/j.nimb.2020.02.032�. �hal-03060510�
Characterization by APT and TEM of Xe nano-bubbles in CeO
2Carine PERRIN-PELLEGRINO1, Myriam DUMONT1, Mohamed Fadel KEITA1, Thomas NEISIUS2, Georges MIKAELIAN1, Dominique MANGELINCK1, Gaëlle CARLOT3, Philippe MAUGIS1
1
Aix Marseille Univ, Université de Toulon, CNRS, IM2NP, Marseille, France
2
Fédération de Recherche Sciences Chimiques, Marseille, France
3
CEA, DEN, Département d’étude des combustibles, Centre de Cadarache, 13108 Saint-Paul-lez-Durance
Abstract
Only few experimental techniques are able to characterize the space and size distributions of gas-filled nano-cavities embedded in ceramic matrices. The aim of the current paper is to point out the potentiality of atom probe tomography for this objective. Nano-clusters enriched in Xe are evidenced in 3-D reconstructed volumes in Xe-implanted CeO2. Their size and density are comparable to bubble
populations observed by TEM.
Keywords
Introduction
During in-pile irradiation of nuclear fuels, each fission event generates two fission fragments, 15 % of which are rare gases (xenon and krypton). These elements tend either to be released from the fuel or to combine with lattice defects created by fission to form nanometer size clusters (bubbles). The core operating conditions are currently adjusted to ensure a fission gas release below a critical threshold. A more accurate evaluation of fission gas release in pile requires the assessment of the amount of rare gases trapped inside the bubbles. This can be achieved by evaluating the bubble size distribution and their content in fission gases.
Many studies have already focused on the characterization of intragranular bubbles in UO2 mainly by
the use of transmission electron microscopy (TEM) [1–5]. The quantification of gas entrapped in the material was also performed using SIMS (secondary ion mass spectrometry) [6], or XAS (X-ray absorption spectroscopy) measurements [7–9].
In the current paper, Atom Probe Tomography (APT) is proposed as an alternative technique to characterize bubble space and size distribution in a bulk material. This technique has already proven to be accurate in the characterization of nano-objects embedded in a matrix, giving details on the 3-D distribution of particles, as well as on their chemistry, in several systems [10,11]. This technique is, however, challenging to apply when dealing with bubbles filled with gases and only a few results on He-bubbles and nanovoids detected by APT are available in the literature [12–14]. To detect such objects, apparent density modifications were used, based on the fact that the occurrence of a cavity at the apex of the tip should result in ion trajectory aberrations [15–17]. Imaging of nanobubbles using gas-atom detection is scarce in the literature. This was done recently by Estivill et al. [18] in atom probe tips prepared by Xenon focused ion beam milling in Silicon in which they were able to detect small disc-shaped Xe-rich clusters. Recent studies aimed at characterizing fission gas atoms in nuclear fuels or surrogates using APT [19,20] in Xe or Kr- implanted materials. Examination of the reconstructed volumes allowed the authors to draw gas in-depth profiles, with a detected concentration below the expected value. No bubble, however, were detected in these volumes, contrary to the TEM observations.
The aim of the present study is to explore the capability of APT to characterize nano-bubbles filled with Xe atoms in an implanted ceramic material, CeO2. Ceria is used as a non-radioactive structural
analogue to UO2 since it has the same Fm-3m fluorite structure with similar lattice parameter. The
APT results are compared to those of SRIM (Stopping and Range of Ions in Matter) calculations and to observations performed by TEM.
Material and methods
Polycrystalline sintered CeO2 was implanted with Xe+-ions at room temperature with an energy of
220 keV and a fluence of 1.1016 at.cm-2, leading to a damaged region close to the surface, with a stopping range around 60nm under the surface (see figure 1(a)). Xe-implanted samples were
annealed under air at 800°C for 12h or at 1300°C for 4h to induce bubble formation and growth. Such annealing treatments are expected to induce recovery of extended defects (such as dislocation loops) as well as implantation-induced strain, making bubble observation by TEM possible. APT and TEM samples were prepared by Focused Ion Beam (FIB) allowing the observation in depth of the implanted region. For TEM, a TECNAI G2 and a TITAN 80-300 (Cs-corrected) microscopes were used, operating at 200kV and 300 kV respectively. For APT samples, a 100 nm thick Ni protective layer was deposited in order to prevent Ga ions being implanted during the FIB preparation. The APT analyses were carried out in a green-laser (532nm) assisted CAMECA LEAP 3000X HR instrument under
ultra-high vacuum conditions (<10-8Pa).
The laser pulsing rate was set to 100 kHz. The detection rate,
the specimen temperature and the laser energy were optimized, depending on the tip, and
are noticed in the respective figure caption.
APT reconstruction was carried out using IVAS 3.6.7 software. No poles or zone lines have been evidenced during the reconstruction process.Results
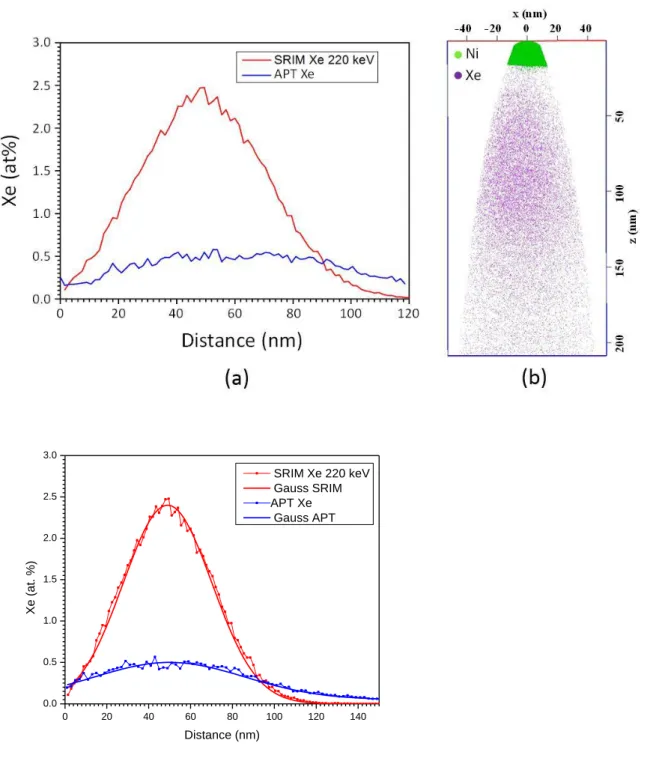
In figure 1(b), the reconstructed volume displays the distribution of Xe atoms in the as-implanted condition. The limit with the Ni cap indicates the exact position of the top surface. As expected from SRIM calculations, Xe-profile follows a Gaussian-like distribution centered at a depth of around 70nm. Xe concentration in-depth profile measured by APT in the as-implanted condition is compared to the SRIM calculated profile in figure 1(a). In this condition, nano-bubbles were not detected neither by using the isodensity method as proposed by Miller et al. [17] nor by using Xe iso-concentrations as performed by Estivill et al. [18].
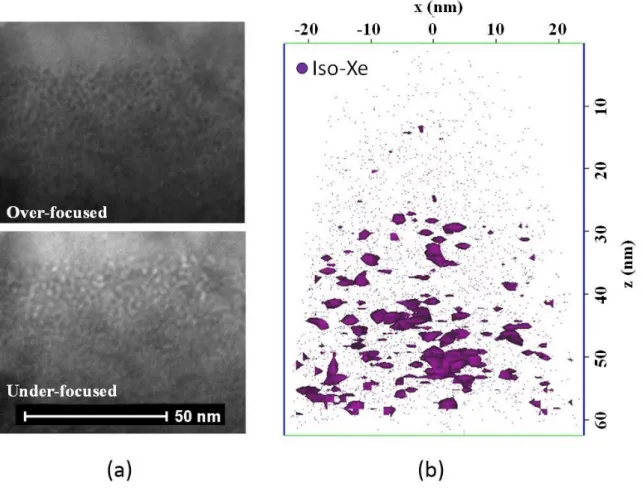
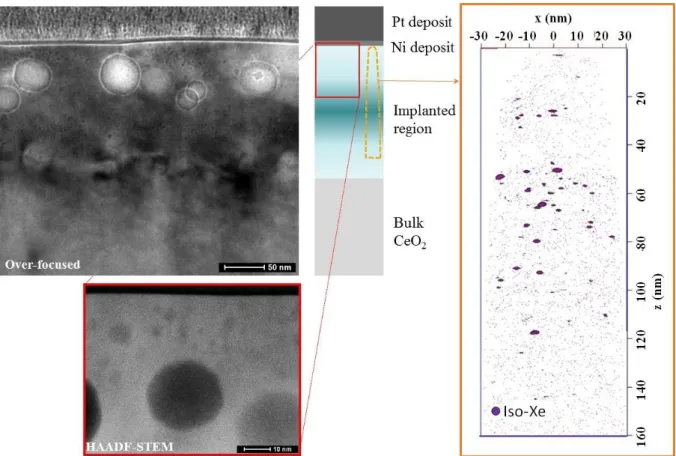
Figures 2(a) and 3(a) display the TEM observations for two annealed conditions: 800°C/12h and 1300°C/4h. The lowest temperature annealing leads to the formation of homogeneously-distributed nano-bubbles with diameters smaller than 5nm. On the contrary, the high temperature annealing gives rises to a bimodal distribution of bubbles: one family with a size in the 10-50nm range in diameter that might be weakly-pressurized regarding the dark contrast in HAADF-mode (see figure 3(b)), the second family with a size in the same range than the 800°C annealed sample, i.e. less than 5nm in diameter.
These two samples were analyzed by APT, results are displayed in figure 2(b) and 3(c). In both cases, the analysis using isodensity method does not allow to detect nano-bubbles, however Xe iso-concentration procedure revealed the presence of nano-clusters enriched in Xe. It is worth noting that the size and the density extracted from iso-concentration analysis are in good agreement with TEM observations. In fact, the size of the population of nano-clusters in the 800°C-annealed sample was estimated to 3nm in diameter with a number density of 1.1024 clusters.m-3, and 2nm with a number density of 3.1023 clusters.m-3 in the case of the 1300°C-annealed sample. These nano-clusters can then be identified as the family of small nano-bubbles observed in TEM for both conditions. Discussion
Comparing the Xe-concentration profiles as calculated by SRIM and as measured by APT (see figure 1(a)), the accordance in terms of position of maximum concentration and width of the implanted region is good considering the uncertainties in both methodologies. However, as already observed by other authors [19], the concentration measured by APT is well behind the calculated value (here by a factor of 5). As proposed by other authors [18,20], this is probably due to the gas release between evaporation pulses in the atom probe. In fact, when bubbles are opened by evaporation of surrounding matrix atoms, only part of the Xe atoms are ionized on a laser pulse and detected. Prior to the next pulse, Xe gas atoms are allowed to escape into the vacuum chamber.
Moreover, in the as-implanted condition, non-detectability of nano-bubbles in the as-implanted state might be explained either because they are not present, or because they are under the detection limit (minimum observable size of clusters). In the latter case, the gas release from bubbles between evaporation pulses can be argued. In the case of solute Xe atoms dispersed in the ceramic matrix, gas release preferential evaporation, already reported in other systems involving non-gaseous species [REF], may also be considered since the solubility of Xe is expected to be very low [20], so that, when arriving at the apex of the tip, Xe atoms, only weakly bonded to the matrix atoms [REF], can escape
the material into vacuum, maybe assisted by the electrical field or by the heat transfer supplied by the pulsed laser that may increase the local temperature of several hundred degrees [21]. In fact both effect, gas release and preferential evaporation, may be acting together to limit the detection of the Xe atoms, the first being linked to the presence of bubbles filled with Xe.
In other conditions (annealing at 800°C and 1300°C), nano-bubbles can be detected. However, it should be emphasized that the iso-concentration level used to image the clusters is very small (1.3 at %). This low value might be explained by several effects including trajectory aberrations for matrix atoms that renders the bubble undetected by using iso-density surface procedure as proposed by Miller [17] and gas release during evaporation. Another consequence of these trajectory aberrations that cannot be corrected by the reconstruction procedure is that the real shape of the bubbles is not perfectly reproduced. As already observed in the case of precipitates with different evaporation fields as compared to the matrix, the resulting shape is disc-like bubbles, whereas TEM observations confirm that bubbles are round-shaped with evidence of facets for larger ones. However no clear disc-like clusters have been observed in the APT volumes due their small size. Whatsoever comparing Xe atoms repartition in the three analyzed samples lead to conclude that the distribution of Xe in the three conditions are significantly different : Xe only in solid solution in the as-implanted state, high density of Xe clusters around 3nm in size in the 800°C-annealed sample and low density of 2nm-sized Xe clusters in the 1300°C-annealed sample. This is in good agreement with TEM observations.
Conclusion
APT analysis has proven to be able to detect Xe-enriched clusters, whose size and density are comparable to bubble populations observed by TEM. Xe composition (mean concentration as well as bubble content) is however under-estimated due to gas release and preferential evaporation during evaporation in the atom probe.
References
[1] K. Nogita, K. Une, High resolution TEM observation and density estimation of Xe bubbles in high burnup UO2 fuels, Nucl. Instruments Methods Phys. Res. Sect. B Beam Interact. with Mater. Atoms.
141 (1998) 481–486. doi:10.1016/S0168-583X(98)00040-8.
[2] C. Sabathier, L. Vincent, P. Garcia, F. Garrido, G. Carlot, L. Thomé, P. Martin,C. Valot, In situ TEM of temperature-induced fission product precipitation in UO2, Nucl. Instruments Methods Phys. Res.
Sect. B Beam Interact. with Mater. Atoms. 266 (2008) 3027–3032.
[3] A. Michel, C. Sabathier, G. Carlot, O. Kaïtasov, S. Bouffard, P. Garcia, C. Valot, An in situ TEM study of the evolution of Xe bubble populations in UO2, Nucl. Instruments Methods Phys. Res. Sect. B Beam
Interact. with Mater. Atoms. 272 (2012) 218–221.
[4] A. Michel, C. Sabathier, G. Carlot, M. Cabié, S. Bouffard, P. Garcia, A TEM study of growth with temperature in xenon and krypton implanted uranium dioxide, Diffusion in materials – DIMAT 2011, Defect and Diffusion Forum. 323-325 (2012) 191–196.
[5] P. Garcia, G. Martin, C. Sabathier, G. Carlot, a. Michel, P. Martin, B. Dorado, M. Freyss, M. Bertolus, R. Skorek, J. Noirot, L. Noirot, O. Kaitasov, S. Maillard, Nucleation and growth of intragranular defect and insoluble atom clusters in nuclear oxide fuels, Nucl. Instruments Methods Phys. Res. Sect. B Beam Interact. with Mater. Atoms. 277 (2012) 98–108. doi:10.1016/j.nimb.2011.12.031.
[6] J. Lamontagne, L. Desgranges, C. Valot, J. Noirot, T. Blay, I. Roure, B. Pasquet, Fission gas bubbles characterisation in irradiated UO2 fuel by SEM, EPMA and SIMS, Microchim. Acta. 155 (2006) 183–
[7] P. Garcia, P. Martin, G. Carlot, E. Castelier, M. Ripert, C. Sabathier, C. Valot, F. D’Acapito, J-L. Hazemann, O. Proux, V. Nassif, A study of xenon aggregates in uranium dioxide using X-ray absorption spectroscopy, J. Nuc. Mat. 352 (2006) 136–143.
[8] P. Martin, P. Garcia, G. Carlot, C. Sabathier, C. Valot, V. Nassif, O. Proux, J.L. Hazemann, XAS characterisation of xenon bubbles in uranium dioxide, Nucl. Instruments Methods Phys. Res. Sect. B Beam Interact. with Mater. Atoms. 266 (2008) 2887–2891. doi:10.1016/j.nimb.2008.03.180.
[9] P.M. Martin, E. Vathonne, G. Carlot, R. Delorme, C. Sabathier, M. Freyss, P. Garcia, M. Bertolus, P. Glatzel, O. Proux, Behavior of fission gases in nuclear fuel: XAS characterization of Kr in UO2, J. Nuc.
Mat. 466 (2015) 379–392.
[10] T.F. Kelly, M.K. Miller, Invited review article: Atom probe tomography, Rev. Sci. Instrum. 78 (2007). doi:10.1063/1.2709758.
[11] B. Gault, E. Mottay, A. Courjaud, F. Vurpillot, A. Bostel, A. Menand, B. Deconihout, Ultrafast Laser Assisted Field Evaporation and Atom Probe Tomography Applications, J. Phys. Conf. Ser. 59 (2007) 132–135. doi:10.1088/1742-6596/59/1/028.
[12] P.D. Edmondson, C.M. Parish, Y. Zhang, A. Hallén, M.K. Miller, Helium entrapment in a nanostructured ferritic alloy, Scr. Mater. 65 (2011) 731–734. doi:10.1016/j.scriptamat.2011.07.024. [13] Q. Li, C.M. Parish, K. a. Powers, M.K. Miller, Helium solubility and bubble formation in a
nanostructured ferritic alloy, J. Nucl. Mater. 445 (2014) 165–174. doi:10.1016/j.jnucmat.2013.10.048. [14] B. Mazumder, M.E. Bannister, F.W. Meyer, M.K. Miller, C.M. Parish, P.D. Edmondson, Helium trapping in carbide precipitates in a tempered F82H ferritic-martensitic steel, Nucl. Mater. Energy. 1 (2015) 8–12. doi:10.1016/j.nme.2014.11.001.
[15] S. Parviainen, F. Djurabekova, S. Fitzgerald, A. Ruzibaev, K. Nordlund, Atomistic simulation of field assisted evaporation in atom probe tomography, J. Phys. D. Appl. Phys. 49 (2016) 45302.
[16] E.A. Marquis, Atom probe tomography applied to the analysis of irradiated microstructures, J. Mater. Res. 30 (2015) 1222–1230.
[17] M.K. Miller, L. Longstreth-Spoor, K.F. Kelton, Detecting density variations and nanovoids, Ultramicroscopy. 111 (2011) 469–472. doi:10.1016/j.ultramic.2011.01.027.
[18] R. Estivill, G. Audoit, J.-P. Barnes, A. Grenier, D. Blavette, Preparation and Analysis of Atom Probe Tips by Xenon Focused Ion Beam Milling, Microsc. Microanal. 22 (2016) 576–582. doi:10.1017/S1431927616000581.
[19] B. Valderrama, H.B. Henderson, L. He, C. Yablinsky, J. Gan, A. Hassan, Fission Products in Nuclear Fuel: Comparison of Simulated Distribution with Correlative Characterization Techniques, Microsc. Microanal. 19 (2013) 968–969. doi:10.1017/S1431927613006831.
[20] L.F. He, B. Valderrama, A.-R. Hassan, J. Yu, M. Gupta, J. Pakarinen, H.B. Henderson, J. Gan, M. A. Kirk, A. T. Nelson, M.V. Manuel, A. El-Azab, T.R. Allen, Bubble formation and Kr distribution in Kr-irradiated UO2, J. Nucl. Mater. 456 (2015) 125–132. doi:10.1016/j.jnucmat.2014.09.026.
[21] A. Vella, On the interaction of an ultra-fast laser with a nanometric tip by laser assisted atom probe tomography: A review, Ultramicroscopy. 132 (2013) 5–18. doi:10.1016/j.ultramic.2013.05.016.
0 20 40 60 80 100 120 140 0.0 0.5 1.0 1.5 2.0 2.5 3.0 Xe (a t. % ) Distance (nm) SRIM Xe 220 keV Gauss SRIM APT Xe Gauss APT
Figure 1: As-implanted condition (a) Xe in-depth-profile as calculated by SRIM and measured in the as-implanted condition by APT volume analysis with Gauss corresponding functions (b) 3-D reconstruction of a tip taken from the as-implanted condition. The end of the nickel layer corresponds to the free surface of the sample. Tip was analyzed at 43.5 K with laser mode (o.3 nJ), 0.5% as evaporating rate.
Figure 2: Annealed condition at 800°C for 12hours (a) TEM observations of the implanted zone in over-focused and under-focused conditions (b) APT 3-D reconstructed volume with iso-concentration of Xe (threshold = 1,3at% Xe, mean concentration in the volume 0,2 at%). Tip was analyzed at 24 K with laser mode (o.85 nJ), 0.3% as evaporating rate.
Figure 3: Annealed condition 1300°C for 4 hours (a) TEM observations in over-focused conditions (b) HAADF-STEM image of the top layer of the implanted zone (c) APT 3-D reconstructed volume with iso-concentration of Xe (threshold = 1,3at% Xe, mean concentration in the volume 0,06 at%). Tip was analyzed at 43.6 K with laser mode (o.18 nJ), 0.2% as evaporating rate.