HAL Id: ensl-00182429
https://hal-ens-lyon.archives-ouvertes.fr/ensl-00182429
Submitted on 25 Oct 2007
HAL is a multi-disciplinary open access
archive for the deposit and dissemination of
sci-entific research documents, whether they are
pub-lished or not. The documents may come from
teaching and research institutions in France or
abroad, or from public or private research centers.
L’archive ouverte pluridisciplinaire HAL, est
destinée au dépôt et à la diffusion de documents
scientifiques de niveau recherche, publiés ou non,
émanant des établissements d’enseignement et de
recherche français ou étrangers, des laboratoires
publics ou privés.
substrate
Patrick Oswald, Lubor Lejcek
To cite this version:
Patrick Oswald, Lubor Lejcek. Faceting and stability of smectic A droplets on a solid substrate.
European Physical Journal E: Soft matter and biological physics, EDP Sciences: EPJ, 2006, 19 (4),
pp.441-452. �ensl-00182429�
DOI 10.1140/epje/i2005-10065-y
P
HYSICAL
J
OURNAL
E
Faceting and stability of smectic A droplets on a solid substrate
P. Oswald1,a and L. Lejˇcek1,2 1
Laboratoire de Physique, Ecole Normale Sup´erieure de Lyon, 69364 Lyon cedex 07, France
2
Institute of Physics, Czech Academy of Sciences, Na Slovance 2, 182 21 Prague 8, Czech Republic Received 24 November 2005 /
Published online: 13 April 2006 – c° EDP Sciences / Societ`a Italiana di Fisica / Springer-Verlag 2006 Abstract. It is shown that a smectic A droplet deposited on a solid substrate treated for strong homeotropic anchoring is faceted at the top in spite of the fact that there are no steps at the free surface, but instead edge dislocations in the bulk. The radius of the facet and the full profile of the curved part of the droplet are determined as a function of the temperature in the vicinity of a nematic-smectic A phase transition. It is shown that the observed profiles do not correspond to the actual equilibrium shape, but to metastable configurations close to their point of marginal stability. In addition, we predict that the profiles must be different for a given temperature depending on whether the droplet has been heated or cooled down to reach this temperature. Finally, we discuss the problem of the formation of giant dislocations in big droplets (Grandjean terraces).
PACS. 68.03.Cd Surface tension and related phenomena – 61.30.Hn Surface phenomena: alignment, an-choring, anchoring transitions, surface-induced layering, surface-induced ordering, wetting, prewetting tran-sitions, and wetting transitions – 61.30.Jf Defects in liquid crystals
1 Introduction
The equilibrium shape of a crystal is obtained by mini-mizing its total surface energy. This procedure leads to the well-known Wulff construction according to which the equilibrium shape is the pedal of the polar plot of the surface energy γ(θ, ϕ) (with (θ, ϕ) the angles defining the orientation of the surface element with respect to the un-derlying crystal lattice [1, 2]). In three-dimensional crys-tals, this construction leads to faceted shapes, with the size and the number of facets decreasing when the tem-perature increases. Such shapes were observed by scanning electron microscopy in micron-sized crystals of ordinary metals such as lead [3], silicon [4], or silver [5]. Large He4
crystals (i.e., of centimetric size) are also faceted, with the advantage of equilibrating much faster than the for-mer due to their quantum nature (atoms can go through energy barriers by tunneling effect) [6]. Faceted shapes were also observed in soft matter, in particular in the Blue Phases of cholesteric liquid crystals [7–9], in the smectic B plastic crystals [10, 11], and in the cubic phases of the lyotropic systems [12–15]. Although we are dealing with monocrystals in all these examples, the real question is al-ways to know whether the shapes observed experimentally are at equilibrium (in a stable or a metastable state), or result from some growth processes. This delicate problem will be discussed in detail in this article.
a
e-mail: Patrick.Oswald@ens-lyon.fr
Fig. 1. Observation in Michelson interferometry of a faceted droplet of the liquid crystal 8CB placed on a glass slide treated for homeotropic anchoring (photograph by J. Bech-hoefer, 1991).
Faceted droplets were also observed in smectic A liquid crystals which are one-dimensional crystals (the rod-like molecules form fluid layers which pile up on each other). In that case, the droplets are deposited on solid substrates treated for homeotropic anchoring. Although first obser-vations of faceting in smectic A are old [16–18], precise determination of droplet profiles as a function of temper-ature close to a nematic phase or an isotropic liquid is
relatively recent [19, 20]. The main findings of these ex-perimental studies can be summarized as follows:
1. Each droplet shows a single facet parallel to the sub-strate (Fig. 1), whose size increases when the temperature decreases.
2. The curved part of the droplet surface joins tangen-tially onto the facet.
3. All the attempts to fit the experimental profiles to a power law of type (ρ − rf)ν, with ρ the radius in polar
coordinates and rf the facet radius, led to an exponent
ν ranging typically between 1 and 2.5, depending on the temperature and the “angular window” of the fit. These large variations suggest that a power law is certainly not a good choice.
4. For a given temperature, the facet radius depends on the thermal history of the droplet. More precisely, the facet is systematically larger after heating than after cool-ing from the high-temperature phase (i.e., the nematic phase or the isotropic liquid, depending on the material). 5. Finally, the facet size stabilizes much faster after cooling (within a few seconds or minutes, typically) than after heating: in that case, many hours or even days are necessary to reach a stable shape with a facet generally larger than that observed by direct cooling from the ne-matic or the isotropic liquid.
To explain these observations, we used in ref. [21] the terrace-ledge-kink model (or TLK model) according to which the layers are strictly parallel to the solid sur-face and emerge at the free sursur-face by forming steps. This classical model predicts that a facet forms at the top of the droplet and matches tangentially the curved part of the droplet surface. This particular matching comes from the fact that the steps repulse with a 1/d2-law, which, in
smectic A, is only due to their entropic interactions (d is the distance between two steps), their elastic interac-tions being completely negligible because of the fluidity of the layers. This generic interaction leads to profiles of type (ρ − rf)ν, with the universal exponent ν = 3/2, in
profound disagreement with experiments.
In the same article, we developed an alternative model, in which steps were replaced by bulk dislocations. A direct consequence was that the top smectic layer was bent par-allel to the free surface. It turns out that this model was more reasonable than the TLK model because we know both theoretically [22] and experimentally (for a review, see [11]) that in smectic A, edge dislocations are repulsed by the free surface, a point we detail in reference [23]. On the other hand, we assumed without any justification, that the droplet had the shape of a spherical cap. In this arti-cle, we show that this affirmation was wrong and that this model can explain as well the existence of faceted droplets. The plan of the article is as follows. In Section 2, we recall the basics of the model and calculate the droplet energy and its general profile. In Section 3, we show the existence of two facet radii corresponding to two extrema of the total energy. In Section 4, we demonstrate that the smaller radius corresponds to the critical radius of the facet while the other, twice larger, corresponds to the equilibrium radius of the facet. We also show that all
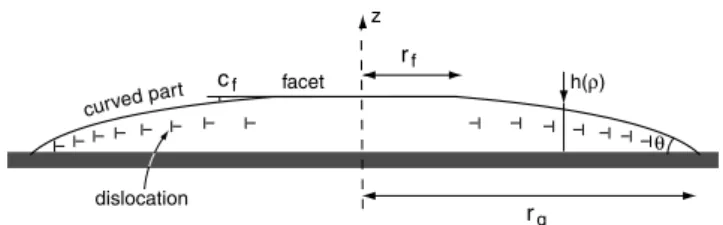
curved par t z facet θ rf rg dislocation h(ρ) cf
Fig. 2.Droplet configuration.
the droplets whose facet radius is larger than the critical radius are metastable. We thus conclude that the facet radius measured experimentally after cooling down the droplet from the nematic or the isotropic phases is the critical radius. In Section 5, we calculate the profile of a droplet at the critical radius as a function of the tem-perature close to a second-order smectic A-nematic phase transition and we compare with experiments. We then an-alyze in Section 6 how the facet radius changes in time when the temperature is again increased. A criterion of marginal stability is proposed to explain why the facet ra-dius again increases in spite of the fact that the droplet height is blocked. In Section 7, we discuss the stability of the droplets with respect to the formation of giant disloca-tions. This mechanism allows us to explain the formation of the so-called Grandjean terraces in big droplets. Finally, some concluding remarks are drawn in Section 8.
2 Energy of a faceted droplet and general
surface profile
The droplet configuration is recalled in Figure 2. It has the circular symmetry around the z-axis perpendicular to the substrate treated for homeotropic anchoring. Because the dislocations are repelled by both the substrate and the free surface, the dislocations are distributed throughout the bulk in order to accommodate the macroscospic faceted shape. In the following, we denote by rgthe droplet radius
at the substrate, by rfthe facet radius, by cfthe matching
angle between the facet and the curved part of the droplet surface, and by V the droplet volume, supposed to be constant.
In order to calculate the macroscopic droplet profile h(ρ) (with ρ the radius in polar coordinates), we need to minimize the total energy e of the droplet. The latter contains two terms:
1. A surface term coming from the different surface energies γ, γSL, and γSAbetween, respectively, the liquid
crystal and the air, the substrate and the liquid crystal, and the substrate and the air.
2. A bulk term due to the presence of the dislocations, which roughly sit at mid-distance between the solid and the free surfaces, as shown in reference [23].
Let Ed be the energy of a dislocation per unit length
and b its Burgers vector (which we assume to be equal to the layer thickness d for the moment). A straightfor-ward calculation, similar to that already used to calcu-late the profile of a meniscus surrounding a free-standing
film [11, 24], yields: e = 2π Z rg 0 ρdρ(γSL−γSA)+2πγ Z rf 0 ρdρ + 2πγ Z rg rf ρdρ s 1+µ dh dρ ¶2 −2πEbd Z rg rf ρµ dh dρ ¶ dρ. (1)
In this formula, the first term gives the surface energy on the substrate, the next two the surface energy between the droplet and the air, and the fourth one the energy of the bulk dislocations (with −(1/b)(dh/dρ) representing the density of dislocations). It is important to note that in this formula, the free surface of the droplet is assumed to be smooth at the scale of the distance between dislo-cations. This is justified in a droplet because the disloca-tions sit at large distance from the free surface (see refer-ence [23]), so that their deformation fields strongly overlap close to the free surface. For that reason, the fourth term in equation (1) in p1 + (dh/dρ)2 may be considered as
the repulsive interaction term between the dislocations. In practice, the droplets are rather flat (the wetting angle at the solid substrate is usually less than 15◦). For
that reason, we can reasonably assume that |dh/dρ| ¿ 1, which allows us to develop the termp1 + (dh/dρ)2to first
order in (dh/dρ)2
. This leads to the following, simpler, expression for the energy:
e ≈ 2πS Z rg 0 ρdρ + πγ Z rg rf ρdρµ dh dρ ¶2 −2πEd b Z rg rf ρµ dh dρ ¶ dρ, (2)
where S = γSL− γSA+ γ is the so-called spreading power.
The following step consists of minimizing the energy with the constraint that the volume remains constant:
V = 2π Z rg
0
ρh(ρ)dρ (3)
This leads to the following differential equation for the profile (equivalent to the Laplace law):
∆P = −γ1 ρ d dρ ¹ ρdh dρ º +Ed bρ , (4) where ∆P = PL− PA is the pressure difference between
the liquid crystal and the air. Note that ∆P is the La-grange multiplier associated with condition (3).
The resolution of equation (4) leads to the following general profile for the droplet:
h(ρ) = Ed bγ µ ρ − rg− rfln ρ rg ¶ −∆P2γ Ã ρ2 − r2 g 2 − r 2 fln ρ rg ! − cfrfln ρ rg . (5)
This profile satisfies the conditions h(rg) = 0 and
[dh(ρ)/dρ]ρ=rf = −cf, with cf > 0.
Although we know now the general droplet profile, the problem is far from being solved because rg, rf, and cf
are still unknown.
Determining these quantities requires to minimize the total energy. The latter can be calculated by replacing h(ρ) by its expression (5) in equation (2). This leads to the following formula for the energy:
e = eo+ αcf+ βc2f (6) with eo= πγr2 g 2 " s − g¡g − prf¢ (r 2 g− r 2 f) r2 g +(prf) 2 8 Ã 3r 2 f r2 g−4+ r2 g r2 f ! +r 2 f 2r2 g¡2g−pr f¢ 2 lnrg rf # , (7a) α = πγrf 2 · p¡r2 g− r 2 f¢ + 2rf¡2g − prf¢ lnrg rf ¸ , (7b) β =¡πγr2 f¢ ln rg rf . (7c)
In these equations we have introduced the following nota-tions: g = Ed bγ , s = 2S γ , and p = ∆P γ . (8) Note that g and s are dimensionless constants character-istic of the material and that p (which gives the pressure difference between the interior of the droplet and the air) has for dimension [L]−1.
3 Determination of the facet and the droplet
radii
Before minimizing the energy e as a function of rgand rf,
let us show that cf = 0.
According to equation (7c), β > 0 because rg > rf.
The sign of α is less obvious to determine. Nevertheless it will be possible to check a posteriori that p > 0 (the pressure inside the droplet is always larger than the air pressure). In this case, α > 0 according to equation (7b) whatever the value of rf < rg. As a result, the energy e
is minimum when cf = 0 and reduces to the simplified
expression eo given by equation (6).
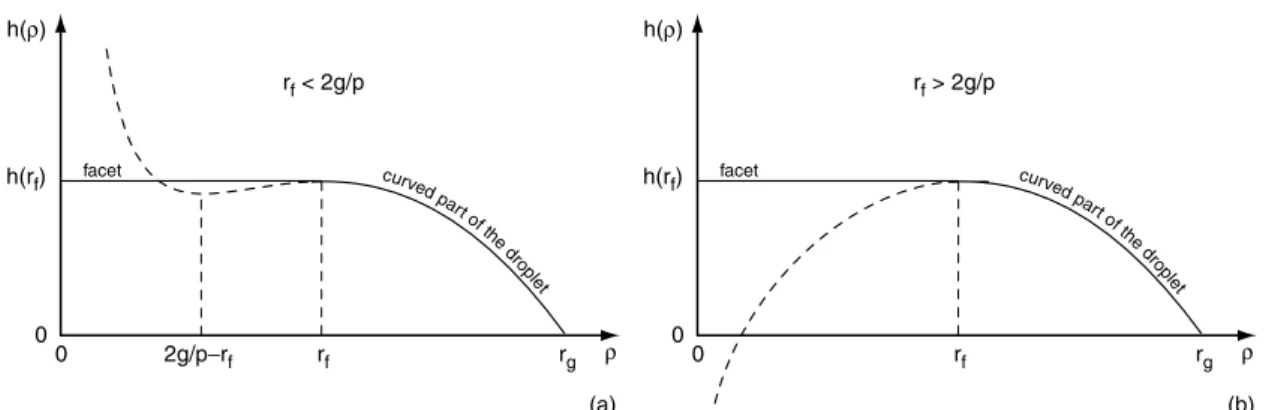
Another remark concerns the droplet profile h(ρ) given by equation (5) when we impose cf = 0. Indeed, this
func-tion has two extrema given by ρ1= rf and ρ2= 2g/p − rf
(Fig. 3). It can be easily checked that the profile is physi-cally acceptable if ρ2 < ρ1, i.e. if rf ≥ g/p. We will show
in Section 4 that this condition is indeed fulfilled experi-mentally.
Let us now minimize eo as a function of the two radii
rf and rg. Note that in the expression (7a) of eo, p is also
curve d part o f the dro plet h(ρ) ρ rf rg 2g/p−rf 0 0 facet h(rf) curve d part o f the dro plet h(ρ) ρ rf rg rf > 2g/p rf < 2g/p 0 0 facet h(rf) (a) (b)
Fig. 3.Typical plots of the function h(ρ) when g/p < rf < 2g/p (a) and rf > 2g/p (b). In both cases, the dashed part of the
curve has no physical meaning.
volume: V = πr2fh¡rf¢ + 2π Z rg rf ρh(ρ)dρ = πr3 g 24 (1 − k) 2¡3pr g(1 + k)2− 4g(2 + k) ¢ (9) with k = rf/rg. As a consequence, minimization with
re-spect to rf reads: ∂eo ∂rf +∂eo ∂p ∂p ∂rf = 0. (10)
This equation has two simple solutions:
rf = g p or rf = Ed b∆P (11a) and rf = 2g p or rf= 2Ed b∆P , (11b) where the pressure p is given by equation (9) as a function of V and rg.
Minimization of eo with respect to rg reads similarly
∂eo ∂rg +∂eo ∂p ∂p ∂rg = 0. (12)
This equation may be expressed as a function of k using Mathematica. For the first solution (11a), it reads explicitly (1+k) Ã −1+3k−4k2 +k4 +k5 +4sµ k g ¶2 (1+k) ! = 8k4 ln k, (13a)
while for solution (11b), k has a simple expression, k = g
g +√s. (13b) In conclusion, the energy eohas two extrema which are
given (for a droplet of a given volume V ) by equations (9,
200 202 204 206 208 0.2 0.3 1.130 1.131 1.132 k rg (µm) eo (10−3 erg) minimum saddle point
Fig. 4. 3D plot of the droplet energy eo as a function of k =
rf/rgand rg. The saddle point and the absolute minimum are
indicated by two arrows (8CB, T = 24◦C, V = 10−6cm3
).
11a), and (13a) and by equations (9, 11b), and (13b), respectively.
The problem that now arises is to determine the nature of these two solutions. To answer this question, we plotted the energy eoas a function of rf and rg, or equivalently as
a function of k and rg. An example is shown in Figure 4
for a droplet of volume V = 10−6cm3and typical values of
the material parameters (corresponding to the liquid crys-tal 8CB at T = 24◦C): γ = 31 erg/cm3
[25], g = 0.073 [26] and s = 0.0304 (this value corresponds to a wetting angle θ of 10◦ in the nematic phase, knowing that in that case
s = 2(1−cos θ)). This plot shows that the energy possesses a saddle point corresponding to the first solution (11a) and a true minimum corresponding to the second solu-tion (11b). As a consequence, solusolu-tion (11b) gives the equi-librium configuration, whereas solution (11a) is unstable. This graph also shows that there is a valley joining these two solutions. More precisely, for each value of k lying be-tween g/(prg) and 2g/(prg), the energy passes through a
minimum as a function of rg. The question we tackle in
the next section is to determine whether these intermedi-ate solutions are accessible experimentally and observable over long time (which would suggest they are metastable).
4 On the metastability of faceted droplets
To answer this question, the global method developed in the previous sections is not adequate. A more local ap-proach is necessary. In this respect, let us consider the local mechanical equilibrium of the layers at the free sur-face. At radius ρ, this equation reads:
∆P − σ = γC, (14a) where C is the local curvature of the surface and σ the elastic stress normal to the layers. Expressing C as a func-tion of h(ρ) gives in the curved part of the droplet:
∆P = −γ1ρdρd ¹ ρdh dρ º + σ. (14b)
By comparing equation (4) with equation (14b), we obtain the following equation, valid in the curved part of the droplet:
σ¡ρ > rf¢ =
Ed
bρ . (15)
This equation expresses the mechanical equilibrium of the dislocations inside the droplet. Indeed, σ(ρ)b is the Peach and Koehler force acting on the dislocation of radius ρ, while Ed/ρ is the line tension force. These two forces
equi-librate, the former tending to grow the dislocation whereas the latter tends to shrink it.
Under the facet, which is flat, equation (14) becomes σ¡ρ < rf¢ = ∆P. (16)
As a consequence, the stress is generally different from each side of the facet edge. Note that a similar situa-tion exists in a free-standing smectic film surrounded by a straight meniscus. In that case, σ = ∆P in the film, whereas σ = 0 in the meniscus [11, 24].
Let us now compare the stress from each side of the facet edge. According to equations (15) and (16), we have:
σ³ρ = r+ f ´ = σ+ = Ed brf (17a) whereas σ³ρ = r−f´= σ− = ∆P. (17b)
These two equations show that σ+ = σ− at r f =
Ed/(b∆P ). This radius corresponds to the saddle point
of the total energy eo, i.e. to the solution given by
equa-tions (11a) and (13a). In the following, we will denote by rcthis particular solution. We immediately see from
equa-tion (17) that if rf < rc, then σ−< σ+. As a consequence
the dislocation which borders the facet collapses and the facet grows. For that reason, rc corresponds to the critical
radius of the facet.
Let now consider a droplet with a facet of radius rf >
rc. In this particular case, σ−> σ+. As a consequence the
dislocation bordering the facet will not collapse, except if
the thermal fluctuations (i.e., the external medium) brings enough energy to overcome the energy barrier
W−= Z rc rf µ Ed ρ − ∆P b ¶ 2πρdρ = 2πb∆P Z rc rf (rc− ρ)dρ = πb∆P (rf− rc)2. (18) In practice, W−
À kBT as long as the facet radius is
a bit larger than the critical radius. To fix ideas, let us consider the example of Figure 4 which would correspond to a droplet of 8CB at 24◦C of volume V = 10−6cm3and
external radius rg ≈ 204 µm: in that case, we calculate
rc = 32 µm, ∆P ≈ 730 dyn/cm2, which gives W− ≈ 7 ×
10−13erg ≈ 80k
BT for a facet radius rf = 1.02rc.
This simple calculation shows that, in practice, the facet radius which is measured experimentally after cool-ing down the droplet from the high-temperature phase must be very close to the critical radius.
One can also calculate the typical time a droplet needs to reach its new configuration when the temperature is decreased. Indeed, let us consider a droplet with a facet radius larger than the critical radius. The dislocation close to the facet is unstable and tends to collapse. Indeed, it experiences three forces: the inward force −Ed/ρ
associ-ated with the line tension Ed and two outward forces, the
Peach and Koehler force of amplitude ∆P b and a frictional one, proportional to the dislocation velocity and of expres-sion −(b/m)(dρ/dt), where m is dislocation mobility [11]. Equating these three forces, we have
b m dρ dt = ∆P b − Ed ρ = ∆P b µ 1 −rρc ¶ . (19) As expected, this equation states that the innermost dis-location collapses as rf is smaller than rc. Its collapse time
can be calculated from this equation (for the calculation, see [11], p. 450) and reads:
τcoll= rc m∆P · ln µ 1 1−x ¶ −x ¸ = τ · ln µ 1 1−x ¶ −x ¸ . (20) In this expression, x = rf/rc < 1 and τ = rc/(m∆P )
fixes the time scale. In 8CB, m is of the order of 3 × 10⁻⁷cm2sg−1 at 24◦C [11]. For a droplet of typical
vol-ume V = 10−6cm3
, we calculated in the previous para-graph rc ≈ 32 µm and ∆P ≈ 730 dyn/cm2, which yields
τ = 15 s. This time fixes the typical equilibration time of the droplet (for x = 0.98, τcoll≈ 3τ). We emphasize that
the latter is certainly much shorter in the experiments cited in references [19, 20] because the droplets studied had smaller volumes (so that rc was smaller and ∆P larger)
and the temperature was higher (4O8 and 8OCB melt at higher temperatures than 8CB). We thus expect the dislocation mobility m be larger than 3 × 10⁻⁷cm2sg−1
in these materials, inasmuch as this quantity is thermally activated and strongly increases when the temperature in-creases [11].
This calculation thus explains why the droplets rapidly reach their critical radii when the temperature is de-creased.
8×10⁻² 6 4 2 0 h / r g * 1.0 0.8 0.6 0.4 0.2 0.0 rg /rg* 33.4 33 31 28 23
Fig. 5. Four normalized profiles calculated at four different temperatures for the liquid crystal 8CB. The temperature is given beside each profile. An arrow marks the edge of the facet on each profile. At 33.4◦C, the droplet has the shape of a
spherical cap.
In the following section, we show the temperature evo-lution of the droplet profile when rf = rc in the vicinity
of a second-order nematic-smectic A phase transition.
5 Evolution of the droplet profile and of the
facet radius at decreasing temperature (i.e.,
when r
f= r
c)
In order to find the droplet profile at the critical radius, we need to solve the set of equations (9, 11a), and (13a). More precisely, equation (13a) gives k. Then, we calculate prg=
g/k from equation (11a), which gives after substitution into equation (9): V = πr 3 g 24 g(1 − k) 2 ¡3(1 + k)2 /k − 4(2 + k)¢. (21) This equation allows us to calculate rg for a given volume
V . As for the droplet profile, it is given by equation (5) by taking cf = 0.
In practice, the shapes are self-similar, so it is prefer-able to use as unit length the radius r∗
g of the droplet in
the nematic phase. The droplet is then at equilibrium and has the shape of a spherical cap with a contact angle at the substrate given by the Young equation: s = 2(1 − cos θ). As for its volume, it may be simply obtained by making k → 0 in equations (13a) and (21). We successively ob-tain g/k = 2√s and V = (πr∗3 g /8)(g/k), from which we calculate r∗ g = µ 4V π√s ¶1/3 . (22)
Figure 5 shows five profiles (normalized to r∗ g)
calcu-lated for the liquid crystal 8CB at four different tem-peratures: T = TN A = 33.4◦C (transition temperature,
spherical cap), T = 33◦C, T = 31◦C, T = 28◦C, and
T = 23◦C. As expected, the droplet height decreases due
34 32 33 30 28 26 24 25 27 29 31 23 0.175 0.150 0.125 0.100 0.075 0.050 0.025 0.000 rc / r* g Temperature (°C) TNA
Fig. 6.Normalized critical radius as a function of the temper-ature calculated for the liquid crystal 8CB.
6 5 4 3 2 1 0 height ( µ m) 60 50 40 30 20 10 0 radius (µm) 6 5 4 3 2 1 0 height ( µ m) 60 50 40 30 20 10 0 radius (µm) fit to eq. 5 facet edge facet edge
fit to a power law (a)
(b)
Fig. 7. a) Experimental profile (crosses) determined from the photograph shown in Figure 1. The solid line is the best fit to equation (5) with cf = 0. The arrow marks the facet edge
given by the fit. The latter is pretty far from the last fringe de-tected experimentally. This shows all the difficulty to measure the facet radius (the top of the droplet is very flat). b) Same experimental data fitted to a power law. The size of the facet is found a bit larger than using the previous fit and the profile exponent is ν = 2.1.
to the rapid collapse of the inner dislocations and rg
in-creases when the temperature dein-creases.
Figure 6 shows the normalized critical facet radius rc as a function of temperature. The latter vanishes
at the transition temperature, in agreement with ex-periments [19, 20]. Note that all the calculations were
performed using Ed/b = 0.84(33.4 − T )0.446 (in CGS
unit) [26] and by assuming that b, γ, and s are independent of the temperature (b = 30 ˚A, γ = 31 erg/cm2 [25], and
s = 0.0304, which corresponds to a contact angle θ = 10◦
when the droplet has a spherical shape).
To conclude this section, let us compare these pre-dictions with experiments. Figure 1 shows a droplet of 8CB deposited on a glass plate treated with a silane for homeotropic anchoring. The photograph was taken at 30◦C by John Bechhoefer in 1991 using a Michelson
in-terferometer. In this picture, the fringes give a contour map with λ/2 ≈ 273 nm separating each fringe. An exper-imental profile obtained by detecting the positions of the fringes along a diameter is shown in Figure 7a (crosses).
This profile was fitted to equation (5) (with cf = 0) by
using Ed/(bγ), ∆P/(2γ), and the radius of the facet rf as
fit parameters (with the droplet radius rg being known).
We found that the fit is excellent over the whole profile. The values of the fit parameters obtained from Igor Pro are Ed/(bγ) = 0.035, ∆P/(2γ) = 34 cm−1, and rf = 5 µm
(for a droplet radius rg = 64 µm), which gives Ed ≈
3.2 × 10⁻⁷dyn for 8CB at 30◦C. This value is in
reason-able agreement with that calculated from formula Ed/b =
0.84(33.4 − T )0.446 given in reference [26] (which gives
Ed ≈ 4.3 × 10⁻⁷dyn). This point is important to justify
the model. In addition, it must be emphasized that the fit of the curved part of the droplet gives also the value of the critical radius. Indeed, according to equation (11a), rc =
Ed/(b∆P ), which yields by using the fit parameters: rc =
0.035/(2×34) cm ≈ 5.1 µm. We thus conclude that for the droplet shown in Figure 1, rf = rcwithin experimental
er-rors. This is direct evidence that we measure the critical radius instead of the true equilibrium radius, when mea-surements are performed after cooling down the droplet.
For comparison, we fitted the same data with a power law of type h(ρ) = hf − $(ρ − rf)ν. As shown in
Fig-ure 7b, the fit is as good as with equation (5) and gives hf = 5.1 µm, $ = 25 (in CGS units), rf = 5.8 µm and
ν = 2.09. We note that the facet size obtained this way is comparable with that found by using equation (5) (5.8 µm instead of 5.1 µm). As for the exponent ν, it is found close to 2 (the same value was measured in 8OCB and 4O8 close to the nematic-smectic A transition temperature [19, 20]). Within the framework of the TLK model, such a value of ν suggests that the droplet is not at equilibrium, but at its critical radius [2, 19]. From this point of view, the two models lead to the same conclusion.
We nevertheless prefer the present model because it is now well established from experiments on free-standing films (for a review, see Chapt. 8 in Ref. [11]) that disloca-tions are strongly repulsed from the free surface in smectic A liquid crystals. In addition, this model applies along the whole profile by construction, contrary to the TLK model, which is only valid in the vicinal regime (i.e., close to the facet where steps are well separated).
6 Facet radius and profile evolution at
increasing temperature
Let us now consider a droplet at low temperature obtained after decreasing the temperature from the nematic phase. We have shown that its facet radius is given by equa-tion (11a), which corresponds to the critical radius rc. In
the following we denote by hf the height of the droplet at
this temperature.
The delicate problem we would like to tackle in this section is the following: what happens if the temperature is again increased. The droplet is then out of equilibrium since its profile no longer satisfies the equilibrium equa-tion (4). So its shape must slowly change (slowly, because any deformation of the profile implies a redistribution of the dislocations, which is strongly dissipative).
To fix ideas, let us start from the profile shown in Fig-ure 5 at Ti = 23◦C and suppose we increase the
temper-ature of the droplet up to Tf = 33◦C. Will the droplet
recover the shape shown in Figure 5 at this temperature? To reach again the final state described in Figure 5, dislocation loops must nucleate since the droplet height must increase. But the nucleation of a dislocation loop imposes to overcome an energy barrier of height
W+ = Z rc 0 µ Ed ρ − ∆P b ¶ 2πρdρ = 2πb∆P Z rc 0 (rc− ρ)dρ = πb∆P rc2. (23)
A rapid numerical estimate shows that W+is always much
larger than kBT in experiments, so nucleation is
forbid-den. The direct consequence is that the droplet cannot recover its initial shape.
This conclusion (the same was drawn in Ref. [19] from the TLK model) is in apparent contradiction with exper-iments. Indeed, experiments show that the shape of the droplet changes when the temperature is raised. More pre-cisely, the facet radius slowly decreases for finally stabi-lizing after many hours (or even days) at a value that is a bit larger than that corresponding to the critical radius at the final temperature (given by Eq. (11a) and plotted in Fig. 6).
To raise the contradiction, let us study how the droplet shape evolves when the temperature is increased, with the additional constraint that its total height hf
can-not change. According to equation (5), this last condition reads hf = grg(k − 1 − ln k) − p 2r 2 g µ k2 − 1 2 − k 2 ln k ¶ , (24)
where p is given by equation (9) as a function of the total volume V of the droplet (or, equivalently, as a function of r∗
g, the droplet radius in the nematic phase, see Eq. (20)).
Replacing p by its expression in equation (24) leads to a third-degree equation in rg which can be solved
ana-lytically using Mathematica. This procedure allows us to express rgas a function of V (or rg∗), hf, and k. The next
decreas ing tem pe rature 0.175 0.150 0.125 0.100 0.075 0.050 0.025 0.000 rf / r* g increasingtemperatu re 34 32 33 30 28 26 24 25 27 29 31 23 Temperature (°C) TNA rc rc→
Fig. 8.Radius of the facet as a function of the temperature at increasing temperature (solid line, curve r↑
c). For comparison,
we reported the critical radius as a function of the temperature (dashed line, curve rc).
6 4 2 0 1.0 0.8 0.6 0.4 0.2 0.0 rg/ rg* 33.4 33 31 23 23 31 33 8×10⁻² h / r *g
Fig. 9.Evolution of the droplet profile when the temperature is increased. The temperature is indicated beside each profile and an arrow marks the edge of the facet. Although the droplet height does not change, the facet radius decreases. Because the volume is conserved, the droplet radius increases. The dashed line corresponds to the droplet profile in the nematic phase (spherical cap).
step is to replace rg and p by their respective expressions
in equation (7a). We thus obtain a new expression for the droplet energy eo(k, s, g, r∗g, hf) at fixed height. The final
step consists of finding the extrema of this function as a function of k. For each temperature T , this function has two extrema, the first one (at small k) corresponding to the critical radius (with the droplet being marginally sta-ble) and the other (at large k) corresponding to a new “equilibrium” shape (it being agreed that hf has been
fixed).
The question now is to determine which of these two solutions the system chooses. At the beginning, the droplet is marginally stable (and, so, fairly far from its real equilibrium shape). So we propose as an ansatz that the droplet remains on this solution branch, i.e. it evolves while remaining marginally stable. Using this criterion, we can calculate the new shape of the droplet at the
fi-Fig. 10.Grandjean terraces separated by giant dislocations in a big droplet. Only a small part of the droplet is visible in this photograph taken in natural light (from Ref. [27]).
nal temperature. Figure 8 shows the new facet radius r↑ c
calculated this way. As expected, and in agreement with experiments, r↑
c > rc. Another prediction (which has not
been checked experimentally) is that the droplet radius rg must slightly increase, because the droplet approaches
a spherical cap. This is visible on the profiles shown in Figure 9. Finally, this model predicts that the radius of curvature measured at the top of the droplet jumps at the transition temperature toward the nematic phase. This point would merit to be checked experimentally.
In conclusion, this approach of the problem could ex-plain why the facet radius slowly decreases when the tem-perature is raised, in spite of the fact that no new dis-locations nucleate. In the following section, we treat the problem of the stability of a droplet with respect to the formation of giant dislocations.
7 Stability with respect to the formation of
giant dislocations
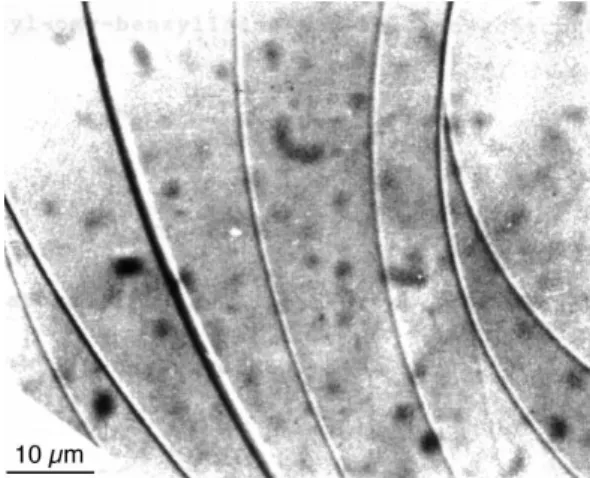
It was known for a long time that big droplets form Grand-jean terraces [28]. The latter are separated by giant dislo-cations of very large Burgers vectors (many tens or even hundreds of layers) in the thick parts of the droplets. Such dislocations are shown in Figure 10.
This phenomenon is due to the tendency of the el-ementary dislocations to group together to reduce their core energy. Indeed, their elastic energy is proportional to their Burgers vector b (and not to b2
as in usual solids) [11, 29], a property that was checked experimentally only re-cently in films [30]. Thus, grouping n dislocations must be energetically favourable (at least in an infinite medium) because we do not change the total elastic energy, but we reduce the core energy (one core, or rather two, instead of n, if one considers the model shown in Fig. 11). This property was used to explain the grouping of dislocations in the menisci bordering free films [31] (in that case the two surfaces are free).
b
+π −π
Fig. 11. Giant dislocation. The core is decomposed into a pair of (±π)-wedge disclination lines. These two lines have a singular core. This model was first proposed by Williams and Kl´eman [32].
In this section, we analyze by using the same method as in reference [31] in which conditions the dislocations group together in a smectic droplet. For the reasons explained before, we shall assume that the facet radius is equal to the critical radius and that the droplet profile is still given by equation (5) with cf= 0.
Let us now consider a set of n elementary dislocations taken in the radius interval ρ ∈ [δ − d/2, δ + d/2] (with rf < δ < rg and d ¿ rg). The posed question is to
de-termine in which condition it becomes preferable to group these n dislocations to form a giant dislocation of Burgers vector nb at the mean distance δ from the droplet cen-tre. To answer this question, let us determine the energy difference between the two possible configurations.
In the case of n elementary dislocations, the energy Eed of the circular droplet slice of width d reads:
Eed= 2πδ Ã nEd+ γ £h0(δ)¤2 2 d ! . (25)
The first term represents the energy of the n elemen-tary dislocations and the second the increase of surface energy due to the free surface inclination (with h0(δ) =
(dh(ρ)/dρ)ρ=δ). Because nb ≈ −h0(δ)d, the parameter d
can be eliminated from equation (25) which becomes: Eed= 2πδn ³ Ed− γ 2bh 0(δ)´. (26)
For a giant dislocation of Burgers vector nb with the core structure described in Figure 11, the energy can be written in the form
Egd = 2πδ ( 2Ec+ nb√KB 2 + πK 2 ln n + Bλn 2b2 8p2πλh(δ) h 2A +¡1 + A2/3¢3/2i ) . (27)
In this expression, 2Ec represents the core energy of the
+π and −π disclinations (in the following, we shall take 2Ec ≈ Ed). The second term corresponds to the elastic
self-energy of the giant dislocation. The third term gives the curvature energy of the layers associated with the +π
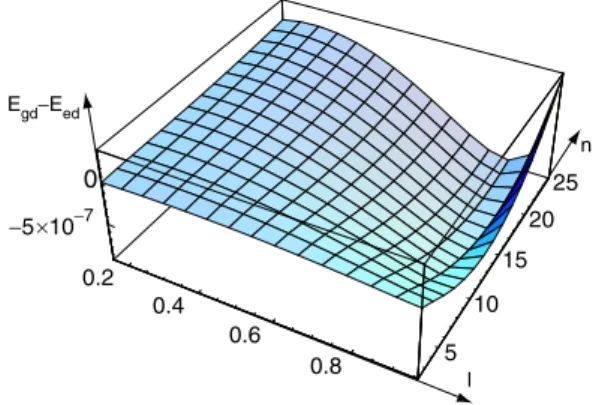
0.8 5 10 15 20 25 −5 10−7 0 0.2 0.4 0.6 × Egd−Eed l n
Fig. 12.Plot of the difference energy Egd−Eedas a function of
n and l = δ/rg calculated for 8CB at T = 24◦C. In this graph,
lmin≈ 0.39 and nmin≈ 14, while lopt≈ 0.87 and nopt≈ 16.
disclination. Finally, the last term corresponds to the elas-tic interaction energy between the giant dislocation and, both, the solid substrate and the free surface (for more details, see Ref. [22]). We recall that K and B are, respec-tively, the curvature and the compressibility moduli of the layers, λ =pK/B is the so-called penetration length, and A = (γ −√KB)/(γ +√KB) is a constant.
The next step is to compare the energy of the giant dis-location with the energy of the n elementary disdis-locations. We thus need to calculate Egd− Eed as a function of the
free parameters n and δ. This difference reads, according to equations (25) and (27), Egd− Eed= 2πδ ( (1 − n)Ed− n γ 2bh 0(δ) +nb √ KB 2π +πK 2 ln n + Bλn2b2 8p2πλh(δ) h 2A +¡1 + A2/3¢3/2i ) , (28)
where h(δ) and its derivative h0(δ) can be calculated from
equations (5) and (11a) (in the critical regime). Introduc-ing the ratio l = δ/rg (with k < l < 1), we calculate from
these two equations h(δ)¯ ¯δ=lr g = g 4k£1 + 4k(l − 1) − l 2 − 2k2ln l¤rg (28a) and h0(δ)¯ ¯ δ=lrg = − g(k − l)2 2kl . (28b) Finally, we can express the energy difference Egd− Eedas
a function of n and l for each temperature T and droplet radius rg, knowing that Ed(dyn) = 2.52 × 10⁻⁷(33.4 −
T )0.446 [26], B(erg/cm3
) ≈ 0.665 × 10⁸
(33.4 − T )0.328,
λ(cm) ≈ 8.92 × 10⁻⁸(33.4 − T )−0.13 and K = Bλ2
≈ 7 × 10⁻⁷dyn [11, 31]. The function E
gd− Eedis plotted in
Figure 12 by taking T = 24◦C and r
g= 300 µm.
This graph shows that Egd− Eed is positive at small
values of l, but can become negative above some mini-mum value of l denoted by lmin. At the distance lminrg
from the centre of the droplet, a giant dislocation of well-defined Burgers vector nmin (here, we measure the
120 100 80 60 40 20 0 nopt, nmin 0.5 0.4 0.3 0.2 0.1 rg (cm) T = 33.2°C nopt nmin 1.0 0.8 0.6 0.4 0.2 0.0 lopt , l min 0.5 0.4 0.3 0.2 0.1 rg (cm) T = 24°C lmin lopt rg* (lmin = k) 80 60 40 20 0 nopt, nmin 0.5 0.4 0.3 0.2 0.1 rg (cm) rg* T = 24°C nmin nopt (lmin = k) 1.0 0.8 0.6 0.4 0.2 0.0 lopt , lmin 0.5 0.4 0.3 0.2 0.1 rg (cm) lopt lmin T = 33.2°C k = 0.0353 (a) (b) (c) (d)
Fig. 13.a), b) Dimensionless distances loptand lminas a function of the droplet size rgcalculated at two different temperatures;
c), d) Burgers vectors (in number of layers) noptand nminof the giant dislocations as a function of the droplet size rg calculated
for the same temperatures as in a) and b). Solid lines (respectively, dashed lines) are best fits to the numerical data of the type r0.5
g (respectively, r 0.3 g ).
because it becomes energetically favourable. The quantity Egd− Eed has also an absolute minimum for some
opti-mal values nopt and lopt of n and l. These quantities are
plotted comparatively as a function of the droplet size rg
in Figure 13 at T = 24◦C and T = 33.2◦C (i.e., 0.2◦C
below TN A= 33.4◦C), respectively.
We immediately note that loptis constant in the large
range of radii explored (20 µm < rg< 5 mm) and is
quasi-independent of the temperature chosen (lopt ≈ 0.87 at
T = 24◦C and l
opt≈ 0.89 at T = 33.2◦C, Figs. 13a and
b). This result shows that giant dislocations preferentially form close to the outer edge of the droplets. As for nopt,
it increases both with the temperature (at given radius) and with the droplet radius (at given temperature) as r1/2g
(Figs. 13c and d). By contrast, lmin decreases when rg
in-creases, but the decrease is faster at low temperature than at high temperature (Figs. 13a and b). In addition, we note that lminreaches its minimal possible value k for a droplet
radius r∗
g ≈ 3 mm at T = 24◦C (Fig. 13a). This particular
radius rapidly increases when the temperature increases and becomes so large close to the transition temperature that it does make sense to speak about it. In the same time, nminincreases with temperature (at a given radius)
and with droplet radius as r0.3
g (at a given temperature)
(Figs. 13a and b).
To summarize, giant dislocations form preferentially in the outer part of the droplet. Their Burgers vectors in-crease when the temperature inin-creases in spite of the fact
that the curved part of the droplet surface adjacent to the facet is more stable at high temperature than at low tem-perature. For that reason, the whole droplet destabilizes only at low temperature if it is big enough (i.e., if rg > r∗g).
8 Concluding remarks
Our calculations lead to the conclusion that it is almost impossible to observe a droplet at equilibrium. Neverthe-less, the shapes observed after cooling down small droplets from the nematic or the isotropic phase must be repro-ducible and self-similar, with a facet radius very close to the critical radius. This result reposes on the fact that the dislocation loops of smaller radius than rc are
unsta-ble and, thus, rapidly collapse. This is clearly the case in small droplets in which the elastic force acting on disloca-tions (proportional to the overpressure ∆P ) is large, being inversely proportional to rg. On the contrary, shapes
ob-served after a temperature increase change very slowly in time. In that case, the droplet height is blocked (the nu-cleation of new dislocations is forbidden), which does not prevent the facet from slowly decreasing in size. Our feel-ing is that the droplet evolves while remainfeel-ing marginally stable. In that case, the final facet size must be larger than rc, in agreement with experiments [19].
The problem is more complicated with big droplets because of the local formation of giant dislocations. The latter can form spontaneously at different places, resulting
Fig. 14. Three-dimensional view of a droplet of the chiral liquid crystal XI/12 obtained by taping mode atomic force mi-croscopy. The droplet has been deposited in the smectic A phase at high temperature (about 100◦C) and then slowly
cooled down to the room temperature in the SmC∗phase (from
Ref. [33]).
in various metastable shapes. This is perhaps one of the reasons why it was so difficult to observe faceted shapes with big droplets [19, 20]. Another problem could come from wetting hysteresis. Indeed, we have implicitly as-sumed that the droplet radius can change easily in order to minimize the total energy, which excludes any hysteretic effects of the contact angle on the substrate. This is far from being the case in experiments, where hysteresis al-ways exists. This can be a serious problem especially with big droplets in which the driving forces (inversely propor-tional to r2
g) are weak.
Finally, the model predicts that the curved part of the droplet matches tangentially the facet, on condition that the equilibrium equation (4) (which generalizes the Laplace equation) is globally satisfied. In that case, the profile is given by equation (5) with cf = 0 whatever the
facet radius (always larger than the critical radius). The tangential matching is due to the fact that the dislocations repulse each other to reduce the excess of free surface en-ergy. Indeed, the term in γ in equation (2) may be seen as a repulsive interaction term between the dislocations.
For this reason, the model cannot explain the angular matching observed in certain droplets of the liquid crystal 4O8 close to the smectic B phase transition [20]. In that case, which remains an exception, it is not excluded that the elastic constants K and B increase in such a way that the surface tension γ becomes smaller than√KB. The dis-locations should then glide to the surface to form steps [22, 23] and the TLK model would become applicable. The explanation given in reference [21] based on finite-size ef-fects and attractive elastic interactions between steps of the same sign via the solid substrate is thus perhaps the solution to this intriguing problem.
Let us still mention interesting unpublished observa-tions by H. Dumoulin and P. Pieranski of smectic C∗
droplets of a very viscous liquid crystal deposited on mica.
An example is shown in Figure 14. This image was ob-tained by using Taping Mode Atomic Force Microscopy. In this droplet, the matching between the facet and the curved part of the surface is clearly angular (with an an-gle of 4.5◦[33]). This result is very surprising because the
elastic modulus B is usually smaller in SmC (or SmC∗)
than in SmA due to the tilt of the molecules inside the layers [34]. For that reason, dislocations must be repelled from the free surface and our model should apply. One pos-sibility for explaining the angle would be that the droplet has been “photographed” during the collapse of the upper dislocations, and so is strongly out of equilibrium. This is very possible inasmuch as steps are still visible on one side of the facet. In addition, the droplet is surrounded by a terrace of molecular height, which indicates that the liq-uid crystal wets mica and that the droplet is spreading (at least at high temperature). Thus, new and more controlled experiments are clearly necessary before to conclude about the existence or the non-existence of an angular matching at equilibrium in this material.
Finally, we emphasize that our model should apply as well to lamellar phases of diblock copolymers (like PS-PBMA). Indeed, the dislocations are strongly repulsed from the free surfaces in these systems, as was shown experimentally by electron microscopy [35]. Nevertheless, the radio rf/rg must be smaller in copolymers than in
usual smectic A because of the smallness of the ratio Ed/b ≈
√
KB (of the order of 1 dyn/cm [36]). As a con-sequence, facets should be more difficult to observe in copolymers than in usual smectic A.
L.L. would like to express his thanks for hospitality of the Ecole Normale Sup´erieure of Lyon, where this work was done.
References
1. G. Wulff, Z. Kristallogr. 34, 449 (1901).
2. P. Nozi`eres, Shape and growth of crystals, in Solid Far From Equilibrium, Beg Rohu Lectures, edited by C. Go-dreche (Cambridge University Press, Cambridge, 1992). 3. J.C. Heyraud, J.J. M´etois, J.M. Bermond, J. Cryst.
Growth 98, 355 (1989).
4. J.M. Bermond, J.J. M´etois, J.C. Heyraud, Surf. Sci. 416, 430 (1998).
5. M.S. Hoogeman, M.A.J. Klik, D.C. Schlosser, L. Kuipers, J.W.M. Krenken, Surf. Sci. 448, 142 (2000).
6. S. Balibar, H. Alles, A.Ya. Parshin, Rev. Mod. Phys. 77, 317 (2005).
7. P. Pieranski, R. Barbet-Massin, P.E. Cladis, Phys. Rev. A 31, 3912 (1985).
8. H. Stegemeyer, Th. Bl¨umel, K. Hiltrop, H. Onusseit, F. Porsch, Liq. Cryst. 1, 3 (1986).
9. P. Oswald, P. Pieranski, Nematic and Cholesteric Liquid Crystals: Concepts and Physical Properties Illustrated by Experiments, The Liquid Crystal Book Series (Taylor & Francis, 2005).
10. P. Oswald, F. Melo, C. Germain, J. Phys. (Paris) 50, 3527 (1989).
11. P. Oswald, P. Pieranski, Smectic and Columnar Liquid Crystals: Concepts and Physical Properties Illustrated by Experiments, The Liquid Crystal Book Series (Taylor & Francis, 2005).
12. P. Pieranski, P. Sotta, D. Rohe, M. Imperor-Clerc, Phys. Rev. Lett. 84, 2409 (2000).
13. P. Pieranski, L. Sittler, P. Sotta, M. Imperor-Clerc, Eur. J. Phys. E 5, 317 (2001).
14. P. Pieranski, M. Bouchih, N. Ginestet, S. Popa-Nita, Eur. J. Phys. E 12, 239 (2003).
15. P. Nozi`eres, F. Pistolesi, S. Balibar, Eur. Phys. J. B 24, 387 (2001).
16. J.D. Bernal, D. Crowfoot, Trans. Faraday Soc. 29, 1032 (1933).
17. S. Chandrasekhar, Mol. Cryst. 2, 71 (1966).
18. S. Chandrasekhar, N.V. Madhusudana, Acta Crystallogr., Sect. A 26, 153 (1970).
19. J. Bechhoefer, P. Oswald, Europhys. Lett. 15, 521 (1991). 20. J. Bechhoefer, L. Lejˇcek, P. Oswald, J. Phys. II 2, 27
(1992).
21. L. Lejˇcek, J. Bechhoefer, P. Oswald, J. Phys. II 2, 1511 (1992).
22. L. Lejˇcek, P. Oswald, J. Phys. II 1, 931 (1991).
23. This is due to the fact that the step energy per unit length, of the order of γb (with γ the surface tension), is typically 3 to 10 times larger than the dislocation energy, of the order of√KBb (where K and B are, respectively, the curvature constant and the compressibility modulus of the layers). As a consequence, the dislocations are both repulsed by
the solid and the free surfaces and place roughly at mid-distance between them (more precisely, at mid-distance h/(1 + A3/2) from the solid surface [22], by denoting by h the local
droplet thickness and by setting A = (γ −√KB)/(γ + √
KB)).
24. J.-C. G´eminard, R. Holyst, P. Oswald, Phys. Rev. Lett. 78, 1924 (1997).
25. R. Jaquet, F. Schneider, Phys. Rev. E 67, 021707 (2003). 26. A. Zywocinski, F. Picano, P. Oswald, J.C. G´eminard,
Phys. Rev. E 62, 8133 (2000).
27. C. Williams, D´efauts de structure dans les smectiques A, D.Sc. Thesis, University of Paris XI, Orsay (1976). 28. F. Grandjean, Bull. Soc. Fr. Min´eral. 39, 164 (1916). 29. M. Kl´eman, J. Phys. (Paris) 35, 595 (1974).
30. J.C. G´eminard, C. Laroche, P. Oswald, Phys. Rev. E 58, 5923 (1998).
31. F. Picano, R. Holyst, P. Oswald, Phys. Rev. E 62, 3747 (2000).
32. C.E. Williams, M. Kl´eman, J. Phys. (Paris) Colloq. 36, C1-315 (1976).
33. H. Dumoulin, Etude d’interfaces de cristaux liquides par microscopie de proximit´e, PhD Thesis, University of Paris XI, Orsay (1996).
34. S. Shibahara, J. Yamamoto, Y. Takanishi, K. Ishikawa, H. Takezoe, J. Phys. Soc. Jpn. 71, 802 (2002).
35. M. Maaloum, D. Ausserr´e, D. Chatenay, G. Coulon, Y. Gallot, Phys. Rev. Lett. 68, 1575 (1992).
36. M.S. Turner, M. Maaloum, D. Ausserr´e, J.-F. Joanny, M. Kunz, J. Phys. II 4, 689 (1994).