Forests 2019, 10, 1096; doi:10.3390/f10121096 www.mdpi.com/journal/forests
Article
Estimation of Fungal Diversity and Identification of
Major Abiotic Drivers Influencing Fungal Richness
and Communities in Northern Temperate and Boreal
Quebec Forests
Genevieve Laperriere 1,2, Pierre-Luc Chagnon 3, Roxanne Giguère-Tremblay 2,4, Amélie Morneault 2,4,
Danny Bisson 5, Vincent Maire 2,4 and Hugo Germain 1,2,*
1 Département de Chimie, Biochimie et Physique, Université du Québec à Trois-Rivières, Trois-Rivières, QC G8Z 4M3, Canada; laperriere.genevieve@gmail.com
2 Groupe de Recherche en Biologie Végétale (GRBV), Université du Québec à Trois-Rivières, Trois-Rivières, QC G8Z 4M3, Canada; roxanne.giguere-tremblay@uqtr.ca (R.G.-T.); amelie.mo@outlook.com (A.M.); vincent.maire@uqtr.ca (V.M.)
3 Institut de Recherche en Biologie Végétale (IRBV) et Département de Sciences Biologiques, Université de Montréal, Montréal, QC H3T 1J4, Canada; pierre-luc.chagnon@umontreal.ca
4 Département des Sciences de L’environnement, Université du Québec à Trois-Rivières, Trois-Rivières, QC G8Z 4M3, Canada
5 Progigraph Inc., Val d’Or, QC J9P 1S2, Canada; progigraph.vd@hotmail.com
* Correspondence: hugo.germain@uqtr.ca
Received: 29 October 2019; Accepted: 29 November 2019; Published: 2 December 2019
Abstract: Fungi play important roles in forest ecosystems and understanding fungal diversity is
crucial to address essential questions about species conservation and ecosystems management. Changes in fungal diversity can have severe impacts on ecosystem functionality. Unfortunately, little is known about fungal diversity in northern temperate and boreal forests, and we have yet to understand how abiotic variables shape fungal richness and composition. Our objectives were to make an overview of the fungal richness and the community composition in the region and identify their major abiotic drivers. We sampled 262 stands across the northern temperate and boreal Quebec forest located in the region of Abitibi-Témiscamingue, Mauricie, and Haute-Mauricie. At each site, we characterized fungal composition using Illumina sequencing, as well as several potential abiotic drivers (e.g., humus thickness, soil pH, vegetation cover, etc.). We tested effects of abiotic drivers on species richness using generalized linear models, while difference in fungal composition between stands was analyzed with permutational multivariate analysis of variance and beta-diversity partitioning analyses. Fungi from the order Agaricales,
Helotiales, and Russulales were the most frequent and sites from the north of Abitibi-Témiscamingue
showed the highest OTUs (Operational Taxonomic Unit) richness. Stand age and moss cover were the best predictors of fungal richness. On the other hand, the strongest drivers of fungal community structure were soil pH, average cumulative precipitation, and stand age, although much of community variance was left unexplained in our models. Overall, our regional metacommunity was characterized by high turnover rate, even when rare OTUs were removed. This may indicate strong environmental filtering by several unmeasured abiotic filters, or stronger than expected dispersal limitations in soil fungal communities. Our results show how difficult it can be to predict fungal community assembly even with high replication and efforts to include several biologically relevant explanatory variables.
Keywords: fungal diversity; temperate-boreal forests; illumina sequencing; fungal community;
1. Introduction
Fungi represents the most diverse groups on Earth after insects [1]. They are diverse in terms of shape, color, and lifestyle and they are distributed throughout the globe in all types of terrestrial and aquatic ecosystems, and even in extreme life conditions such as those prevailing in the Antarctic [2,3]. They play pivotal roles in ecosystem functioning by modulating nutrient cycling, organic matter decomposition, carbon storage, and plant nutrition through the formation of mutualistic symbiosis [4–7]. Several studies have shown that ecosystems functionality is altered when changes occur in soil fungal diversity [5,6] which is why they are used as a forest and soil health bioindicator [8,9]. In addition some species, especially edibles, are an important source of income and a significant component of the diet, particularly in developing countries and remote regions [10]. Unfortunately, fungal diversity can change because of time, climate, biota, topography, natural disturbance, or human caused perturbation and contamination [11–14]. For these reasons, there is interest in developing approaches to predict various facets of fungal diversity, and how it is likely to change over space and time in natural and managed ecosystems.
Fungal species richness, an intuitive component of fungal diversity, is often used to compare habitats, as species diversity is often assumed to reflect, at least partly, niche diversity when limiting similarity drive species coexistence [15]. Fungal richness has also been linked to key ecosystem parameters and functions such as litter decomposition rates [16] or soil and plant nutrient content [7]. Many abiotic variables can influence species richness. In the case of fungi, climatic variables such as mean annual precipitation and temperature are important drivers of fungal richness at global scale [17], but other variables such as vegetation cover [18], tree species [19], and soil texture [20] can have positive or negative impacts on richness.
Beyond the simple counting of species number (i.e., α-diversity), another way to characterize biodiversity is to study the composition of the community and how it changes across sites (i.e., β-diversity). Understanding compositional pattern of species helps researchers to understand different aspects of species interaction and ecosystem function [21,22]. β-diversity patterns can also guide conservation practices, for example by providing knowledge about the uniqueness of community composition in the landcapse [23]. Community dissimilarity can stem from two mutually exclusive, and thus additive, components: richness difference (i.e., nestedness) and compositional turnover/replacement [21]. Because these components are additive fractions of community β-diversity, they can easily be mapped in a ternary plot linking nestedness, turnover, and community similarity (i.e., 1-β) [22]. Such β-diversity partitioning analyses can help formulate more specific hypotheses regarding the potential drivers of community dissimilarity in a metacommunity [24].
Nevertheless, in Quebec, Canada, fungal diversity in northern temperate and boreal forests is generally poorly described. A reliable and exhaustive global description of the fungal diversity is needed for the protection and conservation of fungal species, and to further predict changes in fungal richness and community composition in our forests. This lack of data represents an obstacle for mycologist and for companies working with natural resources, and data is needed to improve forest fungal biodiversity conservation and management. The main aim of this study was to sample the northern temperate and boreal Quebec forests; to (1) make an overview of the fungal richness and the community composition; and (2) identify the main environmental drivers of these facets of fungal biodiversity.
2. Materials and Methods 2.1. Study Sites and Soil Sampling
The sampling design consisted of 262 sites that were located in three different regions in the province of Quebec (Canada). The sites were divided in 130 stands located in Abitibi-Témiscamingue (AT), 50 stands in Haute-Mauricie (HM), and 82 stands in Mauricie (MAU) (Figure 1). We used a forest inventory database composed of 75 abiotic variables and 33,000 stands, released in 2009, through the Ministry of Forest and Parks of the province of Quebec. This database
served to identify and locate sites according to four ecological parameters used by stakeholders: the stand age, the dominant tree species, the level of drainage, and the surficial deposit. We selected sites to obtain the largest diversity of ecological parameters combinations that characterized each region. Sites also had to be accessible by road. Sites were sampled between June and September 2017.
For each site, we used ropes to delimitate a representative area of 400 m2 (20 × 20m). In each site, two
20 m transects were established 10 m apart from one another. The forest litter was removed from the surface and 6 soil cores of 20 cm depth were collected every 5m along the transects. Soil samples were pooled, mixed and a subsample was taken for DNA analyses and stored immediately on ice and at −20 °C at the end of the day. The rest of the soil samples were sieved and stored at different temperature depending of the future analyses (see below).
Figure 1. GPS localization of the 262 sampled sites divided in three regions representing 130 sites in
Abitibi-Témiscamingue (AT), 50 sites in Haute-Mauricie (HM) and 82 sites in Mauricie (MAU). The map represents the province of Québec and each yellow triangle represents a site sampled between June and September 2017.
2.2. Clustering of Sites into Climatic Domains
Using georeferenced information of the 249 stands (positive at sequencing step), we extracted historical climatic data ranging from 1974 to 2008, from the site of the government of Canada (https://ouvert.canada.ca) (Table S1). Total degree-days (based on 0, 5, and 10 °C), mean length of the season without frost (T min ≤ 0, −1, −2, −3, and −4 °C), mean length of the growing season, average cumulative precipitation during the growing season, and the mean temperature during the growing season (calculated with the total degree-days based on 0 divided by the length of the growing season) were used for K-means clustering with kmeans function and cluster package in R software v.3.5.3 [25,26]. This resulted in three climatic domains distributed as follows: 70 sites, mostly localized at the north of Abitibi-Témiscamingue (exception of four sites in Haute-Mauricie and two in south of Abitibi), were grouped in domain 1 (NAT), domain 2 (MAU) contained 79 sites situated
in Mauricie and domain 3 (SAT-HM) included 100 sites from the south of Abitibi-Témiscamingue (exception of five sites at the north) and Haute-Mauricie (Figure S1).
2.3. Site Characterization
We used forest inventory databases (see above) to get information about stand age, dominant tree species, level of drainage and surficial deposit (Table S1). In addition, we measured in the representative area a series of variables that are known to modulate fungi presence [27–29]. For the vegetation stratum (trees, shrubs (diameter at breast height (DBH) <9 cm), herbaceous, mosses, and lichens), the coverage percentage (between 0% to 100%) values were attributed for each stratum at
each end of the 400 m2 area. Then, means were calculated and density cover classes was assigned
according to the protocol of Ministère des Forêts du Québec, Service des Inventaires Forestiers [30]. For the statistical analysis, the density classes were changed to an ordinal scale between 0 and 7 ((81%–100%) = 7, (61%–80%) = 6, (41%–60%) = 5, (26%–40%) = 4, (6%–25%) = 3, (2%–5%) = 2, (1%) = 1, 0 = 0). Thickness of the litter layer was represented by plant residues on the surface of the soil (dead leaves, needles, and living mosses) and thickness of humus by the organic layer in the soil (represented by the horizon F and H). Both were measured in centimeter (cm).
2.4. Soil Analyses
Part of the soil sample from each site was dried at room temperature to measure pH (hydrogen potential) and Eh (redox potential) with the method proposed by Husson et al. [31]. Measurements were made using platinum M241Pt electrodes and a 10Mhoms resistance multimeter inside a Faraday cage. The measure was considered stable after 30 s. Because Eh and pH are strongly correlated values, Eh was standardized for a pH of 7 based on Equation (1) where the Eh is measure in volts, R the perfect gas constant (8.314471 JK−1 mol−1), F the Faraday constant (96485.3383 C mol−1),
and T the temperature (Kelvin):
EhpH7 = Eh-RT/F*Ln10*(7-pH) (1)
Temperature and pH were taken with a pH electrode (HI 1292D HANNA) immediately after the Eh. Organic matter (OM) was measured by mass loss ignition (550 °C during 5 h). After heating, the soil was analyzed for texture using a Fritsch Analysette 22 microtech plus to get the content (%) of silt, sand, and clay.
2.5. Soil DNA Extraction, Amplification, and Sequencing
Soil for DNA was kept frozen in −20 °C until extraction and then DNA from 0.30 g of soil was extracted with the DNeasy PowerSoil kit (Qiagen, Montreal, QC, Canada) according to the
manufacturer’s instructions. 200 µL of 100 µM ammonium aluminium sulfate (AlNH4(SO4)2) was
added, as an additional step, in the column to remove inhibitors such as humic acid and increase PCR efficiency on several types of soil (clayey, sandy) [32]. DNA was eluted in 100 µl. PCR reactions were performed in a volume of 25 µL containing 2.5 µL of 10 × standard Taq buffer (100 mM
Tris-HCl, 500 mM KCl, 15 mM MgCl2), 0.5 µL of dNTPs (10 mM), 0.5 µL of primers (20 mM), 0.25 µL
of standard Taq DNA polymerase, 2 µL of total soil DNA and 18.75 µL of nuclease free water. We amplified the ITS2 region with the universal fungal primers fITS7 and ITS4 with a CS1 (ACACTGACGACATGGTTCTACA) and CS2 (TACGGTAGCAGAGACTTGGTCT) tag added at the 5′ extremities [33,34]. Three different melting temperatures were used for each PCR reaction with the following thermocycling conditions: 34 cycles of 30 s at 94 °C, 30 s at three different melting temperatures of 48, 51, and 58°C, and 1 min 30 s at 72 °C. Reactions were preceded by a 3 min denaturation step at 94 °C and terminated with a 5 min elongation step at 72 °C. If no PCR band was obtained, a 1/10 dilution of the total soil DNA was prepared. Positive PCR from the same sites (3 PCR × 256 sites) were pooled and sent for sequencing. A second PCR was done to add adapters and barcodes (one barcode per site), libraries were quantified and the sequencing was performed with Illumina MiSeq PE 300 following the procedures of Quebec Genome Innovation Center of McGill University (Montreal, QC, Canada).
2.6. Bioinformatic Analysis
Raw sequences were demultiplexed and adapters and barcodes were removed for 249 sites (7 samples didn’t work at sequencing). The sequences were uploaded to the Galaxy web platform v.1.1.2-806.1 and analyzed for quality using the FastQC Read Quality reports v.0.72 [35,36]. Then sequences were filtered and trimmed (trimleft = c (19, 20), truncLen = c (230, 200), maxN = 0, maxEE = c (2, 2), minLen = 150) using dada2 package v. 1.7.9 in R [26,37]. Only sequences longer than 150 bp with a mean number of expected errors below 2 were kept, trimming these to keep only the first 230 bp for the forward reads and the 200 bp for the reverse reads. Paired-ends sequences were merged using Fastq-join (pN = 0, mN = 20) in the Galaxy web platform [38]. Then Fastq files were converted in Fasta files with FASTX-toolkit v.1.0.2 and ID sequences were changed for the unique number ID of the sites using Seqkit v 0.8.0 [39,40]. The open source software ITSx v. 1.1.1 was used to remove conserved regions (5.8S and 28S) may be present in our ITS2 amplicon [41]. Finally, dereplication procedure for each site was independently (sample level) applied using Vsearch v. 2.8.0 and then all files (249 files corresponding to 249 sites) were combined in one single Fasta file in order to obtain one OTU data file and compare fungal composition between all sites [42]. Then, the dereplication procedure was repeated, but across all sequences. We removed singletons (minuniquesize = 2) chimera sequences using the reference database (UNITE/UCHIME reference datasets v.7.2) and de novo chimeras, and we clustered sequences (id = 0.97) and performed taxonomic assignation (id = 0.98) with our local barcode database containing 169 barcodes from fungi collected in Canada (mostly in Quebec province) (Document file S1) and public reference databases (USEARCH/UTAX reference datasets v.7.2 from UNITE and 600,000 ITS2 sequences download from the National Center for Biotechnology Information Search database (https://www.ncbi.nlm.nih.gov/)) using Vsearch v. 2.8.0. Non fungal OTUs were removed.
2.7. Statistical Analysis
We obtained two databases, one with the abiotic variables for each site and the one with presence/absence OTUs by site. All statistical analyses were coded in R [26]. Taxa frequency bar chart was created using ggplot2 [43]. To identify major abiotic drivers, we correlated fungal occurrences in 240 sites (we excluded 9 sites with missing environmental variables) with 18 abiotic variables from these sites (Table S1). Percentage of sand was not used because of high correlation with clay and silt content. Mean temperature during the growing season and average cumulative precipitation during the growing season were used as climatic variable for each sites. Other climatic data were excluded from the statistical analyses because of high colinearity. Continuous numerical variables were standardized prior to analysis. Generalize linear model with negative binomial family error distribution was used to identify the drivers of fungal OTU richness, using the MASS and MuMIn R packages for model selection based on dredge and importance functions [44,45]. A pairwise site dissimilarity matrix based on Jaccard’s index was computed for 240 sites keeping only 14 000 OTUs appearing in these 240 sites. A PERMANOVA analysis using the adonis2 function (vegan R package) was used to explain our fungal distance/dissimilarity matrix using our set of 18 abiotic variables [46]. Prior to running the PERMANOVA analysis, we verified the assumption of multivariate dispersion using the function betadisper (vegan R package) [46]. To verify the homogeneity of variance for the continuous predictors, we quantified the distance of each sample in the ordination to the overall metacommunity-wide centroid, and correlated this value to the continuous variable. Principal coordinate analysis (PCoA) was used to visualize fungal community composition among sites. Beta-diversity partitioning analyses were used to evaluate whether shifts in fungal community structure were mostly due to species replacement or differences in fungal richness among sites using the beta.div.comp function (coef = “J”) from Legendre (2014) [21]. This beta-diversity partitioning could be visualized on a ternary plot using the R package Ternary [47]. Species indicator analysis was used to determine whether some species were preferentially associated with specific site characteristics [48].
3. Results
3.1. Taxonomic Diversity
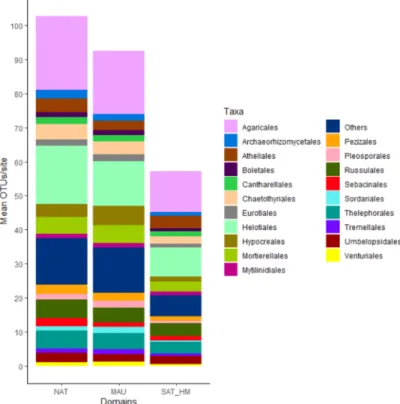
Illumina sequencing of our fungal amplicon resulted in 12,455,757 raw sequences which was pruned to 264,000 unique reads after bioinformatics treatment. Clustering at 97% yielded 14,755 OTUs (6687 singletons), out of which 4796 could be assigned to a known taxon. We merged OTUs (and their frequencies) if they received the same taxonomic assignation and removed OTUs that were assigned to non-fungal organism for a total of 252 removed OTUs. For the 249 sites, 14,503 OTUs, including 4544 OTUs with taxonomic assignation, were obtained. Figure 2 presents a global view of the taxonomic diversity, the 20 most frequent orders for all the sites and their frequency is represented for each climatic domain. The Agaricales represented the most frequent order with a mean of 22 OTUs per site for the bioclimatic domain NAT, 19 OTUs for domain MAU and 12 OTUs for domain SAT-HM. The second and third most frequent order were respectively the Helotiales and the Russulales with 17 and 6 mean OTUs per site for domain NAT, 13 and 4 OTUs for domain MAU and 9 and 4 OTUs for domain SAT-HM. Other common orders were Cantharellales, Boletales, and
Hypocreales (Figure 2).
Figure 2. Taxa bar-chart for each climatic domain representing the frequency of the 20 most frequent
fungal orders. In the X axis, NAT represents the sites clustered in the north of Abitibi-Témiscamingue, MAU in Mauricie, and SAT_HM in the south of Abitibi-Témiscamingue and in Haute-Mauricie. Y axis represents the mean OTUs (Operational Taxonomic Unit)/site. Each different color represents taxa.
3.2. Fungal Richness
OTUs richness varied between 26 to 825 OTUs across the sites with a mean of 193 OTUs per site. Lower OTUs richness was observed in domain SAT-HM compared with domain NAT and MAU (Figure 3). We could also observe a tendency of OTUs richness to decrease in presence of higher moss cover and in older stand age but, to increase with high herb cover (Figure 4A–C). OTUs richness also varied depending on the dominant tree species. Intolerant hardwood (IH) stands showed high fungal richness as opposed to jack pine stands (JP) (Figure 4D).
A generalized linear model was used first, with all the habitat variables, and used in dredge to performed model selection and model averaging. The dredge function generated a set of 262,144 possible combinations (Table S2). Model at the first rank (lowest AICc) included the variables stand age, average precipitation, herb cover, moss cover, soil pH and silt content, but all first six models were equivalent in weight and for Akaike’s information criteria (AICc). Variables that were not included in all the first six models were deposit, drainage, EhpH7, litter, organic matter, and shrub cover. These variables also have low sum of Akaike weights, meaning they appeared in few models (Figure 5). The moss cover and the stand age stood out as the most important predictors of fungal OTUs richness with a sum of Akaike weights close to one (appeared in almost all the models) (Figure 5). Herb cover, average precipitation, silt content and lichen cover could also important predictors of fungal richness with a sum of Akaike weights over 0.5, indicating that they appeared in half of the possible models (Figure 5).
Figure 3. Box-plot indicating the distribution of the OTUs richness (249 sites) for each climatic
domain. In the X axis, NAT represents the stands clustered in the north of Abitibi-Témiscamingue, MAU in Mauricie and SAT_HM in the south of Abitibi-Témiscamingue and in Haute-Mauricie. The Y axis represents the OTUs richness (number of OTUs/site).
(c) (d)
Figure 4. Box-plot representing the distribution of the OTUs richness (240 sites), depending on: (a)
moss cover; (b) stand age; (c) herbaceous cover; (d) dominant tree species. For (a) and (c) X axis represents the density classes ((81%–100%) = 7, (61%–80%) = 6, (41%–60%) = 5, (26%–40%) = 4, (6%– 25%) = 3, (2%–5%) = 2, (1%) = 1, 0 = 0)). For (b) X axis indicates stand age (1 = 20–79 years and 2 = 80 years and over). For (d) X axis indicates the different dominant tree species in the sites (BF = Balsam fir, BS = Black spruce, IH = Intolerant hardwood, JP = Jack pine, P_JP = Jack pine plantation, P_MC = Mixed coniferous plantation, RM = Red maple, TA = Trembling aspen, WB = White birch, and WS = White spruce). Y axis represents the OTUs richness (number of OTUs/site).
Figure 5. Bar-chart representing the importance of each of the 18 habitat variables from all possible
model combinations (262,144). Y axis represents the sum of Akaike weights. 3.3. Fungal Community Composition
Soil pH has a significant effect on fungal composition, followed by the average cumulative precipitation and stand age (Table 1 and Figure 6). For stand age, older stand (blue) seemed slightly nested into those from younger stand (red) (Figure 6C). The multivariate dispersion analysis indicated that the assumption of variance homogeneity was violated for stand age (F = 3.68, p = 0.06) (Document file S2). However, given the robustness of the PERMANOVA test to this assumption, this should not translate as a major bias in our downstream analyses [49]. For the continuous variables, no statistically significant correlations with their distance to the centroid were found for soil pH and average precipitation, the two best predictors (Document file S2 and Figure S2).
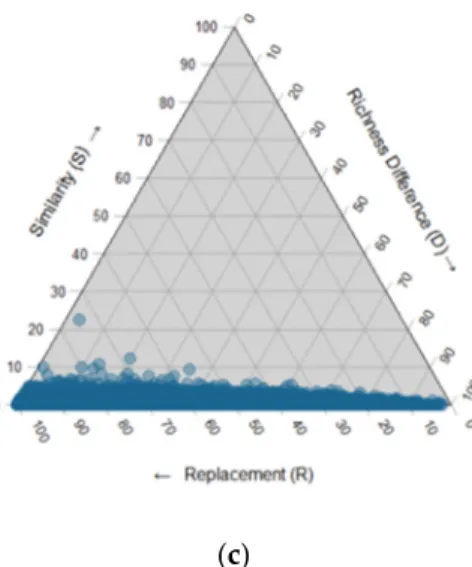
We analyzed the fungal community structure with a simplex analysis of beta-diversity partitioning from pairwise comparisons of stands by using different indices that measure similarity (number of share species), relativized richness difference and relativized species replacement according to the R-script methods of Legendre et al. (2014) [21]. Values obtained were positioned into an equilateral triangle, the so-called ternary plot. High species turnover, perfect nestedness, and richness identity could be easily recognized because the points are positioned on a given side of the triangle. This analysis shows an alignment of the majority of the pairwise site comparison at the bottom of the ternary plot, which evidences species replacement as the major driver of community dissimilarity in this regional metacommunity (Figure 7A). This could be due to a very high frequency of rare taxa, which could have inflated the turnover component of beta-diversity. Yet, a similar pattern of strong turnover was observed even when only the most frequent fungi (appearing in more than 30 sites) were retained for the analysis (Figure 7B). Likewise, the pattern held constant when considering only the rarer fungal taxa (Figure 7C).
Table 1. Results of the PERMANOVA for the global fungal community. Stars indicate the p value
significance *** p < 0.001; ** p < 0.01; * p < 0.05.
Variables R2 F Pr (>F)
Dominant tree species 0.040 1.123 ***
Deposit 0.021 1.072 ** Drainage 0.004 1.038 Stand age 0.005 1.301 *** Tree (%) 0.004 1.018 Shrub (%) 0.004 1.011 Herb (%) 0.004 1.090 Moss (%) 0.004 1.179 ** Lichen (%) 0.004 1.229 ** Litter (cm) 0.004 1.060 Humus (cm) 0.004 1.018 pH 0.006 1.589 *** EhpH7 0.004 1.055 * Organic matter (%) 0.004 1.183 ** Clay content (%) 0.005 1.245 *** Silt content (%) 0.004 1.098 * Mean temperature 0.005 1.189 ** Average precipitation 0.006 1.385 *** Residual 0.840
(a)
(c)
Figure 6. Sites scores for principal coordinate analysis (PCoA) with presence/absence data for 14 000 OTUs
(dissimilarity matrix based on Jaccard’s index) and 240 sites. Each point in the PCoA represents a site and points close to one another indicate that they are similar in their fungal composition. Values in brackets on the axes show the amount of variation in fungal composition explained by each axis; (a) Sites colored according to their soil pH values (range between 2.98 to 7.10). Color represents a gradient from low (red) to high (blue) soil pH; (b) Sites colored by their average cumulative precipitation (range between 489.36 mm to 638.03 mm). Color represents a gradient from low (green) to high (blue) average precipitation; (c) Sites colored by their stand age. Young stand (20–79 years) are colored in red and old stand (80 years and more) in blue.
(c)
Figure 7. Triangular plot representing a beta-diversity partitioning analysis with presence/absence
data with 14,000 OTUs and 240 sites: (a) including the total OTUs (14,000); (b) only the OTUs appearing in more than 30 sites; (c) rarer OTUs appearing in less than 10 sites. Each blue point represents a pair of sites and their position is determined by three indices, the relativized species replacement (R), the relativized richness difference (D) and similarity (S) (dissimilarity matrix based on Jaccard’s index) calculated from the R code script from Legendre (2014), values on the axis represents the contribution in percentage of each indices.
4. Discussion
4.1. Fungal Diversity in Temperate and Boreal Quebec Forest
Diversity in the regional species pool could be explained by the large environmental heterogeneity across our sampled sites and the sequencing depth used. Indeed, our study gathered data on highly contrasted sites differing in dominant tree species, geological substrate origin, drainage, climate, and abiotic soil parameters (Table S1). Many studies and reviews have supported the role of environmental heterogeneity in supporting greater species diversity through niche partitioning [50–52]. A study published by Tedersoo et al. (2014) also reported very large fungal richness; they sampled 365 sites across the world divided in eleven different biomes (not limited to boreal and temperate forest) and detected 44,563 nonsingleton fungal OTUs that corresponded to approximately half of the described fungal species on the globe [17]. They also observed that boreal and temperate forests were also more diverse in ectomycorrhizal and several other fungal guilds than other biomes. The three most frequent orders that characterized our regions were the Agaricales,
Helotiales, and Russulales (Figure 2). These three groups are generally dominant in boreal forest
[11,53–55]. The genus Lactarius and Russula, from the order Russulales, are abundant and diverse ectomycorrhizal fungi in northern forests, especially because there are host generalists [14,56,57]. In our data, the genus Russula and Lactarius represented 84% of the OTUs from the Russulales (Table S3). Helotiales are common and frequently associated with roots in boreal forest [11,54], whereas the
Agaricales are known to associate with bryophytes a dominant component of the boreal forest
understory [58]. Agaricales and Russulales are also known to be abundant and diverse in temperate forests [59–63], which represented 32% of sites included in our study. In temperate forests, Agaricales are mostly represented by the genus Cortinarius and Inocybe [60,63]. Cortinarius genus represented 24% and Inocybe 14% of our OTUs belonging to the Agaricales (Table S3).
Soil was collected from June to September, which included a sampling done over two seasons (summer and beginning of fall). Fungal groups do not seem to change between season, although their abundance may change [64,65]. Active mycelium can decrease at the soil surface in the middle of summer, because of drought, but remains detectable [66]. Season should not have an impact on the global biodiversity retrieved. Unknown OTUs also represented a large proportion of the fungal
diversity in our study, which was comparable to other studies using similar high-throughput sequencing methodologies [11,17,67,68]. Despite all the progress in fungal DNA barcoding, most of the fungal species in the world remains unknown for many reasons. Some species are not easily identifiable, difficult or impossible to growth in vitro, they are only represented by only one discovered specimen and in some case it is truly the first encounter [69,70].
4.2. Abiotic Drivers of Fungal Richness
We found that predictors of the fungal richness were the stand age and the moss cover. The first ranked model included the variables stand age, average precipitation, herb cover, moss cover, soil pH and silt content, but all first six models were equivalent in weight and for Akaike’s information criteria (AICc) (Table S2). Among these variables stand age and moss cover come out as the most important predictors of fungal OTUs richness (Figure 5).
For moss cover, a decrease of OTUs richness was observed when the moss cover was higher (Figure 4A). Fungi living in moss covered stand, would have considerable potential to degrade carbon substrates contained in moss residues and in peatlands [71]. Mosses are well known to be recalcitrant substrates and they can affect conditions growth by maintaining high water level and slowing down the nutrient cycle [72]. They also produce secondary metabolites which would make them difficult to digest for most decomposers [73]. Only a few specialist fungi would be able to decompose moss tissues [74,75]. This could explain a lower fungal richness compared to other type of stands.
In addition to moss cover, stand age come out as an important predictor (Figure 5). A decline of OTUs richness was observed in our older stand (Figure 4B). A general trend, observed in animals and plants, is the colonization of young stand, normally newly exposed, by opportunistic species followed by an increase of species richness [76,77]. In the case of fungi, generally mature coniferous forests can support a larger number of fungal species and provide a higher fungal richness [78,79]. Blaalid et al. (2012) also observed for root-associated fungi a high fungal richness in the recently exposed area (young stand), followed by a decrease to finish with an increase of richness in more established ecosystems [80]. In these studies, only one fungal guild (mycorrhizal fungi) was taken into account. In our case the total fungal composition was measured and as such included several fungal groups. Another study compared the presence of several fungal groups over three successional forest stages (2 years, 65 years, and 110 years) and they detected fewer different groups of fungi (species richness) in the older forest than in the young and intermediate forest taken together [81]. In our data, old forests are more than 80 years old (Table S1). Such a high richness in early successional stands contrasts with other findings in western Canada where fungal richness increased over time after clearcuts or fires [82]. Early-successional stands may have increased primary productivity and also potentially higher plant diversity and theses two factors can determine the diversity of soil fungal guilds [83]. Mature forest may not be able to support a large diversity of fungi because of loss and changes in nutrient and plant species. Forest productivity will reach a plateau around 40 years old for most of the tree species [84,85]. After the maximum growth, we can observe a decrease of the primary production, photosynthesis, nutrients, and an increase of dead woods [86].
Other predictors appeared in more than half of all possible models as herbaceous cover, lichen cover, average precipitation, and silt content (Figure 5). In the case of herbaceous cover, an increase in OTUs richness was observed with higher herb cover (Figure 4C). Tedersoo et al. (2016), identified that fungal richness was positively affected by herb cover [18]. Several groups of root-inhabiting fungi are related to herbaceous plants and a majority of herbaceous plants are dependent on mycorrhizae to survive especially in phosphorus poor soil [87,88]. Higher density of herbaceous cover could provide more colonizable roots for fungi and results in a higher fungal richness [89]. For lichen cover, no information was found to explain how lichen cover can directly affect fungal richness. In our study, we evaluated cover from macrolichen living on the soil surface. One explanation would be that the type of stand where there is high abundance of lichen is not favorable for fungi. Lichen can grow on several extreme environments: on dry and hot environments, on bare
rock, walls, gravestones, roof, exposed soil surfaces, etc. In our study, high lichen cover (covering more than 40% of the area) was found in stand plantation dominated by jack pine. Pine stand is known to have lower fungal richness because of forest litter that could be more acid [18,19,90]. Tree species can differentially influence fungal richness, either because of their partner selectivity or because of the local soil conditions they create [19,90]. We can see this variation in OTUs richness depending on the dominant tree species in our sites, with especially low richness under jack pine stands (Figure 4D).
One edaphic factor that appeared to be important predictor is silt content, with an importance over 0.50 and was included in the lowest AICc model (Table S2 and Figure 5). Fungal response to soil texture has been found elsewhere [91]. Higher global fungal richness was previously observed in fine-textured soils [20]. A reason for that may be the higher propension of fine particles to be bound within aggregates. It is well known that aggregates formation can create microenvironments for soil microbes and create refuges from predators (e.g., collembolas) in inaccessible micropores [92], but also protection for desiccation [93], heat [94], and pH fluctuation [95]. Such creation of microenvironments may have favored fungal niche partitioning locally, thus potentially increasing richness [96]. Providing more isolate microhabitat demonstrated an increase in microbial species richness [97].
Average cumulative precipitation during the growing season was also an important predictor (Table S2 and Figure 5). Tedersoo et al. (2014), previously identified mean annual precipitation as a strongest predictor with a positive effect on global fungal diversity [17]. They compared fungal richness between tropical regions and Africa, the latter had a lower fungal richness because mean annual precipitation is relatively lower. Another study noticed that the number of soil fungal taxa increases significantly with increasing mean annual precipitation [98]. An explanation of the role of precipitation on richness would be related to the fact that most of the mesophilic fungi fail to grow at less than 96% humidity. A study from Talley et al. (2002), showed that relative fungal richness increase in presence of high relative humidity (>50%) [99].
4.3. Drivers of Fungal Community Composition
Soil pH was the main driver of fungal community composition (Table 1 and Figure 6A). This is consistent with previous studies showing that soil pH is the primary driver of fungal community composition and it is a main determinant on fungal community composition across the globe [11,17,67,100–102]. Fungi generally grow, without significant inhibition, on a wide pH ranges [103– 105]. However, soil pH could drive fungal composition by changing the abundance of some fungal groups [106], on microorganism diversity [107], and soil nutrients [108]. Acidic soils are characterized by a low cation exchange capacity, particularly in magnesium and calcium, and then cations are not available to organisms, which may act as a strong environmental filter to few adapted and specialized species [109,110]. Soil pH is here confirmed as must be part of the toolkit for modeling the mushroom niche, for conservation and management purposes.
Average precipitation was also identified as important drivers of fungal community composition (Table 1 and Figure 6B). In a previous study, fungi directly responded to variation in precipitation with more abundant, diverse, and consistent communities under drought conditions and more variable communities with an increase in rainfall, but difference in the community composition was more evident when rainfall difference was over 200 mm [111]. For our sites, average cumulative precipitation range was between 489.36 mm to 638.03 mm (Table S1). Fewer sites (blue) were at the opposite of the first PCoA axis corresponding to sites with an average cumulative precipitation over 581 mm (Tables S1 and S4). Over a specific stress threshold, biotic factors such as competition will be more present and determine coexistence [96]. Hawkes et al. (2011) observed increase diversity in dry periods and suggested that drought stress moderates competition among fungal taxa [111]. The species have therefore acclimated to specific precipitation conditions and to a certain level of competition and then specific groups of species should be indicative of some stands depending on precipitation level. A species indicator analysis was used to identify some indicator species between the different levels of precipitation. Fourteen genera were identified as significant
indicators of low average cumulative precipitation and only three as mid average cumulative precipitation, compared to fifty-two for high average cumulative precipitation (Table S5). Species belonging to Inocybe, Trichoderma, and Clitocybe are examples of significant indicators of high average cumulative precipitation (Table S5).
For stand age, old stands (blue) seemed slightly nested compared to those from younger stands (red) (Figure 6C). Stands could be different in community composition, because of some species unique to an age-class [47,112]. We identified two genus as an indicator of old stand (80 years and more), Gloioxanthomyces and Urnula (Table S5). Among all the OTUs, 590 OTUs were only detected in old stand (Tables S1 and S3). Difference in fungal species composition among forest age classes was previously found in several studies. They explained the difference by changes in plant species composition, because plant communities evolves with time [113,114]. Additionally, accumulation of some recalcitrant plant litter is not favorable for the survey of some fungi [115]. One study found that fungal diversity reached a plateau in 26 years-old stand and community composition was similar for stand between 65–100 years, but differ among stand over 100 years-old [82]. Another explanation could be after the maximum growth of a stand, a decrease of the primary production, photosynthesis, nutrients, and an increase of dead woods is observed and then competition to survive could be more present. Models of fungal primary succession showed that few selected species are able to colonize new area and with time they are joined or replace with more competitive species [116,117].
The fungal community structure is however characterized by a high turnover rate across the region (Figure 7). This specifically means that there were no cosmopolitan generalist fungal taxa that were present in the vast majority of our sites. Such a high replacement or turnover of fungal OTUs could reflect either (1) narrow fungal niches and strong environmental filtering [118], (2) strong interspecific competitive exclusion, or (3) historical contingencies with priority effects allowing early colonizers to prevent the establishment of latecomers [21,22,24]. Without additional data, it is impossible to determine in our dataset what the major cause of such a strong species turnover was.
5. Conclusions
A global overview of the fungal diversity and richness was assessed across the northern temperate and boreal Quebec forests. It allowed to localize area with high fungal richness and identified abiotic predictors across the sampled region. This could be used as a tool to follow fungal richness through time and to anticipate future changes that could be damaging to forests. A high moss cover, old stand (over 80 years) and some dominant tree species (pine stands) are not suitable for a high fungal richness contrary to herb cover and average precipitation. The structure of the fungal community in the region was unknown and now is it characterized by a high turnover rate. Fungal composition is shaped by several abiotic drivers, but we identified soil pH, average cumulative precipitation, and stand age as the most important drivers among the sampled variables. This effort to use meta-barcoding will allow a better characterization of fungal biodiversity and community structure from soil samples across various stands in the province of Québec. Collectively, our results show how difficult it can be to predict fungal community assembly even with high replication and efforts to include several biologically relevant explanatory variables: this poses a significant challenge for fungal conservation and biodiversity management in a changing climate, as it seems that suitable fungal niches will be hard to track. The inclusion of functional traits and phylogeny could be a way to better understanding fungal biogeography [119].
Supplementary Materials: The following are available online at www.mdpi.com/xxx/s1, Figure S1. K-means
clustering of 249 sites based on the historical climatic data extracted from the site of the government of Canada using the GPS localization. Group 1 (black) includes 70 sites, mostly localized at the north of Abitibi-Témiscamingue (exception of four sites in Haute-Mauricie and two in south of Abitibi) and represents the domain NAT. Group 2 (red) has 79 sites situated in Mauricie and named domain MAU. Group 3 (green) includes 100 sites from the south of Abitibi-Témiscamingue (exception of five sites at the north) and Haute-Mauricie and represents the domain SAT-HM. Figure S2. Plots representing values from soil pH (a) and (b) average precipitation and in y axis, their distances to the centroid. Document file S1. Local fungal ITS DNA barcode reference; Document file S2. Multivariate dispersion results; Table S1. Environmental database; Table
S2. Dredge results; Table S3. OTU database; Table S4. Ordination scores; Table S5. Results of species
indicators analysis.
Author Contributions: G.L. contributed to the overall process of the experimental design, field sampling,
laboratory manipulations, data analysis and manuscript drafting; P.-L.C. contributed with his expertise, made comments for the community analysis and ecological parts, and helped for R coding and statistical analysis; R.G.-T. participated to field sampling, executed the soil analysis, helped for R coding, and made comments; A.M. participated to field sampling, executed the pH-Eh soil analysis, and made comments; D.B. contributed with his technical support and expertise in geomatics; V.M. contributed with his expertise, made comments for the statistical and ecological parts, participated in field sampling, and contributed to the experimental design; H.G. supervised the project, participated to field sampling, contributed to the experimental design, reviewed the manuscript, made comments, and obtained funding.
Funding: The study was funded by the Conseil de recherches en sciences naturelles et en génie du Canada
(CRSNG) and the Consortium de recherche et innovations en bioprocédés industriels au Québec (CRIBIQ).
Acknowledgments: The authors would like to acknowledge Joelle Rancourt, Isabelle Gosselin, Perrine Juillion
and Ingrid Sanchez for their help during field sampling. We also want to thanks Alexandre Brisson and Mathias Bisaillon for their help during laboratory manipulations.
Conflicts of Interest: The authors declare no conflict of interest.
References
1. Blackwell, M. The Fungi: 1, 2, 3… 5.1 million species? Am. J. Bot. 2011, 98, 426–438.
2. Gessner, M.; Gulis, V.; Kuehn, K.; Chauvet, E.; Suberkropp, K. 17 Fungal Decomposers of Plant Litter in Aquatic Ecosystems. Environ. Microb. Relatsh. 2007, 4, 301.
3. Rosa, L.H.; Vaz, A.B.; Caligiorne, R.B.; Campolina, S.; Rosa, C.A. Endophytic fungi associated with the Antarctic grass Deschampsia antarctica Desv. (Poaceae). Polar Biol. 2009, 32, 161–167.
4. Clemmensen, K.; Bahr, A.; Ovaskainen, O.; Dahlberg, A.; Ekblad, A.; Wallander, H.; Stenlid, J.; Finlay, R.; Wardle, D.; Lindahl, B. Roots and associated fungi drive long-term carbon sequestration in boreal forest. Science 2013, 339, 1615–1618.
5. Delgado-Baquerizo, M.; Maestre, F.T.; Reich, P.B.; Jeffries, T.C.; Gaitan, J.J.; Encinar, D.; Berdugo, M.; Campbell, C.D.; Singh, B.K. Microbial diversity drives multifunctionality in terrestrial ecosystems. Nat. Commun. 2016, 7, 10541.
6. Li, J.; Delgado-Baquerizo, M.; Wang, J.-T.; Hu, H.-W.; Cai, Z.-J.; Zhu, Y.-N.; Singh, B.K. Fungal richness contributes to multifunctionality in boreal forest soil. Soil Biol. Biochem. 2019, 136, 107526.
7. Wagg, C.; Bender, S.F.; Widmer, F.; van der Heijden, M.G. Soil biodiversity and soil community composition determine ecosystem multifunctionality. Proc. Natl. Acad. Sci. USA 2014, 111, 5266–5270. 8. Egli, S. Mycorrhizal mushroom diversity and productivity—an indicator of forest health? Ann. For. Sci.
2011, 68, 81–88.
9. Van Bruggen, A.H.; Semenov, A.M. In search of biological indicators for soil health and disease suppression. Appl. Soil Ecol. 2000, 15, 13–24.
10. Boa, E. Wild Edible Fungi: A Global Overview of Their Use and Importance to People (No. 17); Food & Agriculture Org: Rome, Italy, 2004; p. 157.
11. Day, N.J.; Dunfield, K.E.; Johnstone, J.F.; Mack, M.C.; Turetsky, M.R.; Walker, X.J.; White, A.L.; Baltzer, J.L. Wildfire severity reduces richness and alters composition of soil fungal communities in boreal forests of western Canada. Glob. Chang. Biol. 2019, 25, 2310–2324.
12. Kardol, P.; Cregger, M.A.; Campany, C.E.; Classen, A.T. Soil ecosystem functioning under climate change: Plant species and community effects. Ecology 2010, 91, 767–781.
13. Monkai, J.; Hyde, K.D.; Xu, J.; Mortimer, P.E. Diversity and ecology of soil fungal communities in rubber plantations. Fungal Biol. Rev. 2017, 31, 1–11.
14. Santalahti, M. Fungal Communities in Boreal Forest Soils: The Effect of Disturbances, Seasons and Soil Horizons; Dissertationes Schola Doctoralis Scientiae Circumiectalis, Alimentariae, Biologicae; Universitatis Helsinkiensis: Helsinki, Finland, 2018.
15. Silvertown, J. Plant coexistence and the niche. Trends Ecol. Evol. 2004, 19, 605–611.
16. Štursová, M.; Žifčáková, L.; Leigh, M.B.; Burgess, R.; Baldrian, P. Cellulose utilization in forest litter and soil: Identification of bacterial and fungal decomposers. FEMS Microbiol. Ecol. 2012, 80, 735–746.
17. Tedersoo, L.; Bahram, M.; Põlme, S.; Kõljalg, U.; Yorou, N.S.; Wijesundera, R.; Ruiz, L.V.; Vasco-Palacios, A.M.; Thu, P.Q.; Suija, A. Global diversity and geography of soil fungi. Science 2014, 346, 1256688.
18. Tedersoo, L.; Bahram, M.; Cajthaml, T.; Põlme, S.; Hiiesalu, I.; Anslan, S.; Harend, H.; Buegger, F.; Pritsch, K.; Koricheva, J. Tree diversity and species identity effects on soil fungi, protists and animals are context dependent. ISME J. 2016, 10, 346.
19. Saitta, A.; Anslan, S.; Bahram, M.; Brocca, L.; Tedersoo, L. Tree species identity and diversity drive fungal richness and community composition along an elevational gradient in a Mediterranean ecosystem. Mycorrhiza 2018, 28, 39–47.
20. Hemkemeyer, M.; Christensen, B.T.; Tebbe, C.C.; Hartmann, M. Taxon-specific fungal preference for distinct soil particle size fractions. Eur. J. Soil Biol. 2019, 94, 103103.
21. Legendre, P. Interpreting the replacement and richness difference components of beta diversity. Glob. Ecol. Biogeogr. 2014, 23, 1324–1334.
22. Podani, J.; Schmera, D. A new conceptual and methodological framework for exploring and explaining pattern in presence–absence data. Oikos 2011, 120, 1625–1638.
23. Legendre, P.; De Cáceres, M. Beta diversity as the variance of community data: Dissimilarity coefficients and partitioning. Ecol. Lett. 2013, 16, 951–963.
24. Leprieur, F.; Tedesco, P.A.; Hugueny, B.; Beauchard, O.; Dürr, H.H.; Brosse, S.; Oberdorff, T. Partitioning global patterns of freshwater fish beta diversity reveals contrasting signatures of past climate changes. Ecol. Lett. 2011, 14, 325–334.
25. Maechler, M.; Rousseeuw, P.; Struyf, A.; Hubert, M.; Hornik, K. Cluster: Cluster Analysis Basics and Extensions. R Package Version 2.0. 5; 2016: 2018. Available online: https://www.r-project.org/ (accessed on 29 October 2019).
26. Team, R.C. R: A Language and Environment for Statistical Computing. 2013. Available online: https://www.r-project.org/ (accessed on 29 October 2019).
27. Fallu, J. Évaluation du potentiel de récolte des champignons forestiers comestibles dans les boisés de l’Estrie, Québec. 2004. Available online: http://savoirs.usherbrooke.ca/handle/11143/2345 (accessed on 29 October 2019).
28. Gévry, M.-F. Étude des Facteurs Environnementaux Déterminant la Répartition de Champignons Forestiers Comestibles en Gaspésie, Québec; Université du Québec à Rimouski: Rimouski, QC, Canada, 2010.
29. Rochon, C.; Pare, D.; Khasa, D.P.; Fortin, J.A. Ecology and management of the lobster mushroom in an eastern Canadian jack pine stand. Can. J. For. Res. 2009, 39, 2080–2091, doi:10.1139/X09-118.
30. Saucier, J.; Berger, J.; Davignon, H. Le Point d’observation Écologique: Normes Techniques; Ministère des Forets du Québec, Service des Inventaires Forestiers: Sainte-Foy, QC, Canada, 1994.
31. Husson, O.; Husson, B.; Brunet, A.; Babre, D.; Alary, K.; Sarthou, J.-P.; Charpentier, H.; Durand, M.; Benada, J.; Henry, M. Practical improvements in soil redox potential (Eh) measurement for characterisation of soil properties. Application for comparison of conventional and conservation agriculture cropping systems. Anal. Chim. Acta 2016, 906, 98–109.
32. Dong, D.; Yan, A.; Liu, H.; Zhang, X.; Xu, Y. Removal of humic substances from soil DNA using aluminium sulfate. J. Microbiol. Methods 2006, 66, 217–222, doi:10.1016/j.mimet.2005.11.010.
33. Ihrmark, K.; Bödeker, I.T.; Cruz-Martinez, K.; Friberg, H.; Kubartova, A.; Schenck, J.; Strid, Y.; Stenlid, J.; Brandström-Durling, M.; Clemmensen, K.E. New primers to amplify the fungal ITS2 region–evaluation by 454-sequencing of artificial and natural communities. FEMS Microbiol. Ecol. 2012, 82, 666–677.
34. White, T.J.; Bruns, T.; Lee, S.; Taylor, W.J. Amplification and Direct Sequencing of Fungal Ribosomal RNA Genes for Phylogenetics; Academic Press, Inc.: New York, NY, USA, 1990.
35. Afgan, E.; Baker, D.; Batut, B.; Van Den Beek, M.; Bouvier, D.; Čech, M.; Chilton, J.; Clements, D.; Coraor, N.; Grüning, B.A. The Galaxy platform for accessible, reproducible and collaborative biomedical analyses: 2018 update. Nucleic Acids Res. 2018, 46, W537–W544.
36. Andrews, S. FastQC: A Quality Control Tool for High Throughput Sequence Data. 2010. Available online: https://www.bioinformatics.babraham.ac.uk/projects/fastqc/ (accessed on 29 October 2019 ).
37. Callahan, B.J.; McMurdie, P.J.; Rosen, M.J.; Han, A.W.; Johnson, A.J.A.; Holmes, S.P. DADA2: High-resolution sample inference from Illumina amplicon data. Nat. Methods 2016, 13, 581.
39. Gordon, A.; Hannon, G. FASTQ/A Short-Reads Pre-Processing Tools. 2010. Available online: http://hannonlab.cshl.edu/fastx_toolkit/ (accessed on 29 October 2019).
40. Shen, W.; Le, S.; Li, Y.; Hu, F. SeqKit: A cross-platform and ultrafast toolkit for FASTA/Q file manipulation. PLoS ONE 2016, 11, e0163962.
41. Bengtsson-Palme, J.; Ryberg, M.; Hartmann, M.; Branco, S.; Wang, Z.; Godhe, A.; De Wit, P.; Sanchez-Garcia, M.; Ebersberger, I.; de Sousa, F. Improved software detection and extraction of ITS1 and ITS2 from ribosomal ITS sequences of fungi and other eukaryotes for analysis of environmental sequencing data. Methods Ecol. Evol. 2013, 4, 914–919.
42. Rognes, T.; Flouri, T.; Nichols, B.; Quince, C.; Mahé, F. VSEARCH: A versatile open source tool for metagenomics. PeerJ 2016, 4, e2584.
43. Wickham, H. Elegant Graphics for Data Analysis (ggplot2); Springer: New York, NY, USA, 2009.
44. Venables, W.; Ripley, B.; Isbn, S. Statistics Complements to Modern Applied Statistics with S by W.N. Venables and B.D. Ripley, 4th ed.; Springer: Cham, Switzerland, 2002.
45. Barton, K. MuMIn: Multi-model inference. R package version 0.12. 2/r18. 2009. Available online: http://R-Forge.R-project.org/projects/mumin (accessed on 29 October 2019).
46. Oksanen, J.; Blanchet, F.G.; Kindt, R.; Legendre, P.; O’hara, R.; Simpson, G.L.; Solymos, P.; Stevens, M.H.H.; Wagner, H. Vegan: Community ecology package. R package version 1.17-4. Available online: http://cran.r-project.org (accessed on 29 October 2019).
47. Smith, M. Ternary: An R package to generate ternary plots. Zenodo 2017.
48. Dufrêne, M.; Legendre, P. Species assemblages and indicator species: The need for a flexible asymmetrical approach. Ecol. Monogr. 1997, 67, 345–366.
49. Anderson, M.J.; Walsh, D.C. PERMANOVA, ANOSIM, and the Mantel test in the face of heterogeneous dispersions: What null hypothesis are you testing? Ecol. Monogr. 2013, 83, 557–574.
50. Ricklefs, R.E. Environmental heterogeneity and plant species diversity: A hypothesis. Am. Nat. 1977, 111, 376–381.
51. Shmida, A.; Wilson, M.V. Biological determinants of species diversity. J. Biogeogr. 1985, 12, 1–20.
52. Shorrocks, B.; Sevenster, J.G. Explaining local species diversity. Proc. R. Soc. Lond. Ser. B Biol. Sci. 1995, 260, 305–309.
53. Asemaninejad, A.; Thorn, R.G.; Lindo, Z. Vertical distribution of fungi in hollows and hummocks of boreal peatlands. Fungal Ecol. 2017, 27, 59–68.
54. Clemmensen, K.E.; Finlay, R.D.; Dahlberg, A.; Stenlid, J.; Wardle, D.A.; Lindahl, B.D. Carbon sequestration is related to mycorrhizal fungal community shifts during long‐term succession in boreal forests. New Phytol. 2015, 205, 1525–1536.
55. Männistö, M.; Vuosku, J.; Stark, S.; Saravesi, K.; Suokas, M.; Markkola, A.; Martz, F.; Rautio, P. Bacterial and fungal communities in boreal forest soil are insensitive to changes in snow cover conditions. FEMS Microbiol. Ecol. 2018, 94, fiy123.
56. Geml, J.; Laursen, G.A.; Herriott, I.C.; McFarland, J.M.; Booth, M.G.; Lennon, N.; Chad Nusbaum, H.; Lee Taylor, D. Phylogenetic and ecological analyses of soil and sporocarp DNA sequences reveal high diversity and strong habitat partitioning in the boreal ectomycorrhizal genus Russula (Russulales; Basidiomycota). New Phytol. 2010, 187, 494–507.
57. Mucha, J.; Peay, K.G.; Smith, D.P.; Reich, P.B.; Stefański, A.; Hobbie, S.E. Effect of simulated climate warming on the ectomycorrhizal fungal community of boreal and temperate host species growing near their shared ecotonal range limits. Microb. Ecol. 2018, 75, 348–363.
58. Kauserud, H.; Mathiesen, C.; Ohlson, M. High diversity of fungi associated with living parts of boreal forest bryophytes. Botany 2008, 86, 1326–1333.
59. Brabcová, V.; Nováková, M.; Davidová, A.; Baldrian, P. Dead fungal mycelium in forest soil represents a decomposition hotspot and a habitat for a specific microbial community. New Phytol. 2016, 210, 1369– 1381.
60. Cline, L.C.; Huggins, J.A.; Hobbie, S.E.; Kennedy, P.G. Organic nitrogen addition suppresses fungal richness and alters community composition in temperate forest soils. Soil Biol. Biochem. 2018, 125, 222–230. 61. Goldmann, K.; Schöning, I.; Buscot, F.; Wubet, T. Forest management type influences diversity and
62. Morrison, E.W.; Frey, S.D.; Sadowsky, J.J.; van Diepen, L.T.; Thomas, W.K.; Pringle, A. Chronic nitrogen additions fundamentally restructure the soil fungal community in a temperate forest. Fungal Ecol. 2016, 23, 48–57.
63. Truong, C.; Mujic, A.B.; Healy, R.; Kuhar, F.; Furci, G.; Torres, D.; Niskanen, T.; Sandoval‐Leiva, P.A.; Fernández, N.; Escobar, J.M. How to know the fungi: Combining field inventories and DNA‐barcoding to document fungal diversity. New Phytol. 2017, 214, 913–919.
64. Maheswari, S.; Rajagopal, K. Biodiversity of endophytic fungi in Kigelia pinnata during two different seasons. Curr. Sci. 2013, 104, 515–518.
65. Wallander, H.; Nilsson, L.O.; Hagerberg, D.; Bååth, E. Estimation of the biomass and seasonal growth of external mycelium of ectomycorrhizal fungi in the field. New Phytol. 2001, 151, 753–760.
66. Nilsson, M.; Rülcker, C. Seasonal variation of active fungal mycelium in an oligotrophic Sphagnum mire, northern Sweden. Soil Biol. Biochem. 1992, 24, 795–804.
67. Nagati, M.; Roy, M.; Manzi, S.; Richard, F.; Desrochers, A.; Gardes, M.; Bergeron, Y. Impact of local forest composition on soil fungal communities in a mixed boreal forest. Plant Soil 2018, 432, 345–357.
68. Schmidt, P.A.; Balint, M.; Greshake, B.; Bandow, C.; Rombke, J.; Schmitt, I. Illumina metabarcoding of a soil fungal community. Soil Biol. Biochem. 2013, 65, 128–132, doi:10.1016/j.soilbio.2013.05.014.
69. Seifert, K.A. Progress towards DNA barcoding of fungi. Mol. Ecol. Resour. 2009, 9 (Suppl. s1), 83–89, doi:10.1111/j.1755-0998.2009.02635.x.
70. Xu, J. Fungal DNA barcoding. Genome 2016, 59, 913–932.
71. Thormann, M.N.; Currah, R.S.; Bayley, S.E. The relative ability of fungi from Sphagnum fuscum to decompose selected carbon substrates. Can. J. Microbiol. 2002, 48, 204–211.
72. Fenton, N.J.; Bergeron, Y.; Paré, D. Decomposition rates of bryophytes in managed boreal forests: Influence of bryophyte species and forest harvesting. Plant Soil 2010, 336, 499–508.
73. Verhoeven, J.; Liefveld, W. The ecological significance of organochemical compounds in Sphagnum. Acta Bot. Neerl. 1997, 46, 117–130.
74. Rice, A.V.; Tsuneda, A.; Currah, R.S. In vitro decomposition of Sphagnum by some microfungi resembles white rot of wood. FEMS Microbiol. Ecol. 2006, 56, 372–382.
75. Thormann, M.N. Diversity and function of fungi in peatlands: A carbon cycling perspective. Can. J. Soil Sci. 2006, 86, 281–293.
76. Hågvar, S. Primary succession of springtails (Collembola) in a Norwegian glacier foreland. Arct. Antarct. Alp. Res. 2010, 42, 422–429.
77. Raffl, C.; Mallaun, M.; Mayer, R.; Erschbamer, B. Vegetation succession pattern and diversity changes in a glacier valley, Central Alps, Austria. Arct. Antarct. Alp. Res. 2006, 38, 421–428.
78. Dejene, T.; Oria-de-Rueda, J.A.; Martín-Pinto, P. Fungal diversity and succession following stand development in Pinus patula Schiede ex Schltdl. & Cham. plantations in Ethiopia. For. Ecol. Manag. 2017, 395, 9–18.
79. Kernaghan, G. Mycorrhizal diversity: Cause and effect? Pedobiologia 2005, 49, 511–520.
80. Blaalid, R.; Carlsen, T.; Kumar, S.; Halvorsen, R.; Ugland, K.I.; Fontana, G.; Kauserud, H. Changes in the root‐associated fungal communities along a primary succession gradient analysed by 454 pyrosequencing. Mol. Ecol. 2012, 21, 1897–1908.
81. Zumsteg, A.; Luster, J.; Göransson, H.; Smittenberg, R.H.; Brunner, I.; Bernasconi, S.M.; Zeyer, J.; Frey, B. Bacterial, archaeal and fungal succession in the forefield of a receding glacier. Microb. Ecol. 2012, 63, 552– 564.
82. Twieg, B.D.; Durall, D.M.; Simard, S.W. Ectomycorrhizal fungal succession in mixed temperate forests. New Phytol. 2007, 176, 437–447.
83. Hiiesalu, I.; Bahram, M.; Tedersoo, L. Plant species richness and productivity determine the diversity of soil fungal guilds in temperate coniferous forest and bog habitats. Mol. Ecol. 2017, 26, 4846–4858.
84. Boeraeve, M.; Honnay, O.; Jacquemyn, H. Effects of host species, environmental filtering and forest age on community assembly of ectomycorrhizal fungi in fragmented forests. Fungal Ecol. 2018, 36, 89–98. 85. He, L.; Chen, J.M.; Pan, Y.; Birdsey, R.; Kattge, J. Relationships between net primary productivity and
forest stand age in US forests. Glob. Biogeochem. Cycles 2012, 26, doi:10.1029/2010GB003942.
86. Ryan, M.; Binkley, D.; Fownes, J.H. Age-related decline in forest productivity: Pattern and process. Adv. Ecol. Res. 1997, 27, 213–262.
87. Rożek, K.; Rola, K.; Błaszkowski, J.; Zubek, S. Associations of root-inhabiting fungi with herbaceous plant species of temperate forests in relation to soil chemical properties. Sci. Total Environ. 2019, 649, 1573–1579. 88. Veresoglou, S.D.; Wulf, M.; Rillig, M.C. Facilitation between woody and herbaceous plants that associate
with arbuscular mycorrhizal fungi in temperate European forests. Ecol. Evol. 2017, 7, 1181–1189.
89. Öpik, M.; Moora, M.; Zobel, M.; Saks, Ü.; Wheatley, R.; Wright, F.; Daniell, T. High diversity of arbuscular mycorrhizal fungi in a boreal herb‐rich coniferous forest. New Phytol. 2008, 179, 867–876.
90. Urbanová, M.; Šnajdr, J.; Baldrian, P. Composition of fungal and bacterial communities in forest litter and soil is largely determined by dominant trees. Soil Biol. Biochem. 2015, 84, 53–64.
91. Lekberg, Y.; Koide, R.T.; Rohr, J.R.; Aldrich‐wolfe, L.; Morton, J.B. Role of niche restrictions and dispersal in the composition of arbuscular mycorrhizal fungal communities. J. Ecol. 2007, 95, 95–105.
92. Coleman, D.C.; Callaham, M.A.; Crossley, D., Jr. Fundamentals of Soil Ecology; Academic Press: Cambridge, MA, USA, 2017.
93. Bushby, H.; Marshall, K. Water status of rhizobia in relation to their susceptibility to desiccation and to their protection by montmorillonite. Microbiology 1977, 99, 19–27.
94. Bitton, G.; Henis, Y.; Lahav, N. Influence of clay minerals, humic acid and bacterial capsular polysaccharide on the survival of Klebsiella aerogenes exposed to drying and heating in soils. Plant Soil
1976, 45, 65–74.
95. Stotzky, G.; Rem, L. Influence of clay minerals on microorganisms: I. Montmorillonite and kaolinite on bacteria. Can. J. Microbiol. 1966, 12, 547–563.
96. Chase, J.M.; Leibold, M.A. Ecological Niches: Linking Classical and Contemporary Approaches; University of Chicago Press: Chicago, IL, USA, 2003.
97. Chau, J.F.; Bagtzoglou, A.C.; Willig, M.R. The effect of soil texture on richness and diversity of bacterial communities. Environ. Forensics 2011, 12, 333–341.
98. McGuire, K.L.; Fierer, N.; Bateman, C.; Treseder, K.K.; Turner, B.L. Fungal community composition in neotropical rain forests: The influence of tree diversity and precipitation. Microb. Ecol. 2012, 63, 804–812. 99. Talley, S.M.; Coley, P.D.; Kursar, T.A. The effects of weather on fungal abundance and richness among 25
communities in the Intermountain West. BMC Ecol. 2002, 2, 7.
100. Glassman, S.I.; Wang, I.J.; Bruns, T.D. Environmental filtering by pH and soil nutrients drives community assembly in fungi at fine spatial scales. Mol. Ecol. 2017, 26, 6960–6973.
101. Köster, K.; Berninger, F.; Lindén, A.; Köster, E.; Pumpanen, J. Recovery in fungal biomass is related to decrease in soil organic matter turnover time in a boreal fire chronosequence. Geoderma 2014, 235, 74–82. 102. Sun, H.; Santalahti, M.; Pumpanen, J.; Köster, K.; Berninger, F.; Raffaello, T.; Jumpponen, A.; Asiegbu,
F.O.; Heinonsalo, J. Fungal community shifts in structure and function across a boreal forest fire chronosequence. Appl. Environ. Microbiol. 2015, 81, 7869–7880.
103. Gock, M.A.; Hocking, A.D.; Pitt, J.I.; Poulos, P.G. Influence of temperature, water activity and pH on growth of some xerophilic fungi. Int. J. Food Microbiol. 2003, 81, 11–19.
104. Jackson, A.; Whipps, J.; Lynch, J. Effects of temperature, pH and water potential on growth of four fungi with disease biocontrol potential. World J. Microbiol. Biotechnol. 1991, 7, 494–501.
105. Yamanaka, T. The effect of pH on the growth of saprotrophic and ectomycorrhizal ammonia fungi in vitro. Mycologia 2003, 95, 584–589.
106. Rousk, J.; Bååth, E.; Brookes, P.C.; Lauber, C.L.; Lozupone, C.; Caporaso, J.G.; Knight, R.; Fierer, N. Soil bacterial and fungal communities across a pH gradient in an arable soil. ISME J. 2010, 4, 1340.
107. Rousk, J.; Brookes, P.C.; Bååth, E. Investigating the mechanisms for the opposing pH relationships of fungal and bacterial growth in soil. Soil Biol. Biochem. 2010, 42, 926–934.
108. Thomas, G.W. Soil pH and soil acidity. Methods Soil Anal. 1996, 3, 475–490.
109. Finzi, A.C.; Canham, C.D.; Van Breemen, N. Canopy tree–soil interactions within temperate forests: Species effects on pH and cations. Ecol. Appl. 1998, 8, 447–454.
110. Pernes-Debuyser, A.; Tessier, D. Influence du pH sur les propriétés des sols: l’essai de longue durée des 42 parcelles à Versailles. Rev. des Sci. de l’eau J. Water Sci. 2002, 15, 27–39.
111. Hawkes, C.V.; Kivlin, S.N.; Rocca, J.D.; Huguet, V.; Thomsen, M.A.; Suttle, K.B. Fungal community responses to precipitation. Glob. Chang. Biol. 2011, 17, 1637–1645.
112. O’Dell, T.E.; Ammirati, J.F.; Schreiner, E.G. Species richness and abundance of ectomycorrhizal basidiomycete sporocarps on a moisture gradient in the Tsuga heterophylla zone. Can. J. Bot. 2000, 77, 1699–1711.
113. Hernández-Rodríguez, M.; Oria-de-Rueda, J.A.; Martín-Pinto, P. Post-fire fungal succession in a Mediterranean ecosystem dominated by Cistus ladanifer L. For. Ecol. Manag. 2013, 289, 48–57.
114. Smith, J.; Molina, R.; Huso, M.M.; Luoma, D.; McKay, D.; Castellano, M.; Lebel, T.; Valachovic, Y. Species richness, abundance, and composition of hypogeous and epigeous ectomycorrhizal fungal sporocarps in young, rotation-age, and old-growth stands of Douglas-fir (Pseudotsuga menziesii) in the Cascade Range of Oregon, USA. Can. J. Bot. 2002, 80, 186–204.
115. Last, F.; Dighton, J.; Mason, P. Successions of sheathing mycorrhizal fungi. Trends Ecol. Evol. 1987, 2, 157– 161.
116. Jumpponen, A.; Trappe, J.M.; Cázares, E. Occurrence of ectomycorrhizal fungi on the forefront of retreating Lyman Glacier (Washington, USA) in relation to time since deglaciation. Mycorrhiza 2002, 12, 43–49.
117. Nara, K.; Nakaya, H.; Hogetsu, T. Ectomycorrhizal sporocarp succession and production during early primary succession on Mount Fuji. New Phytol. 2003, 158, 193–206.
118. Buckley, L.B.; Jetz, W. Linking global turnover of species and environments. Proc. Natl. Acad. Sci. USA
2008, 105, 17836–17841.
119. Maynard, D.S.; Bradford, M.A.; Covey, K.R.; Lindner, D.; Glaeser, J.; Talbert, D.A.; Tinker, P.J.; Walker, D.M.; Crowther, T.W. Consistent trade-offs in fungal trait expression across broad spatial scales. Nat. Microbiol. 2019, 4, 846.
© 2019 by the authors. Licensee MDPI, Basel, Switzerland. This article is an open access article distributed under the terms and conditions of the Creative Commons Attribution (CC BY) license (http://creativecommons.org/licenses/by/4.0/).