RESEARCH OUTPUTS / RÉSULTATS DE RECHERCHE
Author(s) - Auteur(s) :
Publication date - Date de publication :
Permanent link - Permalien :
Rights / License - Licence de droit d’auteur :
Institutional Repository - Research Portal
Dépôt Institutionnel - Portail de la Recherche
researchportal.unamur.be
University of Namur
Malaria risk assessment and mapping using satellite imagery and boosted regression
trees in the Peruvian Amazon
Solano-Villarreal, Elisa; Valdivia, Walter; Pearcy, Morgan; Linard, Catherine;
Pasapera-Gonzales, José; Moreno-Gutierrez, Diamantina; Lejeune, Philippe; Llanos-Cuentas,
Alejandro; Speybroeck, Niko; Hayette, Marie Pierre; Rosas-Aguirre, Angel
Published in:
Scientific Reports
DOI:
10.1038/s41598-019-51564-4
Publication date:
2019
Document Version
Publisher's PDF, also known as Version of record
Link to publication
Citation for pulished version (HARVARD):
Solano-Villarreal, E, Valdivia, W, Pearcy, M, Linard, C, Pasapera-Gonzales, J, Moreno-Gutierrez, D, Lejeune, P,
Llanos-Cuentas, A, Speybroeck, N, Hayette, MP & Rosas-Aguirre, A 2019, 'Malaria risk assessment and
mapping using satellite imagery and boosted regression trees in the Peruvian Amazon', Scientific Reports, vol.
9, no. 1, 15173, pp. 15173. https://doi.org/10.1038/s41598-019-51564-4
General rights
Copyright and moral rights for the publications made accessible in the public portal are retained by the authors and/or other copyright owners and it is a condition of accessing publications that users recognise and abide by the legal requirements associated with these rights. • Users may download and print one copy of any publication from the public portal for the purpose of private study or research. • You may not further distribute the material or use it for any profit-making activity or commercial gain
• You may freely distribute the URL identifying the publication in the public portal ?
Take down policy
If you believe that this document breaches copyright please contact us providing details, and we will remove access to the work immediately and investigate your claim.
Malaria risk assessment and
mapping using satellite imagery
and boosted regression trees in the
peruvian Amazon
elisa Solano-Villarreal
1,2,3*, Walter Valdivia
4, Morgan pearcy
2, Catherine Linard
5,6,
José pasapera-Gonzales
7, Diamantina Moreno-Gutierrez
2,8,9, Philippe Lejeune
1,
Alejandro Llanos-cuentas
3, Niko Speybroeck
2, Marie-Pierre Hayette
1&
Angel Rosas-Aguirre
2,3,10This is the first study to assess the risk of co-endemic Plasmodium vivax and Plasmodium falciparum transmission in the peruvian Amazon using boosted regression tree (BRt) models based on social and environmental predictors derived from satellite imagery and data. Yearly cross-validated BRT models were created to discriminate high-risk (annual parasite index Api > 10 cases/1000 people) and very-high-risk for malaria (API > 50 cases/1000 people) in 2766 georeferenced villages of Loreto department, between 2010–2017 as other parts in the article (graphs, tables, and texts). Predictors were cumulative annual rainfall, forest coverage, annual forest loss, annual mean land surface temperature, normalized difference vegetation index (NDVI), normalized difference water index (NDWI), shortest distance to rivers, time to populated villages, and population density. BRT models built with predictor data of a given year efficiently discriminated the malaria risk for that year in villages (area under the ROC curve (AUc) > 0.80), and most models also effectively predicted malaria risk in the following year. Cumulative rainfall, population density and time to populated villages were consistently the top three predictors for both P. vivax and P. falciparum incidence. Maps created using the BRT models characterize the spatial distribution of the malaria incidence in Loreto and should contribute to malaria-related decision making in the area.
In spite of the investment in control and prevention allocated by the Peruvian government over the last decades, malaria due to both Plasmodium vivax and P. falciparum remains a significant public health issue in the country. In 2015, 61,856 malaria cases were reported1, representing ~15% of the total reported cases in the Americas and
showing a continuous increase since 20122,3. The Amazonian department of Loreto is the most affected area,
accounting for 95% of national cases despite being home of only 3.5% of the Peruvian population2.
Loreto is a hypoendemic malaria area4,5, but malaria transmission in the department is highly
heterogene-ous, with some areas in remote Amazonia having entomological inoculation rates (EIRs) near those reported in Africa. This heterogeneity creates opportunities for targeted interventions, provided high-risk hotspots are first identified3,6. Since the 1960s, malaria risk maps have been essential for planning interventions7–9. Recently,
elec-tronic geographic information systems and remote sensing have improved these maps by providing an array of environmental and social data collected through passive and active satellite sensors10–13.
1Université de Liège, 4000, Liège, Belgium. 2Research Institute of Health and Society (IRSS), Université catholique
de Louvain, 1200, Brussels, Belgium. 3Institute of Tropical Medicine Alexander von Humboldt, Universidad Peruana
Cayetano Heredia, Lima, 15102, Peru. 4Ministry of Development and Social Inclusion, Lima, 15047, Peru. 5Namur
Research Institute for Life Sciences (Narilis), Université de Namur, 5000, Namur, Belgium. 6Institute of
Life-Earth-Environment (ILEE), 5000, Namur, Belgium. 7National Aerospace Development Commission, Lima, 15046,
Peru. 8University of Antwerp, 2000, Antwerp, Belgium. 9Faculty of Human Medicine, Universidad Nacional de la
Amazonía Peruana, Loreto, 160, Peru. 10Fonds de la Recherche Scientifique (FNRS), 1000, Brussels, Belgium. *email: [email protected]
The main factors responsible for the variation in malaria transmission in the Amazon are environmental char-acteristics facilitating larvae breeding sites (temperature, precipitation, natural and human-made water bodies) and mosquito resting places (surrounding vegetation, deforestation) for the primary malaria vector of P. vivax and P. falciparum, Anopheles darlingi14–17. Social factors also influence malaria transmission by increasing
expo-sure (forest-based economic activities)18,19, by contributing to delayed diagnosis and treatment (poor
geographi-cal accessibility to health facilities)20–22, or by limiting effectiveness of malaria interventions (lower availability and
utilization of control resources and preventive measures, and inappropriate treatment-seeking behaviors)23–25.
Satellite data26,27 were used to derive environmental and social potential predictors28–30 of malaria risk in
vil-lages of Loreto during the period 2010–2017. The association of these predictors with malaria occurrence in the villages was analyzed using boosted regression trees (BRTs), a method that accounts for nonlinearities and interactions of variables with high predictive accuracy31–33, and allows for disease mapping32,34–36. Yearly analyses
were performed to determine the relevance of predictors at local scale across the years. Maps identifying villages at highest risk were created to support the malaria decision making in Loreto.
Methods
Study area.
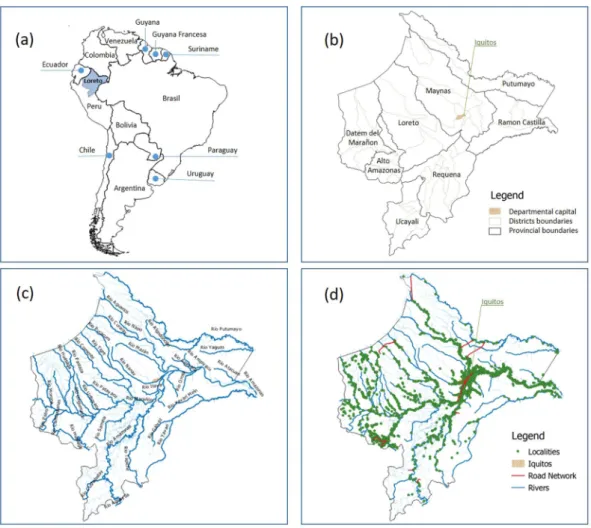
Loreto, located in the northeast part of Peru between 61 to 220 meters above sea level, is the largest department in Peru (368,851.95 km2, 28.7% of the national territory). A total of 883,510 inhabitants live in the department, with ~40% of them aged below 15 years, and ~one third residing in rural areas37. Loreto has atropical climate, with a rainy season from November to May and a dry season from June to October. Precipitation is present throughout the year (cumulative average: 2,500 mm) with a peak in March (360 mm) and a minimum in July (50–100 mm). Rural villages mainly depend on natural resource exploitation, while commercial activities are more important in cities and large villages. Loreto has an extensive fluvial network connected to the Amazon River (Fig. 1), and boats are the primary mode of transportation.
Population and malaria incidence.
Of the 2,843 villages included in the official cartography of Loreto, we validated and georeferenced 2,766 villages in Loreto as points in QGIS38,39. Non-validation was primarily dueto duplicated names and/or duplicated coordinates. The population of villages, obtained from the exceptional National Census of 2012–201340, was assumed to be uniform during the study period.
Figure 1. Study area: (a) geographical location of Loreto in South America; (b) administrative division of Loreto: department, provinces, and districts; (c) hydrographic map of Loreto; (d) road network, rivers, and georeferenced villages.
Malaria is a mandatory notifiable disease in Peru. Malaria cases are confirmed by light microscopy in health facilities and attributed to the apparent place of infection using a village’s alphanumeric code, then reported to the surveillance system of Ministry of Health (MoH)41. Since malaria has been associated with travel- and
forest-related activities in Loreto, the place of infection provides a more accurate information than the place of residence when modelling malaria transmission. For the purpose of our study, all reported cases in Loreto between 2010 and 2017 were aggregated by village and by year. Yearly overall and species-specific indices (API) were calculated for each village using the formula: (number of confirmed cases/village population size) x 1,000. Villages were classified as being or not at high-risk (i.e. API > 10 cases/1,000 people) or very-high-risk (API > 50 cases/1,000 people) based on MoH thresholds.
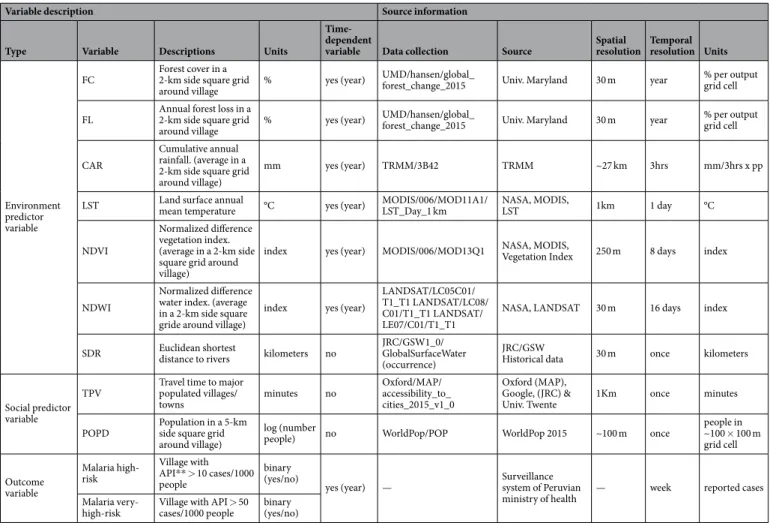
Social and environmental predictors.
Social and environmental variables previously associated with malaria transmission7,42,43 were tested as factors for high-risk (IPA > 10) or very-high-risk (IPA > 50) (Table 1).These variables were derived from different satellite imagery and mixed products. JavaScript codes for Google Earth Engine (GEE)44 were used to download and process this images at Datum WGS84 zone 18 (EPSG 4326).
Below is a brief description of the variables:
Time to major populated villages/towns (TPV), social variable indicating the land-based travel time in minutes
to the nearest densely-populated area for the year 2015. Underlying datasets included roads, railways, rivers, lakes, oceans, slope and elevation, land cover types, and national borders22.
Population density (POPD), social variable representing the estimated number of residents in each 100mx100m
grid-cell in 2015, extracted from WorldPop (https://www.worldpop.org)29.
Shortest distance to rivers (SDR), environmental variable estimated using the Global Surface Water
(occur-rence) map45 from JRC (Joint Research Centre). A 50% threshold mask was applied in GEE to select pixels with
a presence of water at least half of the period 1984–2015, capturing main and secondary rivers. The shortest distance in (meters) between rivers and villages was calculated using the proximity algorithm QGIS v.3.4.246,47.
Forest coverage (FC) and forest loss (FL), time-dependent measures of the area covered by trees (%) in each year
and the loss of tree coverage compared to the previous year (%), calculated from 2000–2018 Global Forest Change data (https://earthenginepartners.appspot.com/science-2013-global-forest/download_v1.6.html)48.
Cumulative annual rainfall (CAR), the estimated cumulative yearly rainfall (mm/year) calculated from daily
3-hour infrared precipitation estimates in product 3B42 of the Tropical Rainfall Measuring Mission (TRMM)49.
Variable description Source information
Type Variable Descriptions Units
Time-dependent
variable Data collection Source Spatial resolution Temporal resolution Units
Environment predictor variable
FC Forest cover in a 2-km side square grid
around village % yes (year)
UMD/hansen/global_
forest_change_2015 Univ. Maryland 30 m year % per output grid cell
FL Annual forest loss in a 2-km side square grid
around village % yes (year)
UMD/hansen/global_
forest_change_2015 Univ. Maryland 30 m year % per output grid cell
CAR
Cumulative annual rainfall. (average in a 2-km side square grid around village)
mm yes (year) TRMM/3B42 TRMM ~27 km 3hrs mm/3hrs x pp
LST Land surface annual mean temperature °C yes (year) MODIS/006/MOD11A1/LST_Day_1 km NASA, MODIS, LST 1km 1 day °C
NDVI
Normalized difference vegetation index. (average in a 2-km side square grid around village)
index yes (year) MODIS/006/MOD13Q1 NASA, MODIS, Vegetation Index 250 m 8 days index
NDWI
Normalized difference water index. (average in a 2-km side square gride around village)
index yes (year)
LANDSAT/LC05C01/ T1_T1 LANDSAT/LC08/ C01/T1_T1 LANDSAT/ LE07/C01/T1_T1
NASA, LANDSAT 30 m 16 days index
SDR Euclidean shortest distance to rivers kilometers no JRC/GSW1_0/GlobalSurfaceWater (occurrence)
JRC/GSW
Historical data 30 m once kilometers
Social predictor variable
TPV Travel time to major populated villages/
towns minutes no Oxford/MAP/ accessibility_to_ cities_2015_v1_0 Oxford (MAP), Google, (JRC) &
Univ. Twente 1Km once minutes POPD Population in a 5-km side square grid
around village)
log (number
people) no WorldPop/POP WorldPop 2015 ~100 m once
people in ~100 × 100 m grid cell Outcome variable Malaria high-risk Village with API** > 10 cases/1000 people binary (yes/no)
yes (year) — Surveillance system of Peruvian
ministry of health — week reported cases Malaria
very-high-risk Village with API > 50 cases/1000 people binary (yes/no)
Table 1. Predictor and outcome variables used in BRT models. **API = Confirmed cases in a year *1000 / total population. *PP: Per-pixel.
Normalized Difference Water Index (NDWI), a satellite-derived index from the Near-Infrared (ρNIR) and
Short Wave Infrared (ρSWIR) channels that estimates the amount of water in internal leaf structure50,51. This
index was processed from Landsat 5, 7 and 8 T1 (calibrated TOA, DOS and clouds masking), and calculated as NDWI = (ρNIR-ρSWIR)/(ρNIR + ρSWIR)52,53.
Normalized Difference Vegetation Index (NDVI)), the estimated fraction of radiation absorbed by the
vege-tation in the red (ρRED) and the near infrared (ρNIR) channels54, from the MODIS/006/MOD13Q1 Moderate
Resolution Imaging Spectroradiometer - National Aeronautics and Space Administration (NASA). The index was calculated at a spatial resolution of 250 m. as: NDVI = (ρNIR-ρRED)/(ρNIR + ρRED)52,55–57.
Land Surface Temperature (LST), an estimate of the infrared emissivity of the earth in degrees Celsius
(Emissivity Daily L3 Global, MOD11A1 version 6)58. Mean values from 365 daily layers were used to produce
raster images with yearly means.
Extraction of values.
Raster images were re-sampled to 90-meter-pixels using R software version 3.5.1. The focal function generates an output raster based on the neighborhood information59 using “moving windows”around pinpointed villages. It was used here to capture a 2 km-side square grid for FC, FL, CAR, NDVI, NDWI and LST, and a 5 km-side square grid for POPD. The 2 km-side threshold was chosen to cover breeding and rest-ing sites within the flight distance for An. darlrest-ingi mosquitoes60,61, while a 5 km-side threshold capturing the
pop-ulation within and around the village. Raster values in square grids were aggregated as averages for environmental variables and as sums for POPD. For TPV and SDR, the extracted values were at village location. Corresponding R codes are presented in Supplementary Text S1.
Boosted regression tree analysis.
BRT models62,63 were created using R packages “gbm”64,65 and “dismo”31to examine the relationship between potential predictors and the species-specific malaria risk status in villages for each study year. The binary data (i.e. villages with or without high-risk of malaria; or, villages with or without very-high-risk of malaria) was fitted using a Bernouilli response distribution. The optimal learning rate, bag. fraction and tree complexity were determined by testing several combinations with the lowest model deviance. Ten-fold cross-validation procedures using the “gbm.step” function enabled the selection of the optimal number of regression trees for each model, ensuring the same villages in cross-validation groups across models with the parameter “fold.vector”.
The relative contribution (RC) percentage was used to assess the relevance of each variable in BRT mod-els. This metric measures how often the predictor is selected for partitioning, weighted by the squared model improvement resulting from successive partitions31,66. Partial dependence plots were generated to describe the
effect of one predictor on the malaria risk status of the villages, after accounting for the average effects of all other predictors67. In these plots, the vertical axis is the logit of cross-validated predicted probability (logit (p)) for
high-risk or very-high-risk of malaria, and the horizontal axis is the variable predictor with corresponding units. The area under the curve (AUC) of the receiver operating characteristic (ROC) curve assessed the perfor-mance of BRT models for discriminating the malaria risk status in villages. Each cross-validation BRT model built with data of a given year yielded a cross-validated AUC (cvAUC), while its model predictions (i.e. predicted probabilities for villages at malaria risk) with testing data of the following year allowed for the estimation of a testing AUC (tAUC).
Risk maps elaboration.
BRT models built with 2016 data were tested with 2017 data, obtaining predicted probabilities for villages at high-risk (API > 10) and villages at very-high-risk (API > 50). These predicted prob-abilities were then used to classify villages into four categories (i.e. 0–0.25, 0.251–0.50, 0.511–0.75, 0.751–1.00), and to create species-specific risk maps for 2017 using QGIS v.3.4.2-Madeira.Ethical considerations.
This study is part of the research project “Spatial tools and optimization techniques to support case detection strategies for the malaria control in the Peruvian Amazon” approved by Universidad Peruana Cayetano Heredia, SIDISI number 101052.Results
Malaria occurrence.
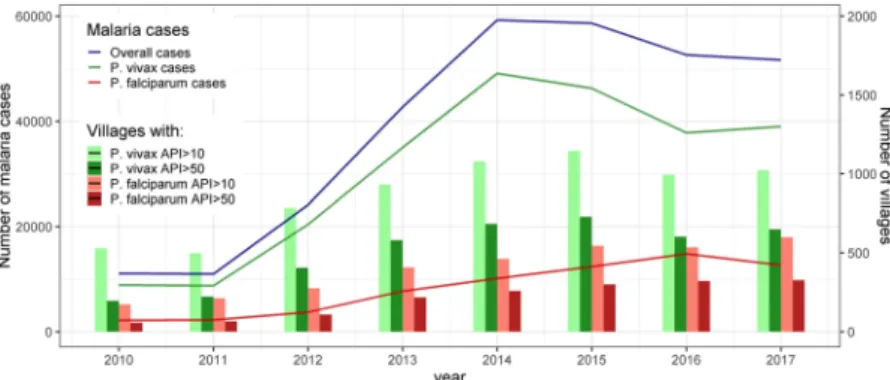
Of the 321,210 malaria cases reported to the epidemiological surveillance system in Loreto between 2010 and 2017, 311,128 cases (96.9%) occurred among our validated and georeferenced 2,766 villages. Non-pinpointed cases (3.1%) could correspond to infections in transient populations and/or inaccurate records of the place of the infection.Malaria steadily increased in study villages from 10,994 cases in 2011 to 59,257 cases in 2014 and 58,679 in 2015, after which cases slightly declined to 51,663 in 2017 (Fig. 2). P. vivax cases always predominated over P.
falciparum cases with the maximum ratio in 2012 (Pv/Pf 5.5) and the minimum ratio in 2016 (Pv/Pf 2.6). The
highest peak occurred earlier for P. vivax (2014) than for P. falciparum (2016). The number of villages at high-risk (API > 10) and at very-high-risk (API > 50) followed similar trends.
Relative contribution (RC) of variables.
Mean (M), standard deviation (SD), median (Mdn), and inter-quartile range (IQR) values of predictor variables are presented in Supplementary Table S1. The RC of predictors obtained from yearly cross-validated BRT models are shown in Supplementary Tables S2, S3 and S4 and Fig. S1. Most RCs for overall malaria risk were similar to ones for P. vivax each year. CAR, POPD, and TPV, in that order, were always the top three predictors for increasing malaria risk in villages (overall and by species), with yearly RC medians exceeding 10% (Fig. 3). NDWI was the fourth top predictor, but yearly RC medians only exceeded 10% when BRT models assessed villages at P. vivax very-high-risk of and villages at P. falciparum high-risk.CAR was generally the most relevant predictor in yearly BRT models for both P. vivax and P. falciparum, and presented the widest variation in RC. The analysis for high-risk in villages showed a higher RC of CAR for P. vivax than for P. falciparum (Supplementary Fig. S1), with the lowest RC for both species in 2010 and the highest in 2015 (RC range for P. vivax: 17%-48.4%; RC range for P. falciparum: 11.5%-30.7%). The analysis for very-high-risk found the lowest RC in 2010 for both P. vivax (14.3%) and P. falciparum (16.1%), and the highest in 2015 for P.
vivax (35.5%) and in 2016 for P. falciparum (26.2%). The estimated RC for CAR followed similar trends with
increasing importance of CAR as malaria risk predictor until 2015 for P. vivax and until 2015–2016 for P.
falci-parum, followed by a decrease (P. vivax) or stabilization (P. falciparum).
Unlike CAR, the POPD RC in villages was slightly higher for P. falciparum than for P. vivax in most years (Supplementary Fig. S1). The relevance of POPD varied widely across years only when BRT models assessed for P. vivax high-risk (range: 9.2–22.6%) and P. falciparum very-high-risk (range: 10.0–21.4%). The highest RCs for P. vivax malaria risk were found at the beginning of the study period (2010–2012) and then decreased and remained low with small variations; while RCs for P. falciparum increased from 2010 to 2014 and then declined in the following years.
The importance of NDWI as species-specific malaria risk predictor varied during the study period. The dif-ference between lowest and highest RCs ranged between 3.8 and 18.9%, with an initial decrease in RC from 2010 to 2011 followed by peaks in 2012 and in 2016. The non-time dependent variable TPV was the predictor with the lowest RC variation across years for P. vivax risk in villages (7.4%-11.6% and 11%-13.1% for high-risk and very-high-risk respectively). It was also among the predictors with the lowest RC ranges when assessing the P.
falciparum risk across time. For all other predictors in species-specific BRT models, the difference between lowest
and highest RCs did not exceed 10% across years.
Figure 2. Reported malaria cases and number of villages at risk in Loreto from 2010 to 2017.
Figure 3. Relative contributions of predictors obtained from yearly BRT models for malaria risk, overall and by species, over the study period (2010–2017).
Partial dependence plots.
Supplementary Fig. S2 presents partial dependence plots (PDPs)68 of themar-ginal effect of predictor variables on the probability of villages to be at high-risk or very-high-risk, and shows whether the relationship is linear, monotonous or complex. The probability for a village to be at high-risk of P.
vivax malaria generally increases with: CAR over 800 mm/3 hrs, POPD between 403 and 2,980 in the 5-km side
square grid around the village, TPV superior to 700 minutes, NDWI around 0.4, FC higher than 50% in the 2-km side square grid around the village, NDVI between 0.7 and 0.8, LST higher than 27 °C, shorter SDR, and higher FL in the in the 2-km side square grid around the village. The probability for a village to be at high-risk for P.
fal-ciparum malaria increased with CAR over 800 mm/3 hrs, POPD between 403 and 1096 inhabitants, longer TPV,
NDWI around 0.4, FC superior to 60%, NDVI ranging between 0.5 and 0.8, LST higher than 26 °C, shorter SDR, and higher FL. PDPs for very-high-risk are shown in Supplementary Fig S3.
The discriminatory capacity of the models.
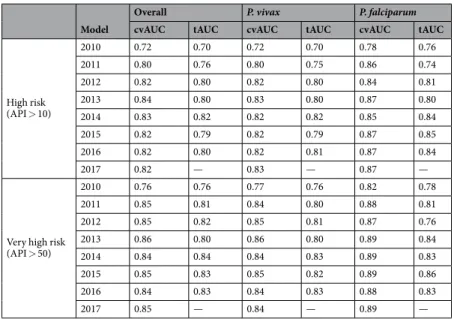
The cvAUCs shown in Table 2 suggest that most yearly BRT models efficiently discriminate malaria risk in villages (cvAUC > 0.80), with the exception of the 2010 models for villages at high-risk (cvAUC = 0.72), and very-high-risk of P. vivax (cvAUC = 0.77), as well as P. falciparum high-risk (cvAUC = 0.78). The estimated tAUCs decreased slightly when the yearly models were tested with data corresponding to the following year, but most of the models still efficiently predicted malaria risk in the follow-ing year. For example, 2016 species-specific models usfollow-ing 2017 data were able to efficiently discriminate vil-lages at high-risk (tAUC = 0.81) and very-high-risk (tAUC = 0.84) of P. vivax, and high-risk (tAUC = 0.83) and very-high-risk of P. falciparum (tAUC = 0.83) in 2017. Results from the discriminatory assessment of yearly BRT models with data from other years are presented in Supplementary Fig. S4.Risk mapping.
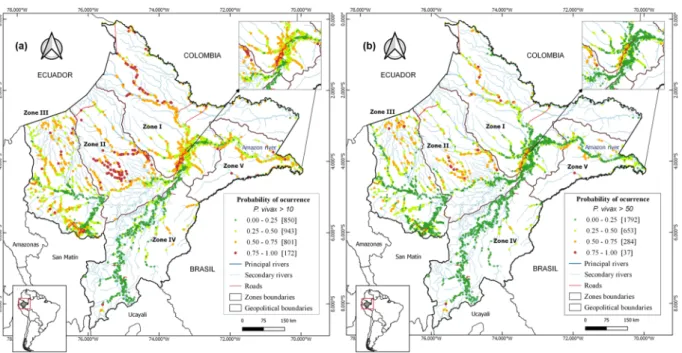
The study villages and their malaria risk in 2017 (estimated from 2016 BRT species-specific models) were mapped (Figs 4 and 5) in five distinct zones based on contiguity between districts, main networks of transport, shared river basins, and population density.Zone I, includes Maynas province and is the largest, most densely populated and accessible area in the
department. The risk maps showed that 42.9% of villages were at high-risk of P. vivax, among which 10.5% were at very-high-risk. Also, 11.7% of villages were at high-risk of P. falciparum, among which 1.4% were at very-high-risk.
Zone II, covers Loreto province; it is the least populated area. Most villages (56.5%), were at high-risk of P. vivax, and 28.7% at very-high-risk. For P. falciparum, 27.8% were at high-risk, and 3.5% at very-high-risk.
Zone III, is the second most densely populated area and covers Datem del Maranon and Alto Amazonas
provinces, which include 30% of the study villages and 19% of the province’s population. One third (34.5%) of the villages were at high-risk of P. vivax, and 12.3% at very-high-risk. For P. falciparum, 5.4% were at high-risk, and 1.1% at very-high-risk.
Zone IV, comprises Requena and Ucayali provinces, with 3.9% of villages at high-risk of P vivax, and 1.4% at
very-high-risk. Only one village was at high-risk for P. falciparum.
Zone V, comprises Ramon Castilla province, and is the smallest zone, with 9% of the study villages and 6.7%
of Loreto population. A significant proportion of villages (45.3%) were at high-risk of P. vivax, and 11.3% at very-high-risk. Seven villages were at high-risk of P. falciparum.
Model
Overall P. vivax P. falciparum
cvAUC tAUC cvAUC tAUC cvAUC tAUC
High risk (API > 10) 2010 0.72 0.70 0.72 0.70 0.78 0.76 2011 0.80 0.76 0.80 0.75 0.86 0.74 2012 0.82 0.80 0.82 0.80 0.84 0.81 2013 0.84 0.80 0.83 0.80 0.87 0.80 2014 0.83 0.82 0.82 0.82 0.85 0.84 2015 0.82 0.79 0.82 0.79 0.87 0.85 2016 0.82 0.80 0.82 0.81 0.87 0.84 2017 0.82 — 0.83 — 0.87 —
Very high risk (API > 50) 2010 0.76 0.76 0.77 0.76 0.82 0.78 2011 0.85 0.81 0.84 0.80 0.88 0.81 2012 0.85 0.82 0.85 0.81 0.87 0.76 2013 0.86 0.80 0.86 0.80 0.89 0.84 2014 0.84 0.84 0.84 0.83 0.89 0.83 2015 0.85 0.83 0.85 0.82 0.89 0.86 2016 0.84 0.83 0.84 0.83 0.88 0.83 2017 0.85 — 0.84 — 0.89 —
Table 2. Assessment of the discriminating power of BRT models for malaria risk in villages. Each cross-validation BRT model built with data of a given year yielded a cross-validated AUC (cvAUC), while its model predictions with testing data of the following year allowed for the estimation of a testing AUC (tAUC).
Discussion
Using cross-validated BRT and remote-sensing (RS) satellite data, we modelled the distribution of malaria inci-dence by Plasmodium species in the Peruvian Amazon at village level between 2010 and 2017, and identified the most critical factors associated with this distribution. Yearly BRT models built with predictor data were able to efficiently discriminate the species-specific malaria risk in villages of the same year, and most of these models also performed well when predictor data was used to discriminate malaria risk in the following year. The high dis-criminatory capacity of the 2016 BRT models supported the generation of maps pinpointing villages with a high probability of having high malaria incidence (API > 10 cases x 1000 people) and very high incidence (API > 50 cases/1000 people) in 2017.
Figure 4. Predicted P. vivax risk maps for the year 2017 using 2016´s BRT models, showing: (a) villages at high
P. vivax risk (API > 10 cases/1,000 people), (b) villages at very high P. vivax risk (API > 50 cases/1,000 people).
Colors indicate the probability of a village (dots) of being at risk.
Figure 5. Predicted P. falciparum risk maps for the year 2017 using 2016´s BRT models, showing: (a) villages at high P. falciparum risk (API > 10 cases/1,000 people), (b) villages at very high P. falciparum (API > 50 cases/1,000 people). Colors indicate the probability of a village (dots) of being at risk.
The mapping of malaria risk plays a key role in decision-making for designing and implementing malaria control measures69, but it requires the use of metrics that ensure an accurate description of malaria heterogeneity
and the identification of changes in transmission intensity across time and geographical scales70. The
entomo-logical inoculation rate (EIR) and the parasite prevalence are the best metrics of malaria transmission intensity but their estimations require several community surveys per year (to capture annually seasonal variations), very large sample sizes, and specialized laboratory techniques, making them cost-prohibitive for National Malaria Control Programs (NMCPs)70. Instead, NMCPs have used the incidence of microscopically confirmed malaria
cases detected by routine surveillance to map the risk of malaria transmission, prioritize intervention areas, and monitor the impact of control interventions71. Our study confirmed that predicted malaria risk from BRT models
built with remote sensing derived predictors can accurately characterize the spatial distribution of the malaria incidence in Loreto.
The ability of P. vivax parasites to relapse from persistent liver parasite stages (hypnozoites) weeks or months after a primary parasitaemia72 may explain the lower discriminatory efficiency of P. vivax models compared with
P. falciparum models in most study years. BRT models were built with available data from predictor variables
reported to affect the malaria transmission. However, such variables are not yet proposed in the literature to be primary triggers of P. vivax relapses72. Once factors determining the hypnozoite reactivation are clearly identified,
they could be incorporated to improve discriminatory capacity of the models for P. vivax risk. Improved models would be useful in the Peruvian Amazon, where epidemiological studies and parasite genotyping analyses suggest that relapses contribute substantially to the burden of P. vivax infections2. Moreover, data on main control
inter-ventions could also be used during the model building process, to account for the greater resilience of P. vivax to malaria control efforts in comparison with P. falciparum73.
Environmental factors such as temperature and rainfall directly affect the lifecycles of both parasite and vec-tor; higher temperatures accelerate parasitic plasmodium growth within mosquitoes, while rainfall contributes to the accumulation of stagnant water that is ideal for mosquito breeding61. Results from partial dependence plots
showing higher malaria risk when the yearly average LST ranged between 26 °C and 29 °C are in good agreement with the reported optimal temperatures for the development of the exogenous P. vivax and P. falciparum cycles within the main malaria vector An. darlingi61. However, due to the low variability of LST across villages, this
variable was not among the most important factors for discriminating the malaria risk between villages. Instead, the variable satellite-derived rainfall was the best predictor for both species, with increased importance each year until2015. Unusually heavy rains in the last trimester of each year between 2011 and 2014 generated abrupt increases of river levels, and flooded to villages along the Amazonas River and its tributaries between 2012 and 20152,74–76. The river levels not only peaked earlier and higher compared to historical averages, but also they
remained high for a longer period. Levels of Amazon river in 2015 exceeded the threshold for imminent flood-ing (117 metres above sea level) from March through June77. River levels in 2011, 2012 and 2016 surpassed that
threshold during 5, 14, and 4 weeks, respectively.
The proximity to breeding sites is an important determinant for the heterogeneity of both mosquito exposure and malaria occurrence in the Peruvian Amazon78. After seasonal rains, permanent breeding sites around
vil-lages become more productive, and additional breeding sites arise79. With severe flooding, breeding sites further
enlarge and remain longer, leading to a wider dispersal of An. darlingi and increased vector-human contact rates. Villages with shorter distances to rivers had increased malaria receptivity and consequently, more malaria inci-dence as shown in PDPs. Increased vector contact would explain both the higher contribution of CAR in P. vivax and P. falciparum models and the better discriminatory efficiency of P. vivax models in the years of severe floods (2012–2015). Therefore, our findings suggest that new infections contributed more than hypnozoite-triggered relapses to the rise in the P. vivax malaria incidence since 2012.
In the literature, NDWI has been successfully used to identify bodies of water80. This predictor was an
impor-tant factor in BRT models for both species (median in the study period slightly lower than 10%); but unlike with rainfall, its relative contribution did not present any identifiable temporal trend during the study period. Yearly average NDWI values around 0.4 were associated with increased malaria risk, suggesting that most of the 2-km side square grid around villages with high malaria incidence was covered by open water and/or wetlands, although NDWI did not allow to characterize those water bodies that are suitable for the development of An.
dar-lingi. A recent study conducted in rural villages in the Peruvian Amazon found that the An. darlingi larval habitats
were significantly associated with water bodies in landscapes with more recent deforestation, lower light intensity, emergent vegetation and a lower vegetation index78. The vegetation covering and surrounding these breeding sites
could provide food for larvae, shelter from predators, and favourable oviposition conditions81. The yearly average
NDVI values in the 2-km side square grid around villages would not differentiate this vegetation as suggested by the low contribution of this variable to the malaria risk models, and the increased malaria incidence associated with NDVI values above 0.6.
Deforestation and environmental changes driven by human activity have been associated with An. darlingi breeding and malaria transmission16; however, the heterogeneous definitions of deforestation in these studies
precludes us from drawing a firm conclusion17. According to our BRT models, substantial recent tree cover loss
in a 2-km side square grid around villages, forest loss was associated with higher malaria occurrence. However, this forest-related variable was not among the top predictors for discriminating the malaria risk, likely due to its limited variability across villages. The positive relationship between yearly deforestation and malaria risk is in line with entomological studies showing that An. darlingi larvae were more likely to be found in water bodies with recent deforestation16,78. Several studies in the Brazilian Amazon have found high densities of larval and adult
Anopheles in forest fringes, as well as increased malaria morbidity in populations living or working near forest
edges82,83. A relationship between forest coverage and forest edges might explain why villages with lower forest
coverage have reduced malaria risk than those with higher coverage. As deforested areas increase, the distance to forest edges also increases but malaria transmission remains high because of the quantity and extension of
forest edges around villages. Reduction in forest coverage would make forest edges more distant, hereby reducing malaria risk, unless residents engage in activities near forest edges. However, reduced forest coverage can also indicate increased socio-economic development, which is often associated with improvements in living condi-tions and malaria preventive practices84.
Vector-human contact requires that mosquitoes fly from breeding sites and forest edges to access to human blood meals78. Therefore, contact rates and malaria transmission strongly depend on both the dispersal of An.
darlingi and the population density near breeding sites and forest edges. Our analysis highlighted the population
density as the second most important predictor for malaria risk; yet, a positive relationship was only observed in the most densely populated villages. Further research will be required to confirm the negative relationship found in less densely populated villages. The sparsely distributed population in the Peruvian Amazon may be at increased malaria risk because of precarious conditions, with limited access to health care, and exposure to mos-quito bites due to subsistence farming, fishing, hunting and other activities near or within the forest18,19. Besides,
the time to major populated villages had a positive relationship with malaria risk, consistent with the idea that this variable can represent a valid proxy for diminished access to health care facilities, hereby reducing diagnosis and treatment, and hindering the delivery of malaria prevention interventions21.
The limitations of this study must also be acknowledged. First, the assumption of constant population size for villages across years could have reduced the discriminatory efficiency of the BRT models since they did not account for migration. Second, NDWI and NDVI might not be among the best proxies for environmental ground conditions that affect malaria transmission. Yearly means of these indexes might not capture the particular char-acteristics of breeding and resting sites of An. darlingi. Future research accounting for annual and seasonal var-iations in malaria risk and predictor variables will indicate to what extent predictive models can be improved. Third, population density within mosquito dispersal ranges does not only refer to the population living near breeding sites or forest edges, but also to individuals approaching these places for economic activities (human mobility). Unfortunately, the information was not available at the village level. Fourth, data of main control inter-ventions per village during the study period was not available. These data would improve the discriminatory efficiency of models and allow a better assessment of the differential contribution of predictor factors between species. Fifth, the resampling of predictor raster data to a higher resolution always results in output raster as precise as the coarsest inputs, and it can add a systematic bias to developed models at high resolution. A higher resolution data for cumulative annual rainfall was not available for the study period. However, this variable has a low spatial variation in the Amazon region principally for its extensive plain topography85, and the corresponding
bias is therefore expected to be limited.
In this study, we demonstrated that the probability of malaria occurrence in villages of Loreto in the Peruvian Amazon could be estimated using machine learning BRT models and RS-derived variables associated with the complex malaria host-vector-parasite relationships, resulting in predictive malaria risk maps that accurately char-acterized the spatial distribution of malaria incidence. Although further validation with better metrics of malaria transmission (i.e. EIR, parasite prevalence) is required, we hypothesize that the performance in discriminating the malaria transmission risk of model-predicted maps could surpass that of incidence maps in areas of reduced transmission and predominant asymptomatic infections not detected by traditional surveillance systems. This scenario will likely be reached shortly with the implementation of the 2017 governmental initiative “Zero Malaria Plan”86 aimed at reducing the burden of clinical malaria cases in the short-term, and eliminating the disease in
the long-term.
Data availability
The authors confirm that the data supporting the findings of this study are available within the article and/or its supplementary materials. Additional data is available from the corresponding author E.S-V. on request.
Received: 23 July 2019; Accepted: 2 October 2019;
Published: xx xx xxxx
References
1. CDC-MINSA/Peru. Análisis de la Situación de Salud del Perú. (CDC, 2017).
2. Rosas-Aguirre, A. et al. Epidemiology of Plasmodium vivax malaria in Peru. Am. J. Trop. Med. Hyg. 95, 133–144 (2016).
3. Soto-Calle, V. et al. Spatio-Temporal analysis of malaria incidence in the Peruvian Amazon Region between 2002 and 2013. Sci. Rep.
7 (2017).
4. Roshanravan, B. et al. Endemic Malaria in the Peruvian Amazon Region of Iquitos. Am. J. Trop. Med. Hyg. 69, 45–52 (2003). 5. Branch, O. et al. Clustered local transmission and asymptomatic Plasmodium falciparum and Plasmodium vivax malaria infections
in a recently emerged, hypoendemic Peruvian Amazon community. Malar. J. 4, 27 (2005).
6. Bousema, T. et al. Identification of Hot Spots of Malaria Transmission for Targeted Malaria Control. J. Infect. Dis. 201, 1764–1774 (2010).
7. Hay, S. I., Snow, R. W. & Rogers, D. J. Predicting malaria seasons in Kenya using multitemporal meteorological satellite sensor data.
Trans. R. Soc. Trop. Med. Hyg. 92, 12–20 (1998).
8. Adeola, A. M., Olwoch, J. M., Botai, J. O., Kalumba, A. M. & Adisa, O. M. Landsat satellite derived environmental metric for mapping mosquitoes breeding habitats in the Nkomazi municipality, Mpumalanga Province, South Africa. 6245 (2015). 9. Sewe, M. O., Ahlm, C. & Rocklv, J. Remotely sensed environmental conditions and malaria mortality in three malaria endemic
regions in western kenya. PLoS One 11, 1–16 (2016).
10. Moss, W. J. et al. Use of remote sensing to identify spatial risk factors for malaria in a region of declining transmission: a cross-sectional and longitudinal community survey. Malar. J. 10, 163 (2011).
11. Alimi, T. O. et al. A multi-criteria decision analysis approach to assessing malaria risk in northern South America. BMC Public
Health 16, 1–10 (2016).
12. Li, Q., Lu, L., Weng, Q., Xie, Y. & Guo, H. Monitoring Urban Dynamics in the Southeast USA 13–15, https://doi.org/10.3390/ rs8070578 (2016).
13. Mellander, C., Lobo, J., Stolarick, K. & Matheson, Z. Night-Time Light Data: A Good Proxy Measure for Economic Activity? PLoS
One 1–18, https://doi.org/10.1371/journal.pone.0139779 (2015).
14. Maheu-Giroux, M. et al. Risk of malaria transmission from fish ponds in the Peruvian Amazon. Acta Trop. 115, 112–118 (2010). 15. Vittor, A. Y. et al. The effect of deforestation on the human-biting rate of Anopheles darlingi, the primary vector of Falciparum
malaria in the Peruvian Amazon. Am. J. Trop. Med. Hyg. 74, 3–11 (2006).
16. Vittor, A. Y. et al. Linking Deforestation to Malaria in the Amazon: Characterization of the Breeding Habitat of the Principal Malaria Vector, Anopheles darlingi. Am. J. Trop. Med. Hyg. 81, 5–12 (2009).
17. Tucker Lima, J. M., Vittor, A., Rifai, S. & Valle, D. Does deforestation promote or inhibit malaria transmission in the Amazon? A systematic literature review and critical appraisal of current evidence. Philos. Trans. R. Soc. B Biol. Sci. 372, 20160125 (2017). 18. Chuquiyauri, R. et al. Socio-demographics and the development of malaria elimination strategies in the low transmission setting.
Acta Trop. 121 (2012).
19. Rosas-Aguirre, A. et al. Micro-heterogeneity of malaria transmission in the Peruvian Amazon: A baseline assessment underlying a population-based cohort study. Malar. J. 16 (2017).
20. Casapía, M. et al. Mejora en el diagnóstico y tratamiento oportuno de malaria con el uso de pruebas rápidas por promotores de salud en la Amazonía peruana. Rev. Peru. Med. Exp. Salud Publica 25, 361–368 (2008).
21. Brierley, C. K., Suarez, N., Arora, G. & Graham, D. Healthcare Access and Health Beliefs of the Indigenous Peoples in Remote Amazonian Peru. Am. J. Trop. Med. Hyg. 90, 180–183 (2014).
22. Weiss, D. J. et al. inequalities in accessibility in 2015. Nat. Publ. Gr., https://doi.org/10.1038/nature25181 (2018).
23. Aramburú Guarda, J., Ramal Asayag, C. & Witzig, R. Malaria reemergence in the Peruvian Amazon Region. Emerg. Infect. Dis. 5, 209–215 (1999).
24. Grietens, K. P. et al. Traditional nets interfere with the uptake of long-lasting insecticidal nets in the Peruvian Amazon: the relevance of net preference for achieving high coverage and use. PLoS One 8, e50294 (2013).
25. Grietens, K. P. et al. Adherence to 7-day Primaquine Treatment for the Radical Cure of P. vivax in the Amazon Region. Am.J.Trop.
Med Hyg. 82, 1017–1023 (2015).
26. Markham, B. Forty-Year Calibrated Record of Earth-Surface Reflected Radiance from Landsat: A Review. 1–52 (2019).
27. Woodcock, C. E. et al. The global Landsat archive: Status, consolidation, and direction Remote Sensing of Environment The global Landsat archive: Status, consolidation, and direction. Remote Sens. Environ. 185, 271–283 (2016).
28. Hall, O. Remote sensing in social science research. Open Remote Sens. J. 3, 1–16 (2010).
29. Stevens, F. R., Gaughan, A. E., Linard, C. & Tatem, A. J. Disaggregating Census Data for Population Mapping Using Random Forests with Remotely-Sensed and Ancillary Data. 1–22, https://doi.org/10.1371/journal.pone.0107042 (2015).
30. Thenkabail, P. S. Remote sensing handbook: Remote sensing of water resources, disasters, and urban studies. Remote Sensing of Water
Resources, Disasters, and Urban Studies 3 (2015).
31. Elith, J., Leathwick, J. R. & Hastie, T. A working guide to boosted regression trees. J. Anim. Ecol. 77, 802–813 (2008).
32. Ashby, J., Moreno-Madriñán, M., Yiannoutsos, C. & Stanforth, A. Niche Modeling of Dengue Fever Using Remotely Sensed Environmental Factors and Boosted Regression Trees. Remote Sens. 9, 328 (2017).
33. Kabaria, C. W. et al. Mapping intra - urban malaria risk using high resolution satellite imagery: a case study of Dar es Salaam. Int. J.
Health Geogr. 1–12, https://doi.org/10.1186/s12942-016-0051-y (2016).
34. Messina, J. P. et al. Mapping global environmental suitability for Zika virus. Elife 5, 1–19 (2016). 35. Pigott, D. M. et al. Updates to the zoonotic niche map of Ebola virus disease in Africa. Elife 5, 1–13 (2016).
36. Cheong, Y. L., Leitão, P. J. & Lakes, T. Assessment of land use factors associated with dengue cases in Malaysia using boosted regression trees. Spat. Spatiotemporal. Epidemiol. 10, 75–84 (2014).
37. INEI. Censos Nacionales 2017: XII de Población, VII de Vivienda y III de Comunidades Indígenas. 43 (2017). 38. Tanser, F. Innova t ions (GIS) Innovations For Primary Health Care in Developing Countries. 106–122 (2006). 39. Eastman, J. Multi-criteria evaluation and GIS. Geogr. Inf. Syst. 493–502 (1999).
40. INEI. Ficha técnica empadronamiento distrital de población y vivienda 2013 Empadronamiento Distrital de Población y Vivienda 2013. 2013, 3–4 (2013).
41. CDC-MINSA/Peru. Boletín epidemiológico del perú. (2017).
42. Omumbo, J. A., Hay, S. I., Snow, R. W., Tatem, A. J. & Rogers, D. J. Modelling malaria risk in East Africa at high-spatial resolution.
Trop. Med. Int. Heal. 10, 557–566 (2005).
43. Patz, J. A. et al. Predicting key malaria transmission factors, biting and entomological inoculation rates, using modelled soil moisture in Kenya. Trop. Med. Int. Heal. 3, 818–827 (1998).
44. Gorelick, N. et al. Remote Sensing of Environment Google Earth Engine: Planetary-scale geospatial analysis for everyone. Remote
Sens. Environ. 202, 18–27 (2017).
45. Pekel, J. F., Cottam, A., Gorelick, N. & Belward, A. S. High-resolution mapping of global surface water and its long-term changes.
Nature 540, 418–422 (2016).
46. Bruy, A. & Svidzinska, D. QGIS by example. (PACKT, 2015).
47. Menke, K., Davis, P. & Ebooks Corporation. Mastering QGIS: go beyond the basics and unleash the full power of QGIS with practical,
step-by-step examples. Community experience distilled.
48. Hansen, M. C. et al. High-Resolution Global Maps of of 21st-Century Forest Cover Change. 134, 850–854 (2013).
49. Simpson, J., Adler, R. F. & North, G. R. A Proposed Tropical Rainfall Measuring Mission (TRMM) Satellite. Bull. Am. Meteorol. Soc.
69, 278–295 (1988).
50. Cuéllar, A. C. Uso De Sensores Remotos Para La Predicción De Casos De Malaria En El Departamento Orán, Salta, Argentina. 95 (2014).
51. Szabó, S., Gácsi, Z. & Balázs, B. Specific features of NDVI, NDWI and MNDWI as reflected in land cover categories. Landsc. Environ.
10, 194–202 (2016).
52. Jensen, J. R. Remote sensing of the environment: an earth resource perspective. Prentice Hall, Upper Saddle River, NJ 1 (2000). 53. Hantson, S. et al. Cadena de pre-procesamiento estándar para las imágenes Landsat del Plan Nacional de Teledetección. Rev.
Teledetección 36, 51–61 (2011).
54. Myneni, R. B., Ganapol, B. D. & Asrar, G. Remote sensing of vegetation canopy photosynthetic and stomatal conductance efficiencies. Remote Sens. Environ. 42, 217–238 (1992).
55. da Costa Gurgel, H. A utilização das geotecnologias em estudos epidemiologicos: o exemplo da relação entre a malária e o NDVI em Roraima. An. XI SBSR, Belo Horizonte, Bras. 05 - 10 abril 2003, INPE 1303–1310 (2003).
56. Tourre, Y. M., Jarlan, L., Lacaux, J.-P., Rotela, C. H. & Lafaye, M. Spatio-temporal variability of NDVI–precipitation over southernmost South America: possible linkages between climate signals and epidemics. Environ. Res. Lett. 3, 044008 (2008). 57. Goward, S. N., Markham, B., Dye, D. G., Dulaney, W. & Yang, J. Normalized difference vegetation index measurements from the
advanced very high resolution radiometer. Remote Sens. Environ. 35, 257–277 (1991).
58. Gillespie, A. Land Surface Temperature. Encycl. Remote Sens. 314–319, https://doi.org/10.1007/978-0-387-36699-9_79 (2014) 59. Saha, S. K. Retrieval of Agrometeorological parameters using satellite data. In Satellite Remote Sensing and GIS Applications in
Meteorology 151–174 (2004).
60. Zeilhofer, P., Soares, E., Ribeiro, A. L. M., Miyazaki, R. D. & Atanaka, M. Habitat suitability mapping of Anopheles darlingi in the surroundings of the Manso hydropower plant reservoir. Mato Grosso, Central. 14, 1–14 (2007).
61. Hiwat, H. & Bretas, G. Ecology of Anopheles darlingi Root with respect to vector importance: A review. Parasites and Vectors 4, 1–13 (2011).
62. Gareth James, Daniela Witten, Trevor Hastie, R. T. An Introduction to Statistical Learning with Applications in R. 63. Elith, A. Boosted Regression Trees in R. Biometrics 2008, 1–15 (2008).
64. Greenwell, B., Boehmke, B., Cunningham, J. & GBM Developers. Generalized Boosted Regression Models. (2018).
65. Hijmans, R. J., Phillips, S., Leathwick, J. R. & Elith, J. Dismo package for R, version 1.1-4, https://doi.org/10.1016/j. jhydrol.2011.07.022 (2017).
66. Brock, P. M. et al. Predictive analysis across spatial scales links zoonotic malaria to deforestation (2019).
67. Artois, J. et al. Changing geographic patterns and risk factors for avian influenza A(H7N9) infections in humans, China. Emerg.
Infect. Dis. 24, 87–94 (2018).
68. Greenwell, B. M. pdp: An R Package for Constructing Partial Dependence Plots. 9, 421–436 (2017).
69. Sturrock, H. J. W. et al. Mapping Malaria Risk in Low Transmission Settings: Challenges and Opportunities. Trends Parasitol. 32, 635–645 (2016).
70. Tusting, L. S., Bousema, T., Smith, D. L. & Drakeley, C. Measuring changes in Plasmodium falciparum transmission: Precision, accuracy and costs of metrics. Adv Parasitol 1–48, https://doi.org/10.1016/B978-0-12-800099-1.00003-X.Measuring (2016). 71. Roll Back Malaria & & Partnership. Framework for Monitoring Progress and Evaluating Outcomes and Impact. Geneva: RBM; 2000. 72. White, N. J. Determinants of relapse periodicity in Plasmodium vivax malaria Determinants of relapse periodicity in Plasmodium
vivax malaria. 297 (2011).
73. Howes, R. E. et al. Global epidemiology of Plasmodium vivax. Am. J. Trop. Med. Hyg. 95, 15–34 (2016). 74. COEN-INDECI. Inundación afecta a la provincia de Putumayo - Loreto. 1–10 (2016).
75. PAHO. Inundaciones en Loreto: Respuesta del Sector de Agua, Saneamiento e Higiene - Experiencias y aprendizajes. PAHO (2013). 76. Reach-Initiative. 2012 Flood Events, PERU. (2012).
77. SEHINAV. Boletín de avisos a los navegantes fluviales - SERVICIO DE HIDROGRAFÍA Y NAVEGACIÓN DE LA AMAZONÍA. (2015).
78. Prussing, C. et al. Malaria vector species in Amazonian Peru co-occur in larval habitats but have distinct larval microbial communities. PLoS Negl. Trop. Dis. 13, e0007412 (2019).
79. Rosas-Aguirre, A. et al. Hotspots of malaria transmission in the Peruvian amazon: Rapid assessment through a parasitological and serological survey. PLoS One 10, 1–21 (2015).
80. Guo, M., Li, J., Sheng, C., Xu, J. & Wu, L. A Review of Wetland Remote Sensing. 1–36, https://doi.org/10.3390/s17040777 (2017). 81. Rejmánková E, Grieco J, Achee N R. D. Ecology of Larval Habitats. In: Manguin S, editor. Anopheles mosquitoes—New insights into
malaria vectors.
82. Barros, F. S. M. & Honório, N. A. Deforestation and Malaria on the Amazon Frontier: Larval Clustering of Anopheles darlingi (Diptera: Culicidae) Determines Focal Distribution of Malaria. 93, 939–953 (2015).
83. Arruda, M. E. & Gurgel, H. Spatial clustering and longitudinal variation of Anopheles darlingi (Diptera: Culicidae) larvae in a river of the Amazon: the importance of the forest fringe and of obstructions to flow in frontier malaria, https://doi.org/10.1017/ S0007485311000265 (2011).
84. Id, A. D., Fennie, K., Degarege, D., Id, S. C. & Madhivanan, P. Improving socioeconomic status may reduce the burden of malaria in sub Saharan Africa: A systematic review and meta-analysis. 1–26 (2019).
85. Zhang, L. V. A. X. et al. Spatio-temporal rainfall variability in the Amazon basin countries (Brazil, Peru, Bolivia, Colombia, and Ecuador). Int. J. Climatol. 29, 317–319 (2009).
86. MINSA. Resolución Ministerial N° 244-2017-MINSA. 12–13 (2017).
Acknowledgements
This study was funded by the Peruvian National Council of Science - CONCYTEC (008-2014-FONDECYT) and the Académie de Recherche et d’Enseignement Supérieur - Commission de la Coopération au Développement of Belgium (ARES-CCD, PRD-Peru 2014–2019). Thanks to Nathalie Malève and Yulissa Vasquez for general support, and to Bruce Millies for English corrections.
Author contributions
Conceptualization, E.S.-V. and A.R.-A.; Remote sensing data collection, E.S.-V. and J.J.P.-G.; Remote Sensing Processing, E.S.-V. and A.R.-A.; Geo-codification process, E.S.-V. W.V., D.M-G. and A.R.-A.; Methodology, E.S.-V., W.V. and A.R.-A.; Codes elaboration, E.S.-V., W.V. and A.R.-A.; Formal analysis, E.S.-V., W.V. and A.R.-A.; Visualization, E.S.-V. and V.W.; Validation, C.L., P.L, M.-P.H., N.S. and A.R.-A.; Project administration, A.L.-C. and A.R.-A.; Funding acquisition, M.-P.H., N.S. and A.R.-A. Supervision, M.-P.H.; N.S. and A.R.-A.; Writing-original draft, E.S.-V. and A.R.-A.; Writing-review & editing, E.S.-V. W.V., P.M., C.L. and A.R.-A. All authors read and approved the final manuscript.
competing interests
The authors declare no competing interests.
Additional information
Supplementary information is available for this paper at https://doi.org/10.1038/s41598-019-51564-4. Correspondence and requests for materials should be addressed to E.S.-V.
Reprints and permissions information is available at www.nature.com/reprints.
Publisher’s note Springer Nature remains neutral with regard to jurisdictional claims in published maps and institutional affiliations.
Open Access This article is licensed under a Creative Commons Attribution 4.0 International License, which permits use, sharing, adaptation, distribution and reproduction in any medium or format, as long as you give appropriate credit to the original author(s) and the source, provide a link to the Cre-ative Commons license, and indicate if changes were made. The images or other third party material in this article are included in the article’s Creative Commons license, unless indicated otherwise in a credit line to the material. If material is not included in the article’s Creative Commons license and your intended use is not per-mitted by statutory regulation or exceeds the perper-mitted use, you will need to obtain permission directly from the copyright holder. To view a copy of this license, visit http://creativecommons.org/licenses/by/4.0/.