HAL Id: tel-02931886
https://tel.archives-ouvertes.fr/tel-02931886
Submitted on 7 Sep 2020
HAL is a multi-disciplinary open access archive for the deposit and dissemination of sci-entific research documents, whether they are pub-lished or not. The documents may come from teaching and research institutions in France or abroad, or from public or private research centers.
L’archive ouverte pluridisciplinaire HAL, est destinée au dépôt et à la diffusion de documents scientifiques de niveau recherche, publiés ou non, émanant des établissements d’enseignement et de recherche français ou étrangers, des laboratoires publics ou privés.
Study of the effect of organic waste products
amendments (OWPs) and microbial diversity on volatile
organic compounds (VOCs) emissions by soil
Letizia Abis
To cite this version:
Letizia Abis. Study of the effect of organic waste products amendments (OWPs) and microbial diversity on volatile organic compounds (VOCs) emissions by soil. Ecology, environment. Sorbonne Université, 2019. English. �NNT : 2019SORUS443�. �tel-02931886�
Sorbonne Université
Ecole doctorale 129 Science de l’environnement
INRA UMR 1402 ECOSYS Écologie fonctionnelle et écotoxicologie des agroécosystèmes
Study of the effect of organic waste products amendments and
microbial diversity on volatile organic compounds emissions
by soil
Par Letizia ABIS
Thèse de doctorat de Science de l’environnement
Dirigée par Benjamin Loubet
Présentée et soutenue publiquement le 1 Février 2019 Devant un jury composé de :
Rapporteur Michael Staudt HDR CEFE/CRNS Montpellier Rapporteur Françoise Binet HDR ECOBIO Rennes
Examinatrice Engracia Madejón DR IRNAS-CSIC Séville Examinateur Thomas Eglin IR ADEME Angers Examinateur Jean-Marie Mouchel PR UPMC Paris Directeur de thèse Benjamin Loubet HDR INRA Grignon
A mia madre, con tutto l’amore del mondo
Summary
BACKGROUND 1
CHAPTER I 3
I. GENERAL INTRODUCTION 5
I.1 What are Volatile Organic Compounds (VOCs)? 5
I.2 The regulatory context 6
I.2.1 VOCs affect human health and crop productions 6
I.2.2 The regulatory context 6
I.3 The role of VOCs in air pollution and climate change 7
I.3.1 The atmosphere composition 7
I.3.2 Tropospheric air pollution 8
I.3.2.1 VOCs lifetime 8
I.3.2.2 The role of VOCs in ozone formation 9
I.3.2.3 VOCs as precursor of particulate matter (or secondary organic aerosol – SOA) 11
I.3.2.3 VOCs effects on air quality and climate change 12
I.4 Biogenic Volatile Organic Compounds 13
I.4.1 Main sources and sinks 13
I.4.2 Feedbacks effects of bVOC on climate 14
I.5 Soil as source and sink of VOCs 15
I.5.1 Abiotic factors affecting soil-atmosphere VOCs exchange 16
I.6 Microorganisms living in soil: structure and functions 17
I.6.1 Factors affecting microbial diversity in soil 19
I.6.2 Microorganisms and biogeochemical cycles in soil 19
I.6.3 Biosynthesis of VOCs from microorganisms 21
I.6.4 Interactions mediated by VOCs 24
I.7 Organic Waste Products (OWPs) 25
I.7.1 Effects of organic waste products amendment on soil organic matter and microbial communities 26
I.7.1.1 Long-term effects 26
I.7.1.2 Short-term effects 27
I.7.2 Effects of the organic waste products amendment on the VOCs emissions from soil 28
OBJECTIVES 29
CHAPTER II 33
II. MATERIALS AND METHODS 35
II.2 Site structure and sample collection 36
II.3 Samples preparation 38
II.4 Flux chambers 38
II.5 Microcosms preparation 40
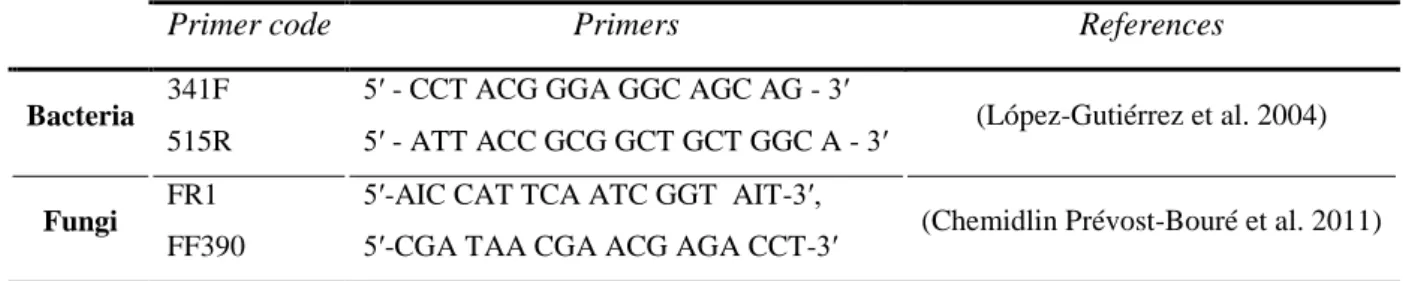
II.6 Biomolecular analysis 41
II.6.1 DNA extraction 41
II.6.2 Quantitative PCR (qPCR) 42
II.6.3 The high throughput sequencing and the bioinformatics analysis 42
II.7 Techniques for the detection of VOCs 43
II.7.1 PTR-QiTOF-MS 44
II.7.2 Peaks analyses and mass table 46
CHAPTER III 49
PROFILES OF VOLATILE ORGANIC COMPOUND EMISSIONS FROM SOILS AMENDED
WITH ORGANIC WASTE PRODUCTS 51
Graphical Abstract 51
Abstract 52
III.1 Introduction 53
III.2 Methods 55
III.2.1 Site description 55
III.2.2 Experimental setup 56
III.2.2.1 Soil analysis 56
III.2.2.2 Soil sample preparation for PTR-QiTOF-MS analysis 57
III.2.2.3 Laboratory flux chambers 57
III.2.3 VOCs analysis with the proton transfer reaction time of flight mass spectrometer (PTR-QiTOF-MS) 58
III.2.3.1 Peak detection of the mass spectra and mass calibration 59
III.2.3.2 Isotopes and fragments identification 60
III.2.3.3 PTR-QiTOF-MS mixing ratio calibration 60
III.2.3.4 VOC identification 61
III.2.4 Data analysis 62
III.3 Results 62
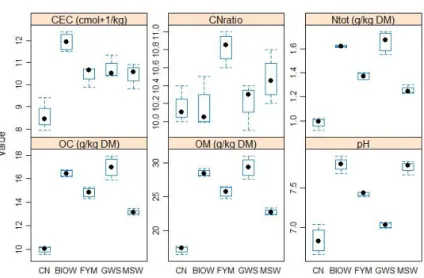
III.3.1 Soil characteristics of each treatment 62
III.3.2 VOCs Emissions 64
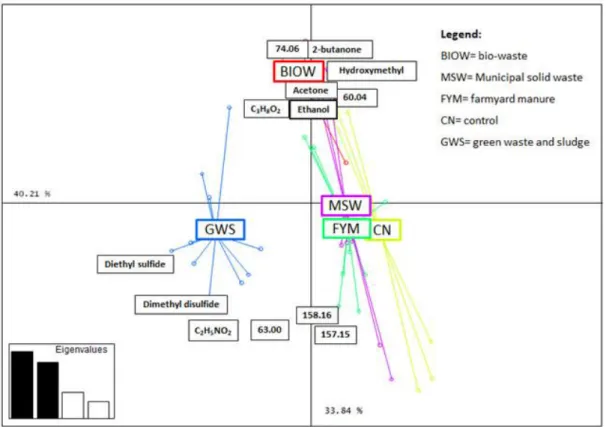
III.3.2.1 Differentiating VOCs for each treatment 65
III.4 Discussion 70
II.4.1 Identification and quantification of VOCs emitted 70
III.4.1.2 Other compounds detected 72
III.4.2 Effects of organic waste product applications on VOCs emission rates by soils 74
III.5 Conclusions 76
Acknowledgement 76
CHAPTER IV 77
VOLATILE ORGANIC COMPOUNDS EMISSIONS FROM SOILS ARE LINKED TO
MICROBIAL DIVERSITY 79
Abstract 79
IV.1 INTRODUCTION 80
IV.2 RESULTS 83
IV.2.1 Soil microbial biomass 83
IV.2.2 Microbial diversity 84
IV.2.3 VOCs emissions from manipulated soils 85
IV.3 DISCUSSION 91
IV.3.1 Microbial diversity 91
IV.3.2 Interactions between bacteria and fungi diversity 91 IV.3.3 Microbial diversity affects VOCs total emission rates 92 IV.3.4 Bacterial and fungi VOCs emissions profiles 93 IV.3.5 VOCs mediating interaction between phyla 94
IV.4 CONCLUSIONS AND PERSPECTIVES 95
IV.5 METHODS 95
IV.5.1 Sampling and site description 95 IV.5.2 Microcosms and Experimental setup 96 IV.5.3 PTR-TOF-MS detection system 96
IV.5.3.1 VOCs data analysis 97
IV.5.4 Microbial analysis 98
IV.5.4.1 DNA extraction 98
IV.5.4.2 Quantitative PCR (qPCR) 98
IV.5.4.3 High throughput sequencing of 16S and 18S rRNA gene sequences 99
IV.5.5 Statistical analysis 101
CHAPTER V 103
SHORT-TERM EFFECT OF GREEN WASTE AND SLUDGE AMENDMENT ON
MICROBIAL DIVERSITY AND VOCS EMISSIONS 105
ABSTRACT 105
V.1 Introduction 106
V.2 Methods 108
V.2.1 Sampling and site description 108
V.2.2 Microcosms preparation 108
V.2.2.1 Timing of the VOCs measurements 110
V.3 PTR-QiTOF-MS measurement set up 110
V.2.4 Microbial Analyses 111
V.2.4.1 DNA extraction 111
V.2.4.2 High throughput sequencing of 16S rRNA gene sequences 111
V.2.4.3 Bioinformatic analysis of 16S rRNA gene sequences 112
V.2.5 Statistical Analysis 113
V.2.5.1 VOCs statistical Analyses 113
V.2.5.2 Microbial statistical analyses 113
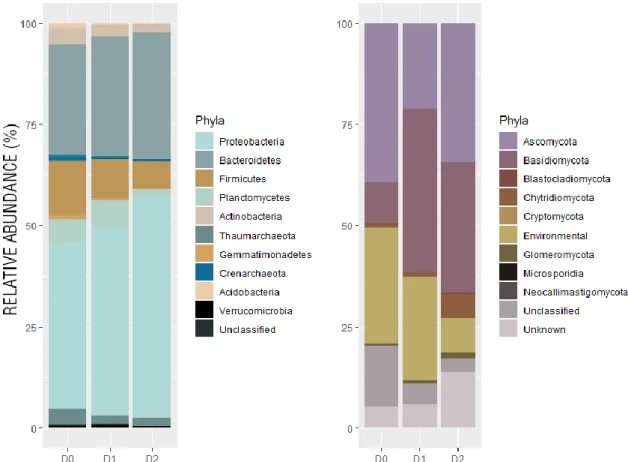
V.3 RESULTS 114
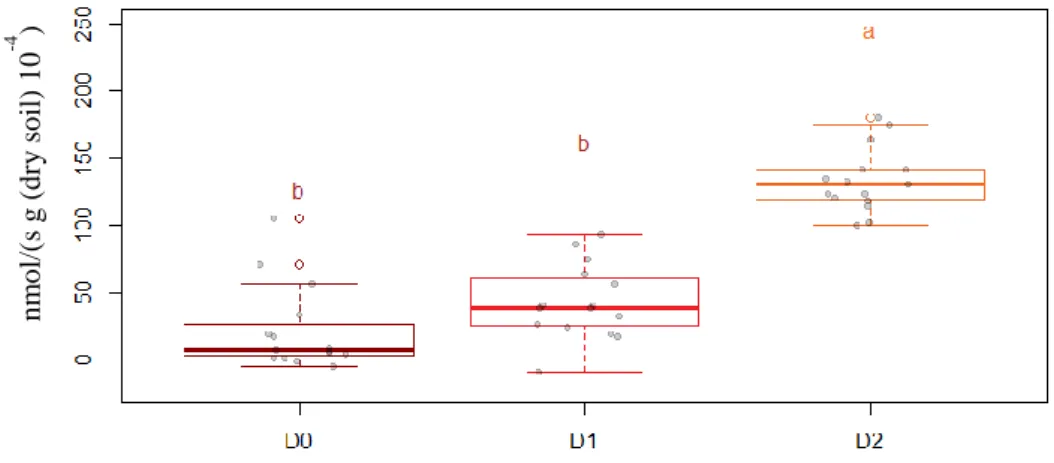
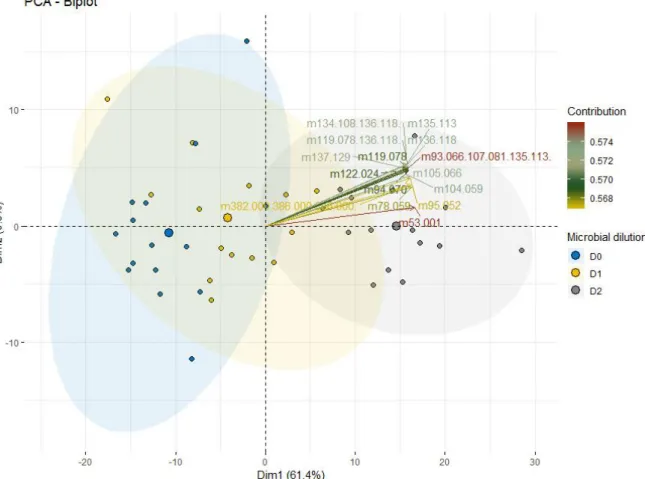
V.3.1 Microbial biomass and dilution diversity manipulation 114 V.3.2 Bacterial relative abundance 115 V.3.3 VOCs emissions from the microcosms 116
V.4 DISCUSSION 122
V.4.1 Microbial diversity manipulation 122 V.4.2 Effect of the GWS amendment on the bacterial community 122 V.4.3 Dynamics of the total VOCs emissions 123 V.4.4 Bacteria VOCs production dynamic of the most and less emitted VOCs 123
CHAPTER VI 125
VI. GENERAL DISCUSSIONS 127
VI.1 Effect of time following the OWPs application on total VOCs emissions 128 VI.2 VOCs emissions among the different microbial dilution levels 130
VI.3 Coupled effect of the OWPs and microbial dilution on VOCs emissions 132
CHAPTER VII 137
VII. CONCLUSIONS AND FUTURE PERSPECTIVES 139
ANNEX A – SUPPLEMENTARY MATERIAL CHAPTER III - PROFILES OF VOCS
EMISSIONS FROM SOIL RECEIVING DIFFERING ORGANIC WASTE PRODUCTS 141 ANNEX B – SUPPLEMENTARY MATERIAL CHAPTER IV - VOLATILE ORGANIC
COMPOUNDS EMISSIONS FROM SOILS ARE LINKED TO THE LOSS OF MICROBIAL
DIVERSITY 145
ANNEX C – SUPPLEMENTARY MATERIAL CHAPTER V - MICROBIAL VOCS DYNAMICS
AFTER GREEN WASTE AND SLUDGE AMENDMENT 151
REFERENCES 155
ILLUSTRATION SUMMARY 168
TABLES SUMMARY 172
Résumé : 174 Abstract : 174
Background
Current investigation on climate science reveals that the air quality and global temperatures are positively or negatively affected by several biogeochemical processes. The biogeochemical processes involving greenhouse gases (CO2, CH4 and N2O) have been widely
documented. However, another class of compounds, the volatile organic compounds (VOCs) family, has been widely investigated in the last decades. Despite the low VOCs concentration in the atmosphere (from part per billions - ppb to part per trillions - ppt) (Kesselmeier and Staudt, 1999), they are involved in several important reactions in the atmosphere such as: the reactions leading to the ozone (O3) formation in the troposphere (Seinfeld and Pandis, 2016),
the generation of large quantities of organic aerosols (Singh et al., 1995) or the production of the nitrates in the atmosphere (Atkinson, 2000). Those processes are directly responsible for atmospheric pollution. The consequences on the environment at a global scale, on human health and on ecosystems underline the importance, in Europe and more in general worldwide, of international agreements and investments in order to reduce and control the emissions of these pollutant gases in the atmosphere.
The purpose of this work is not to investigate how to reduce the impact of VOCs emissions in the atmosphere. Nevertheless, to reduce VOCs emissions, the study of the dynamics and the sources leading to the VOCs production is indispensable. Biogenic sources of VOCs are between 10 and 11 times higher than the VOCs emissions released from anthropogenic sources (Guenther, 1997). Amongst the most important biogenic sources of VOCs we can find plants and forests, which, at the moment are the widest studied sources of VOCs. However, recently, Bachy et al., (2016) highlighted the possibility of an overestimation of the VOCs derived from canopy compared to bare soils. Moreover, Potard et al., (2017) and Raza et al., (2017a) put forward the role played by the organic amendment on the VOCs emissions from soils. The use of organic amendment, and in particular of the organic waste products, has been widely encouraged in Europe (Europe commissions, 2010) during the last decades in order to recycle the exogenous organic matter, increase soil organic matter and partially substitute mineral fertilizers. The production of organic waste products in France is about 332 Mt per year, of which at least the 50 % return back to soil as organic amendment (ADEME, 2006). Furthermore, it has been reported that the emissions from organic waste products are potential precursors of the particulate matter formation in the atmosphere; this information underlines the need of a VOCs emissions characterization. In addition, several studies
reported that VOCs emissions from soils are strongly related to the microbial activity (Bäck et al., 2010; Mayrhofer et al., 2006; McNeal and Herbert, 2009). Despite, VOCs sources such as soil and microorganisms, are still poorly explored due to the very complexity of the ecosystem. For instance, to our knowledge, no information has been reported concerning the relationship between VOCs emissions, organic waste amendment and microbial diversity in soil. Thus, the aim of this work will be to add small pieces to the complex world of the VOCs emissions by soil and microorganisms.
Chapter I
General introduction
I. General introduction
I.1 What are Volatile Organic Compounds (VOCs)?
The article 2 of the European Council Directive 1999/13/EC of 11 March 1999 defines volatile organic compounds as:
“Volatile organic compound (VOC) shall mean any organic compound having at 293.15 K a vapour pressure of 0,01 kPa or more, or having a corresponding volatility under the particular conditions of use.”
Volatile organic compounds are molecules containing atoms of carbon and hydrogen, often bonded with halogens, oxygen, sulfur, nitrogen, or phosphorous. The wide range of molecules they can form, with different functional groups, make the ensemble of these compounds difficult to be fully detected and identified. Indeed, a large number of VOCs have not been identified yet. The fact that they have different functional groups also implies different chemical and physical properties and thus differences in terms of toxicity (Cicolella, 2008). Several families of compounds are well-defined VOCs such as: ketones, aldehydes, alcohols, nitriles, hydrocarbons, diols etc...
Sources of VOCs can be gathered in two important groups: anthropogenic sources and biogenic sources. Within the anthropogenic sources, the main ones are transportation, gas, bio-fuel, industrial and domestic solvents, house painting, glue and emissions from wastes (waste water and solid waste) (Wei et al., 2008). Anthropogenic sources contribute up to 10% of the total emissions of VOCs in the atmosphere. Emissions from biogenic sources contribute to the rest (Atkinson, 2000). Biogenic VOCs (bVOCs) are released from plants, litter, forests, animals, soil, and microorganisms. The complexity of studying bVOCs is also related to the difficulty to discriminating sources in a very complex system such as the biosphere.
It is important to underline that even if methane can be defined as VOC, the dynamics and the properties of this compound are not similar to the other compounds of the family. For this reason, generally, methane is not taken into account in VOCs studies. Therefore, in this project, we will talk about non-methane VOCs (NMVOCs). For simplicity, we will use the term VOCs for NMVOCs in this manuscript.
I.2 The regulatory context
I.2.1 VOCs affect human health and crop productions
Volatile organic compounds (VOCs) are an essential component of atmospheric chemistry that contributes to the production of pollutant harmful to the human health and the environment: ozone (O3) and secondary organic aerosols (SOA). It has been widely demonstrated that the increase in the atmosphere of O3 (Lippmann, 1993) and SOA (Davidson
et al., 2005) have significant consequences on human health and crop production. For instance, the tropospheric concentration of O3 in 2050 has been estimated to increase by 23%
(Ehhalt et al., 2001, IPCC) with a consequence of a 17% decrease on soybean crop production (Morgan et al., 2006). With the global human population currently over 6 billion and expected to reach 8 billion by 2050 (Lutz et al., 2001), assessing the impact of changing atmospheric O3 concentration on crops is crucial to maintaining food security. Moreover, in
Europe, the consequences of the SOA concentration in the atmosphere on human health has been reported as 42000 premature deaths in 2000 (CAFE-AEAT/ED51014/Baseline Issue 5, 2005) while O3 incease in the troposphere caused 21,000 premature deaths and 14,000
respiratory diseases in Europe (EU25) in 2000 (Enarson, 2013). The worrying scenarios just described led to the need for law enforcement measures to reduce the impact of O3 and SOA.
Since VOCs are precursors of the SOA and O3 they represent a source of pollution as well. I.2.2 The regulatory context
The regulatory context in France regarding VOCs emissions directly is not very restrictive. The most important regulations, resulting from the 1999 Gothenburg Protocol (ratified by France in 2007 and modified in 2012), concerned the limitation of VOCs emissions from industries and of the VOCs concentration in consumer products. However, fine particles (PM 2.5) are subject to very restrictive regulations. France must ratify the limitation imposed by the European "air quality" directive (2008/50/EC). To achieve these objectives, France has implemented the plan to reduce emissions of atmospheric pollutants (PREPA, established in 2003) supplemented by the Particulate Matter Plan (2010). The plan has the purpose of reducing particulate matter and is complemented at a local level by atmospheric protection plans and regional climate-air-energy schemes.
I.3 The role of VOCs in air pollution and climate change
I.3.1 The atmosphere composition
The atmosphere is divided into four layers of varying thickness. The boundaries between these layers have been set according to temperature discontinuities and altitude (Figure I-1). From the Earth's surface, the atmosphere is composed of the troposphere (0-10 km), stratosphere (12-50 km), mesosphere (50-80 km) and thermosphere (above 90 km altitude). The O3 layer is found within the stratosphere. O3 layer absorbs high-energy ultraviolet (UV)
(λ <290 nm) light from the Sun, converting the UV energy into heat. The troposphere is the densest layer and contains up to 75% of the mass of the atmosphere. The troposphere is composed of 78% N2, 21% O2, 1% Ar, a varying concentration of water vapour, CO2
(between 350 and 450 ppm), and trace gases. The presence of O3 in the troposphere is due to
the net downward of O3 by eddy diffusion from the stratosphere and to the interaction of
VOCs, NOx, and sunlight (Roelofs and Lelieveld, 1997). Furthermore, within the troposphere,
there is as a suspension of fine solid or liquid particles named particulate matter or aerosols. To our knowledge, all reactions involving VOCs occurs within the troposphere.
Figure I-1. Layers of the atmosphere (Source:
I.3.2 Tropospheric air pollution
Air pollution is defined as a condition in which substances resulting from anthropogenic
activities have tropospheric concentrations higher than a certain threshold, and that has measurable and undesirable effects on humans, animals, vegetation, or more generally on ecosystems. VOCs contribute to air pollution through several cycles where they interact with other elements within the troposphere. The purpose of this paragraph is to describe the different cycles producing harmful air pollutants that involve VOCs.
I.3.2.1 VOCs lifetime
VOCs compounds range from low to highly reactive molecules. Once in the atmosphere, their lifetime can be quite short. Table I-1 reports the lifetime of the most abundant VOCs in the atmosphere due to the reaction with OH, NO3 radicals, O3 and as a result of photolysis.
We see in Table I-1 that while terpenoids and acetaldehyde are very reactive with OH and NO3 and have lifetimes smaller than a few hours, acetone and methanol are quite stable with
regards to reaction with OH, NO3, and O3. We should, however, stress that methanol and
acetone are very soluble gases and can readily be adsorbed to wet surfaces including cloud droplets.
VOCs
Life time due to Biogenic Emissions TgC yr-1± sd OH1 NO3 2 O3 3 Photolysis4
Isoprene 594 ± 34 1.4h 50 min 1.3 day
Monoterpenes 95 ± 3 2.7h 5 min 1.9h
Acetone 37 ± 1 53 day >11 years ~60 day
Acetaldehyde 19 ± 1 8.8 h 17 days >4.5 years 6 day
Methanol 130 ± 4 12 day 1 year
Table I-1. Lifetime of the most abundant VOCs in the atmosphere reacting with OH radical, NO3
radical O3 and due to the photolysis. NA= not available, sd=standard deviation (Atkinson, 2000;
Guenther et al., 2006; Sindelarova et al., 2014).
1 For a 12-h daytime average OH radical concentration of 2.0 x 10⁶ molecule cm-3 2 For a 12-h nighttime average NO
3 radical concentration of 5.0 x 10⁸ molecule cm-3 3 For a 24-h average O
3 concentration of 7.0 x 10¹¹ molecule cm-3 4 For overhead sun
I.3.2.2 The role of VOCs in ozone formation
The key reactive species in the troposphere is the hydroxyl radical (OH). Since it does not react with O2, its lifetime in the troposphere is long enough to allow the reaction with all
organic molecules excluding chlorofluorocarbons and halons not containing H atoms. OH radical is the primary oxidizing species in the troposphere. The following equations describe the tropospheric mechanisms leading to OH formation.
Thanks to the photolysis of O3 excited singlet oxygen, O (1D), or ground states O are formed:
𝑎) 𝑂3+ ℎυ → 𝑂2 + 𝑂( 𝐷)1
or (Equation 1) 𝑏) 𝑂3+ ℎυ → 𝑂2+ 𝑂
The ground state O combines with O2 to form O3:
𝑂2+ 𝑂 + 𝑀 → 𝑂3+ 𝑀 (Equation 2)
The equation 1b and 2 lead to no O3 production. Moreover, O (1D) most often reacts with N2
or O2 removing the excited state of the singlet and becoming a ground state O.
𝑂( 𝐷)1 + 𝑀 → 𝑂 + 𝑀 (Equation 3) So most of the time null cycles are produced (Eqns 1b and 2 or 1a, 3 and 2). However, occasionally, the excited singlet O(1D) collides with a water molecule producing 2 OH: 𝑂( 𝐷)1 + 𝐻2𝑂 → 2𝑂𝐻 (Equation 4)
The OH radical is involved in the formation of O3 by reacting with VOCs. Two possible
pathways for the O3 formation exist: the NOx reactions with Ox and the NOx reaction with Ox
in the presence of VOCs, both are represented in Figure I- 2. The equilibrium of the reactions between NOx and Ox species do not lead to a net formation of O3 (Figure I- 2a). However,
Figure I- 2b. The degradation reactions of VOCs start with the oxidation of the VOCs by the
OH radical, leading to the formation of RO2 and HO2 radicals as intermediate products
(Figure I- 2b). The intermediate products RO2 and HO2 convert NO in NO2 following the
same scheme as in Figure I- 2a (Atkinson, 2000). Hence, the result of this second pathway is a net formation of O3 in the atmosphere.
Figure I- 2. (a) Reactions involving NOx and Ox in the ozone formation. (b) Reactions between NOx and Ox in the presence of VOC (Atkinson, 2000).
Net photochemical formation of O3 also depends on the VOC/NOx ratio. There is strong
competition for the OH radical between VOCs and NOx. A rate of VOCs/NOx of 5.5/1 leads
to an equal reaction rate of VOCs and NOx with OH. If the concentration of NOx in the
atmosphere increases and the VOC/NOx ratio becomes lower than 5.5/1, the reaction between
OH and NOx is predominant. The consequence is that OH radical reacts less in the VOCs
oxidation cycle (since there is less availability of OH radical due to the higher rate of the OH-NOx reaction), reducing the O3 production. However, if the VOC/NOx rate is higher than 5.5/1
the OH-VOCs reactions are predominant and the production of O3 increases. In conclusion,
VOCs are not only involved in the tropospheric ozone production but they are able to shift the balance of the null cycle described in Figure 2a leading to a net O3 formation (Seinfeld and
Pandis, 2016) .
I.3.2.3 VOCs as precursor of particulate matter (or secondary organic aerosol – SOA)
Within the troposphere, we can find aerosol particles. These aerosols play a crucial role in many atmospheric processes, both regarding climate and atmospheric reactivity. Aerosol particles are classified into two categories, according to their formations: (i) primary particles, which are emitted directly into the atmosphere in solid or liquid form and (ii) secondary particles, which are formed by reactions between precursors in the atmosphere. According to their size, particles are classified into three categories (Figure I-3): ultrafine particles, having an aerodynamic diameter less than 0.01 μm; fine particles, having an aerodynamic diameter between 0.01 and 1 μm; large particles, with an aerodynamic diameter greater than 2.5 μm. Particle nucleation from gaseous precursors is the base mechanism of the formation of new atmospheric particles. The size of the particles formed is in the order of 10-3 to 10-2 μm. The lifetime of these particles is usually less than five hours. These particles will quickly increase in size to give birth to fine particles by coagulation or condensation processes (Figure I-3). They are still too small to sediment and their lifetime in the atmosphere is about a few days. They are eliminated mainly by washing or by incorporation in liquid droplets. Largest particles are mainly emitted by soil erosion, as well as by plants (pollens and spores). They are generally removed by sedimentation.
Figure I-3. Production, growth, and removal of atmospheric aerosols. (Jacob, 2000)
VOCs oxidation in the troposphere leads to the formation of lower volatile organic products. The addition of oxygen and nitrogen to organic compounds reduce their volatility
and so do the addition of alcohol, aldehydes, ketone, and nitro groups; in these cases, the volatility can be reduced by several orders of magnitude. These semi-volatile organic compounds can efficiently initiate particle formation (Lee et al., 2006). The reactions explained in paragraph 2.1 between VOC, OH and NOx can potentially all lead to the secondary organic aerosol formation. The ability of a VOC to form SOA depends on its concentration in the atmosphere, its chemical reactivity and on the volatility of its oxidation products (Williams and Koppmann, 2007).
I.3.2.3 VOCs effects on air quality and climate change
It has been widely demonstrated that high ozone concentration in the troposphere, SOA formation and the methane lifetime augmentation due to the presence of VOCs (William et al. 2013) all contribute significantly to the earth radiating balance. Hence, VOCs emissions are directly and indirectly involved in climate change as well as air pollution and thus on human and ecosystem health. All the reactions involving VOCs emissions explained in paragraph I.3 have different consequences on air quality.
First, tropospheric O3 is a greenhouse gas which anthropogenic origin accounts
for 0.25 W m-2 (IPCC 5th report). Furthermore, several consequences on human health have been reported. O3 in the troposphere also leads to adverse health effects such as throat and eye
irritation, headache, fatigue, and nausea (Lippmann, 1993).
SOA are precursor of cloud condensation nuclei (CCN)5, responsible for scattering and absorbing solar and terrestrial radiation. The formation of clouds influences the radiation budget of the earth by absorbing direct solar radiations leading to a cooling effect (IPCC 5th report). Aerosols also scatter solar radiation leading to an increased diffusive radiation which can increase CO2 fixation by canopies (Niyogi, 2004). Consequences of PM2.5 (particulate
matter with a diameter smaller than 2.5 µm) on human health have been reported. These small particles can irritate the respiratory system and promote respiratory diseases responsible for increased mortality (Atkinson et al., 2014).
At first, VOCs emissions were studied as compounds emitted from anthropological activities. During the last decades, literature underlined the importance of the biological
5 Cloud condensation nuclei (CCN) are small particles (0.2 μm) on which water vapor condenses and they are
sources of VOCs, which contribute up to 90% of the total emission rate. Next paragraph will be focused on the description of the biogenic type of VOCs emissions in the atmosphere.
I.4 Biogenic Volatile Organic Compounds
The biosphere produces biogenic gases including volatile compounds other than carbon monoxide, carbon dioxide, and methane, called biogenic Volatile Organic Compounds (bVOCs). This classification allows differentiating the VOCs released from biogenic sources to the anthropogenic ones. BVOCs emissions represent the largest VOC source with an estimated annual emissions amount of 760 Tg (C) yr−1. If we consider that global total carbon monoxide emissions (CO) is 90 Tg (C) yr−1, we can notice that the impact of the VOCs emissions in the atmosphere is between 8 and 9 times higher than CO emissions (Sindelarova et al., 2014). Nevertheless, bVOCs fluxes contribute up to 5-10% of the total net carbon exchange between the biosphere and the atmosphere (Peñuelas, 2003). Chemical compounds included in the BVOCs family are: isoprenoids such as isoprene (contributing up to 69% total BVOCs emissions) and monoterpenes (contributing up to 11% total BVOCs emissions), methanol (6%), acetone (3%), sesquiterpenes (2.5%) and other BVOC species each contributing less than 2% (Sindelarova et al., 2014).
I.4.1 Main sources and sinks
The predominant source of biogenic VOCs emissions is the terrestrial vegetation, which includes plant, forests, and grassland as well as anthropogenically induced vegetation such as crops. Forests contribute up to 55% of the total bVOCs emissions (Karl et al., 2009), while crops contribute up to 27% in Europe (Karl et al., 2009). Another bVOCs source is the ocean. The total bVOCs emissions estimation from oceans is between 37 and 148 Tg y-1 (Abbatt, 2000). Oceans can be considered as sinks as well; they have the capacity to store acetone and methanol with an estimated deposition rate of 0.10 cm s−1 and 0.08 cm s−1 respectively (Singh et al., 2003). Soil and microorganisms are considered as sources and sinks as well, and since they are the object of the entire manuscript, a detailed description of the VOCs emissions from those sources will be given in chapter I.V.
I.4.2 Feedbacks effects of bVOC on climate
Lately, bVOCs gained attention because of their pivotal role in climate changes. In the past, bVOCs were precluded from having a significant role on climate change because of their short lifetime in the atmosphere. It is now clear that the increase of bVOCs due to the warming and global change have direct and indirect effects on the greenhouse gas budgets (Peñuelas and Staudt, 2010). Indeed, stresses linked to climate changes (i.e., heat and drought) or other type of environmental stresses (i.e., insect infestations) affect the composition and quality of the VOCs emissions. For instance, Zhao et al., 2017, studied the type of VOCs emissions emitted from a boral forest under unstressed and stressed conditions. VOCs emissions from unstressed condition were dominated by isoprene and monoterpenes. Isoprene and monoterpenes were found to affect the size of the SOA particles (Figure I-4). Under stressed condition, VOCs emissions were dominated by sesquiterpenes. Sesquiterpenes were found to influence the higroscopicity of the SOA particles. The size and the higroscopicity of the SOA particles are crucial factors on the cloud condensation nuclei (CCN) formation. This study concluded that the CCN formation by SOA due to changes in biogenic VOC emissions, will influence cloud formation, and ultimately impact climate (Figure I-5). (Zhao et al., 2017).
Figure I-6.Interactions between environmental conditions, biogenic volatile organic compounds emissions, secondary organic aerosol, cloud formation and climate as potential feedback loops. VOC constitutive (unstressed conditions) = higher emission rate of isoprene and monoterpenes,
VOC induced (stressed conditions) = higher emission rate of sesquiterpenes, k=hygroscopicity (Zhao et al., 2017).
Biogenic VOCs are also involved in the reactions explained in paragraph 3.2.2 leading to the ozone formation. Furthermore, bVOCs react with the ozone thus contributing to its consumption as well. Nevertheless, the net formation of O3 depends mainly on the VOC/NOx
ratio (see paragraph 3.2.2 for more details). Besides, bVOCs emissions are likely to indirectly increase other greenhouse gasses (i.e., methane) impoverishing OH radical concentration in the atmosphere. OH radicals are very reactive oxidants and act as the primary cleansing agent for the atmosphere (Lelieveld et al., 2008).
Several studies have been focused on bVOCs emissions by plants and forests. These sources of VOCs are considered the most important because of the higher VOCs flux emitted (Kesselmeier and Staudt, 1999). Recently, other bVOCs sources gained attention because of their possible underestimated contribution on the total bVOCs emissions (Bachy et al., 2016). Those sources are soil and microorganisms, and they will be detailed in the following paragraphs.
I.5 Soil as source and sink of VOCs
Soil emits VOCs between 1-2 orders of magnitude less than vegetation. BVOCs from soil are the result of multiple abiotic and biotic processes. Biotic processes leading to the bVOCs emissions in soils are the decomposition of litter and dead organic material, and the metabolism of microorganisms living in soil and on roots. Furthermore, VOCs mediate the interactions between organisms living in the soil. An overview of the interactions mediated by VOCs in soil is represented in Figure I-7. Since VOCs are often the result of complex interactions, understanding the processes leading to their emissions is challenging. For example, root exudate and litter increase the microbial activity in soil; this can lead to a shift in the consumption or production of VOCs in soil (Rinnan et al., 2013). Moreover, it was shown that other abiotic factors affect the VOCs emissions from soil such as water content, nutrient availability and temperature (Asensio et al., 2007b).
Figure I-7. Illustration of the complexity of VOCs exchanges in soil. rVOCs = emissions from plants roots, mVOCs = emissions from microorganisms, fVOCs = fungi VOCs emissions. Red lines indicate negative effects (like inhibition of growth, toxicity), while positive effects are indicated by the green
arrows (i.e. growth promotion). Blue lines represent the flux of VOCs emitted by soil (reproduced from Peñuelas et al., 2014).
I.5.1 Abiotic factors affecting soil-atmosphere VOCs exchange
VOC fluxes, even if biotic sources produce them, are dependent on abiotic factors affecting the concentration gradient between the soil and the atmosphere. VOC transfer in the soil indeed follows molecular diffusion mechanisms driven by the concentration gradient, which leads to a flux directed from high concentrated zone to a less concentrated one. However, VOCs transfer in soils is also affected by adsorption mechanisms onto water, and the mineral and organic fraction of soil. The VOCs equilibrium between liquid and gaseous phase in soil follows the Henry’s law: in thermodynamical equilibrium, the gas quantity dissolved in the liquid phase is proportional to the pressure of the VOCs on the liquid surface. The concentration gradient depends on soil porosity, pore water content, organic carbon fraction, pH, soil particles distribution depending on the type of soil (Uteau et al., 2013) and is finally affected by the chemical properties of the VOC (Williams et al., 1996). Another
important factor is the soil organic matter, which, changing the soil porosity, affects the gas diffusivity (Hamamoto et al., 2012). Besides, high water content in pores boosts the emissions of non-soluble VOCs, while, in dry conditions, soluble VOCs will mainly be retained (Provoost et al., 2011). The percolation threshold which represents the air content in soil at which diffusive gas transport decrease due to water pore blockage, is known to be higher in organic soils than in mineral6 ones (Freijer, 1994). Soil properties and soil composition also affect the VOCs emissions and absorption in soil. Ruiz et al. (1998) studied the absorbing VOCs potential of clay, sand, and limestone. This study demonstrated that for the 8 VOCs analyzed (n-hexane, n-heptane, n-octane, toluene, p-xylene, m-xylene, ethylbenzene, and methyl ethyl ketone) clay absorbed a higher rate of VOCs. Approximatively, clay absorbs an order of magnitude more than sand and two orders of magnitude more than limestone (Ruiz et al., 1998).
Furthermore, Serrano and Gallego, (2006) studied the absorption of 25 VOCs compounds in alkaline and acid agricultural soils. They reported a higher absorption in alkaline soils than acid ones and a positive correlation between the content of organic carbon in soil and the absorption of VOCs for alkaline soil while for the acid ones VOCs absorption decreases with organic carbon content.
I.6 Microorganisms living in soil: structure and functions
The soil is a highly complex, heterogeneous, and nutrient-limited habitat consisting of a mixed organic-mineral matrix with liquid and gaseous pores, owning the highest microbial diversity on earth (Jangid et al., 2010). The range of microbial biomass in soil goes from 1 T ha-1 to 10 T ha-1 representing a considerable fraction of the biomass on Earth (Fierer et al., 2007). The diversity of terrestrial microbial communities is complex and variable at different levels of biological organization. It includes genetic variability within taxa (species), number (richness) and relative abundance of taxa (evenness) as well as functional groups within the community (Torsvik and Øvreås, 2002). Microorganisms colonizing soil are bacteria, archaea, nematodes, protozoa, and fungi. Besides, it has been estimated that only a very small fraction
6 Soils with organic content < 3 % are defined mineral soils, soils with organic content >3% and <15%, are
classified as mineral soils with organics; when the organic content exceeds 15% but < 30% they are called
of the microorganisms colonizing soil is known. For bacteria and fungi we know 13000 and between 18000-35000 species respectively which correspond to 1-2 % of the total estimated species (Barrios, 2007).
Microorganisms are especially abundant in the narrow region of soil attached to plant roots, the rhizosphere. They are essential in soil ecosystem due to their essential role in all ecosystem functions and biogeochemical processes in soil (Baumann et al., 2013; Falkowski et al., 2008). The ecosystem services related to soil functioning driven by microorganisms are listed in Table I-2.
Microbial group Process Ecosystem service Ecosystem service category HETEROTROPHIC
BACTERIA/ARCHAEA
Organic matter breakdown, mineralization Decomposition, nutrient recycling, climate regulation, water purification Supporting and regulating PHOTOAUTOTROPHIC
BACTERIA Photosynthesis carbon sequestration Primary production, Supporting and regulating
CHEMO(LITHO)AUTOTROP HIC
Specific elemental transformations (e.g., NH+4, S−2, Fe+2,CH4oxidati
on)
Nutrient recycling, climate regulation, water
purification
Supporting and regulating
UNICELLULAR
PHYTOPLANKTON Photosynthesis carbon sequestration Primary production, Supporting and regulating
ARCHAEA
Specific elemental transformation (e.g., metals, CH4 formation, NH4+
oxidation), often in extreme habitats.
Nutrient recycling, climate regulation, carbon
sequestration
Supporting and regulating
PROTOZOA Mineralization of other microbes Decomposition, nutrient recycling, soil formation Supporting
FUNGI Organic matter breakdown and mineralization
Decomposition, nutrient recycling, soil formation, primary production (i.e.,
mycorrhizal fungi)
Supporting
VIRUSES Lysis of hosts Nutrient recycling Supporting
ALL
Production of metabolites (e.g., antibiotics, polymers), degradation
of xenobiotics, genetic transformation, and rearrangement
Production of precursors to industrial and pharmaceutical products
Provisional
ALL environmental and biotechnological Enormous diversity, versatility, applications
Educational purposes, getting students interested in science
Cultural
Table I-2. Ecosystem services and major functions of the microorganisms living in soil (Bodelier, 2011).
As Table I-2 shows, different microorganisms in soil can accomplish the same task. Species colonizing an ecosystem and contributing equally to an ecosystem function can be substituted by another. This characteristic is named functional redundancy. At first, functional
redundancy gave less importance to the preservation of microbial diversity in soils since the soil functions remained constant even if erosion of microbial diversity due to environmental stresses were noticed (Chapin et al., 1997).
However, it has been reported that microbial species, surviving a perturbation, and which supposed to have the same ability to perform a function, might not have the same competitive ability or growth rate as the original community members (Riah-Anglet et al., 2015). Furthermore, the new community shaped after a perturbation might not be able to perform the functions with the same efficiency, or finally, they might perturb directly or indirectly the activity of other population in the community (Riah-Anglet et al., 2015).
I.6.1 Factors affecting microbial diversity in soil
Generally, high-input agricultural practices decrease microbial biodiversity while the low-input practices enhance microbial diversity in soil (Girvan et al., 2003; Munyanziza et al., 1997). Lupwayi et al., (2001) has given an example recording higher microbial diversity on soils under conventional tillage than zero tillage. Furthermore, Wolińska et al., (2017), compared cultivate soils with non-cultivated soil reporting a decrease of the microbial diversity in soil up to 30% in the cultivated soil. Monoculture agricultural practice also reduced bacteria biodiversity in soil, while fungi biodiversity seems to not be affected (Liu et al., 2014). Soil microbial diversity decrease with increasing latitude and correlate positively with measures of atmospheric temperature and pH (Staddon et al., 1998). Soil microbial diversity may be lower in northern sites due to decreased productivity, nutrient limitation, and higher acidity. The diversity and abundance of soil bacteria and fungi are also reduced in the arid lands (Maestre et al., 2015).
I.6.2 Microorganisms and biogeochemical cycles in soil
The survival of plants and animal life depend on the microorganisms’ activity because of their implication on the biogeochemical cycles of carbon, nitrogen, sulfur, and other elements. In soil, microorganisms are involved on the humus formation, decomposition of plant litter and thus, energy production. An example of the roles played by microorganisms in soil is given by the description of the nitrogen cycle (Figure I-8). The nitrogen cycle is mostly driven by microorganisms: nitrogen-fixing bacteria can transform atmospheric nitrogen (N2)
in ammonium by fixation and ammonification processes. Secondly, nitrifying bacteria transform ammonia in nitrites and nitrates, which are assimilated by the plant in order to build
proteins, amino acids, RNA and DNA, and may lead to NO emissions. Finally, denitrifying bacteria use nitrate for the oxidation process releasing N2 in the atmosphere, but also leading
to N2O emissions.
Moreover, the mineralization of organic matter, a central process of the carbon cycle, is mostly carried out by heterotrophic soil microorganisms which reduce complex molecules into smaller molecules, easily assimilated by plants. Due to their metabolic plasticity, soil microorganisms are also involved in the degradation and immobilization of pollutants (i.e., pesticides) brought from the agricultural or industrial environment. Some microorganisms have also got a significant impact on plant health and growth by creating symbioses (Barrios, 2007) or by inducing diseases. Other microorganisms are involved in the formation and stability of soil aggregates through the production of binding agents or the establishment of physical bonds made by the hyphae of fungi (Six et al., 2002).
All the metabolic processes leading to the transformation of the elements in soil, such as the nitrogen and carbon cycles just described, can release VOCs (Schmidt et al., 2015). Moreover, in a complex system such as the soil, VOCs are also used to communicate or more in general for intraspecific and interspecific interactions (Tyc et al., 2017). In the following paragraphs, the description of possible metabolic processes leading to the production of VOCs is given.
Figure I-8. Nitrogen cycle (source: EarthLabs:Climate and the Carbon Cycle)
I.6.3 Biosynthesis of VOCs from microorganisms
Microbial VOCs can be released from primary metabolism in order to produce energy or in the secondary metabolism implicated in the communication and defense mechanisms. In this paragraph, we will describe the primary metabolisms leading to VOCs production.
VOCs production from sugar degradation is mainly released from these three pathways: Embden-Meyerhof, Entner-Doudoroff and heterolactic/homolactic pathway. During sugar degradation, several precursor compounds of the VOCs production are formed: glyceraldehyde-3-phosphate, pyruvate, lactate, acetate, and CO2 are among those. From the
compounds listed above (except CO2) Saccharomyces and a few more bacteria can synthesize
ethanol (Sniegowski et al., 2002). Bacillus species can produce 2,3-Butanediol and acetoin (Ryu et al., 2003) while Clostridium species produce butanol and acetone from the fermentation process (Smith, 1975). Microorganisms in soil need to degrade the organic matter in order to produce energy. When the biodegradation of the soil organic matter is incomplete, several VOCs, as intermediate products of the degradation, are released (Leff and Fierer, 2008). For example, pyruvate is an intermediate product of the hemicellulose and
cellulose degradation and if the degradation is incomplete higher quantities of ethanol are
An essential factor affecting degradation processes is oxygen availability. When anaerobic conditions are present, the alcoholic fermentation becomes the most likely metabolic process.
Another important pathway generating microbial VOCs is the shikimate pathway which releases aromatic compounds (Schulz and Dickschat, 2007). The shikimate pathway (Shikimic acid pathway) is a seven-step metabolic route used by bacteria, archaea, fungi, algae, and plants for the biosynthesis of folates and aromatic amino acids (phenylalanine, tyrosine, and tryptophan). Gosset, (2009) reported that the most emitted VOCs releases from the shikimate pathway are 2-phenylethanol, p-hydroxycinnamic acid, p-hydroxystyrene, and p-hydroxybenzoate.
Bacteria can synthesize sulphur-containing VOCs. An example is given by the lactic bacteria which generate a degradation product, the l-methionine, that leads to the formation of H2S, dimethyl sulphide (DMS), dimethyl disulphide (DMDS), and methanethiol (Schulz and
Dickschat, 2007).
Compounds such as alkenes, aliphatic alcohols, hydrocarbon compounds, and ketones are the result of fatty acid metabolism (Peñuelas et al., 2014). During the fatty acid biosynthesis, several transformations occur such as the decarboxylation that leads to alkenes or methyl ketones or the reduction of carboxyl group which generates aldehydes and 1-alkanols (Schulz and Dickschat, 2007).
Microorganisms are also responsible for the production of the VOCs giving the typical earthy odour: Geosmin (terpene) and 2-methyisoborneol. Those compounds are emitted by
actinomycetes myxobacteria and cyanobacteria (Citron et al., 2012). Finally, another class of
compounds that is likely to be emitted from microorganisms is monoterpenes. More details concerning the different pathways leading to the VOCs formation are represented in Figure I-9.
Figure I-9. Main metabolic pathways for the production of microbial volatiles. VOCs are represented in colored dashed rectangles indicating different chemical classes. Representative examples are given per class: alcohols (ethanol), aldehydes (benzaldehyde), alkanes (undecane), alkenes (1-undecene),
aromatic compounds (2-phenylethanol), esters (2-phenylethyl ester), fatty acids (butyric acid), isoprene, lactic acid, lactones (gamma-butyrolactone), methylketones (acetone), monoterpenes (farnesol), nitrogen compounds (benzonitrile), sesquiterpenes (pinene) and sulphur compounds (dimethyl disulphide)
I.6.4 Interactions mediated by VOCs
Culture-based studies have revealed that even a single bacteria or fungi strain can produce a vast array of secondary metabolites which are not directly involved in the growth, development or reproduction of the microorganism (Tyc et al., 2017). Within those secondary metabolites, we can find VOCs. VOCs, thanks to their physiochemical properties (i.e., small molecules <300 Da, easy diffusion and volatility), are the perfect candidates to mediate the cooperation and the competition between soil microorganisms; even when they are not adjacent to each other. VOCs by microorganisms mediate several functions such as (Kai et al., 2009a; Ryan and Dow, 2008):
Communication between inter and intra-specific organisms;
Cell-to-cell signals;
Growth promoting and inhibiting agents.
In the following paragraph, we will be focused on the VOCs emitted from bacteria and fungi which inhibit or promote growth.
I.6.4.1 VOCs inhibiting and promoting fungi and bacteria growth
For fungi, the exposure to bacterial VOCs can change fungal morphology, enzyme activity and gene expression (Kai et al., 2009a; Vespermann et al., 2007; Wheatley, 2002). Some VOCs have antifungal properties even at low concentrations: trimethylamine, benzaldehyde, and N,N-demethyloctylamine (Chuankun et al., 2004a). Fungi emit several VOCs implied on antibiotic activity. For instance, the emissions profiles of the basidiomycetes Hypholoma Fasciculare and Resinicium Bicolor change when they are sharing the same space (Hynes et al., 2007). The VOCs emitted while those two species are in contact inhibit mutually the growth of the fungi. Moreover, Chakraborty and Chatterjee, (2008), studied the Trichoderma spp. inhibiting activity mediates by antibiotic VOCs versus pathogenic fungi (i.e., Fusarium solani) on plants. The antibiotic VOCs released by
Trichoderma spp. can reduce the pathogenic fungi colonization on plants up to 75%
(Chakraborty and Chatterjee, 2008).
VOCs which mediate bacteria-to-bacteria interactions can inhibit the growth of other bacteria species. For instance, Veillonella and Bacteroides fragilis inhibit the growth of
enteropathogenic bacteria such as Escherichia coli, Salmonella, Shigella and Yersinia (Wrigley, 2004). A widespread VOCs produced among bacteria with a strong growth inhibitor power is Indole. Indole is generated through the degradation of tryptophan by tryptophanase enzyme and inhibits biofilm formation in E. coli, P. fluorescens, and P.
aeruginosa. Other studies as Kai et al., 2009a reported that the typical red colony coloration
of the B. cepacia species diminishes on exposure to volatiles from S. odorifera and Serratia
plymuthica, showing that volatiles of bacteria can influence the metabolism of other bacteria.
Another example is the release of volatile short chain fatty acids from Veilonella species and
Bacteroides fragilis, which thus control the growth of the enteropathogens Salmonella typhimurium, Salmonella enteritidis, E. coli, and Pseudomonas aeroginosa (Hinton and
Hume, 1995). Finally, positive interactions between bacteria and fungi have been reported. Wheatley, (2002) reported that bacteria VOCs emissions are able to stimulate fungi growth by up to 35 %.
I.7 Organic Waste Products (OWPs)
Organic waste products are defined as the exogenous organic matter applied in soils with the aim of improving fertilization and soil structure. OWPs include all the organic wastes deriving from agricultural (i.e. crops residues), urban and industrial activities (Van-Camp et al., 2004). In Europe every year about 1.6 billions tons of OWPs are produced: 61% comes from animal residues, 25% comes from crops residues, 7% comes from municipal wastes and finally 7 % comes from industrial wastes. In France, the majority of the annual production of OWPs is derived from manure (300 Mt, ADEME, 2006), and the 50% of this production is returned to the soil. Regarding municipal and industrial OWPs France produces about 32 Mt (ADEME, 2006). In this case, about 40% are recycled as OWP amendment to soil (ADEME, 2006). In this study four different organic waste products were taken into account:
Municipal solid waste compost (MSW) made from residual municipal waste after the selective collection of dry and clean packaging;
Biowaste compost (BIOW) made from selectively collected fermentable fraction of municipal wasted co-composted with green wastes;
Green waste and sludge (GWS) a compost resulting from the co-composting of sewage sludge, green wastes, and wood chips;
Farmyard manure (FYM) obtained from a dairy farm.
All those OWPs are the result of a composting process leading to a monitored transformation of the organic waste products driven by the microbial community. The final products are rich in stabilized organic products, humic compounds, and nutrients (ITAB, 2002).
I.7.1 Effects of organic waste products amendment on soil organic matter and microbial communities
The intensive agricultural practices widely used in agricultural land contribute to a decrease in soil organic matter content with negative consequences on soil fertility. To contrast, this trend the recycling of organic waste products (OWPs) have been widely encouraged in Europe (European Commission, 2010) especially for cropped soils. In fact, OWPs improve soil fertility and contribute to carbon storage in soil by improving soil porosity, aggregation, bulk density and structure stability (Abiven et al., 2018). Furthermore, OWPs represent a potential source of nutrients (N, P, K..) for crops that can partially substitute the use of mineral fertilizers (Chalhoub et al., 2013). In addition to positive effects on soil fertility, OWPs application improves soil biodiversity and biological activities (García‐Gil et al., 2007). OWPs also impact on chemical fertility through the pH regulation, as well as increase CEC (Diacono and Montemurro, 2010). The effects of the OWP in soil have been investigated on long-term and short-term experiments. In the following paragraphs, an elucidation of the effects on microbial community and on the organic matter of both type of experiment will be given.
I.7.1.1 Long-term effects
Repeated fertilizations over several years are a commonly used practice under field conditions to maintain soil fertility and thus crop yields. It has been also observed that compared to punctual organic fertilization, long-term OWP applications had more persistent impacts on soil characteristics (Obriot et al., 2016), plant growth (Clark et al., 2007), and microbial diversity and activity (Francioli et al., 2016; Giacometti et al., 2014). Studies focusing on the impact on soil microbial community demonstrated an increase of soil
microbial biomass with recurrent OWP amendment (Sadet-Bourgeteau et al., 2018). However, the response of other soil microbial community parameters such as diversity, composition, and structure seemed to depend on the time between the OWP application and soil sampling and the number of years of application. In fact, for applications shorter than 6 years no changes in soil microbial community structure and composition were observed (Poulsen et al., 2013). On the other hand, an increase of soil bacterial and fungal diversity and stimulation of some microbial groups such as Firmicutes, Proteobacteria, and Zygomycota were observed after more than 20 years of OWP application (Francioli et al., 2016). Others parameters, such as the quantity and the type of OWPs applied, seemed to modify the impact of the microbial communities in soil (Diacono and Montemurro, 2010; Sadet-Bourgeteau et al., 2018).
Long term application of OWPs in soil have also negatives effects. OWPs may contain contaminants such as pathogens, organic contaminants or trace elements including metals (Belon et al., 2012). Those contaminants are accumulated in soil leading to a possible transfer to plant and water (Cambier et al., 2014). Additional negative impacts are the decrease of the pH that leads to less O2 availability in soil, or an excessive input of nutrients due to
simultaneous N and P addition (Obriot et al., 2016). These impacts on soil are strictly related to the quality of the organic amendment, the applied doses, the frequency of the application and the cropping system.
I.7.1.2 Short-term effects
Short-term effects of OWP amendments to soils were investigated by Leroy et al., (2008) who studied aggregate stability, hydraulic conductivity, and on the OC in soil organic matter (SOM) fractions. Their study reported an increase of the aggregate stability and hydraulic conductivity after less than 1 year from the first OWP application. The OWP applications also improved the amount of OC in all the fractions of the SOM (Leroy et al., 2008). Federici et al., (2017a) reported the same results as Leroy et al., (2008) after only 120 days from the OWP application. These results showed that OWPs have pronounced effects on soil physical properties starting from the first year of application. Concerning the microbial community, after three days only, all OWPs induced rapid modifications of both fungal and bacterial communities (Federici et al., 2017a). However, Federici et al., (2017a) also reported that while the bacterial community restored to its initial state after 120 days, suggesting their high resilience capacity, the fungal community changes remained modified after this period.
I.7.2 Effects of the organic waste products amendment on the VOCs emissions from soil
Organic waste products affect soil biological and chemical parameters. Changes in soil characteristics also affect the VOCs emissions. It has been reported for instance that moisture content, pH and temperature leads to variation of VOCs flux (Asensio et al., 2007a; Raza et al., 2017a). Due to the complexity of the soil ecosystem, literature does not provide exhaustive information about the dynamics of the VOCs emitted by OWP, despite recent studies have started to fill this lack. For example, Seewald et al. (2010) studied VOCs production by adding glucose to soils regularly amended by different composts and mineral fertilizers. They also reduced the O2 availability in order to impair the degradation of the
VOCs produced by microorganisms. Results reported by this study showed that organic waste composts did not alter VOC emissions compared to an untreated control, while sewage sludge composts and mineral fertilization showed the opposite effect. Moreover, Potard et al. (2017) showed that different soil organic fertilizers such as pig slurry and methanized pig slurry impacted on a different way soil VOCs emissions: pig slurry released double quantities of VOCs while methanized pig slurry emitted even less than the unamended samples. This is as expected since methanization tends to drastically reduce the carbon content of the slurry.
Woodbury et al., (2016) reported an emission of volatile sulfurs compounds after the application of beef cattle manure. Contrasting type of VOCs emissions from soil have been reported from several studies. For instance, in Mediterranean soils the most emitted compound was methanol (Asensio et al., 2007a) while in soil amended with straw it was acetone (Zhao et al., 2016). In fact, emissions of VOCs are strongly related to the substrate quality and it is important to note that even small variations in nutrient composition may change the type and the amount of individual VOCs produced (Wheatley, 2002). It is also important to bear in mind that a significant proportion of the VOCs are produced by microorganisms (Isidorov and Jdanova, 2002). Hence, since the microbial communities, as explained in previous paragraphs, are widely altered by the OWP amendment (Obriot et al., 2016; Sadet-Bourgeteau et al., 2018) VOCs are also altered.
Objectives
During these three years, my work has focused on the characterization of VOCs emissions from soil. In particular, the aim was to characterize, in terms of composition and
quantities, the VOCs emitted from soils amended with different type of organic waste products and to determine the role of the microbial diversity in these emissions. We also
looked into VOCs emissions responses to OWPs application in the short term compared to long term by measuring VOCs emissions after 49 h, one and two years following OWPs applications.
This Ph.D. objectives were hence constructed around three main research questions:
a. Do recurrent amendments of differentiated types of OWPs affect the VOCs emissions by soil in magnitude and composition? Since OWPs amendments affect soil characteristics and microbial composition, we hypothesized that physical and chemical parameters modulated by the application of OWPs (i.e. pH, soil organic matter, total organic carbon…) would induce VOCs emissions changes.
b. What is the effect of microbial diversity on VOCs emissions composition and magnitude? We further questioned if these changes would affect the OWPs amended soils in the same manner.
c. How do OWPs amendments affect VOCs emissions and microbial community by soils in the first two days following application? We further tested whether the structure of a microbial community adapted to OWPs amendment would respond differently compared to a microbial community that never received OWPs amendment in the last ~20 years, and whether this changes VOCs emissions.
Chapter II gives an overview of the methods used in this work, while chapters III, IV and V
are the core of the work presenting results from three experiments designed to answer the three research questions listed above. Chapter VI is a general discussion that makes the link between these three questions and Chapter VII gives conclusions and perspectives to this work.
Chapter III was dedicated to question a. For this purpose, we measured the composition
and quantity of VOCs emitted by soils regularly amended with OWPs. Soil samples were taken from the QualiAgro site where soils have received OWPs since 1998. We measured VOCs emissions from soil amended with 4 different OWPs and a control sample that never received organic amendment. Soils were sampled two years after the last application in order to avoid any short term emission effects. In this chapter, we discuss the differences in magnitude and composition of the VOCs emitted and we discuss the links with soil characteristics (pH, organic matter, Iroc indicator, cation exchange capacity, carbon/nitrogen
ratio, total nitrogen, and organic carbon). Chapter III was published in Science of the Total Environment journal.
The aim of chapter IV was to give an answer to question b. Soil samples were collected at the same site as the first experiment, one year after the last OWPs application. Soil samples were sterilized and inoculated with three different microbial diversity dilution levels (high, medium and low) to prepare microcosms that were incubated for 6 weeks. VOCs emissions were then measured and the microbial composition characterized. The links between the microbial community structure, as affected by diversity manipulation, and VOCs emissions composition and magnitude were explored.
Chapter V is dedicated to question c. In this experiment, we measured the dynamics of
VOC emissions and microbial structure during two days following the fresh application of green waste and sludge (GWS). We further compared the response of a soil recurrently receiving OWPs to soil that had never received OWPs for ~20 years. Addition of GWS to these soils was performed 1h before the detection of VOCs emissions. The VOCs emissions from the microcosms were detected 10 times during 49h after the application of the GWS amendment. We characterized the microbial community structure before and at the end of the 49h. We then discussed the short term VOC emissions and the links with changes in the microbial community.
For all the performed experiments the detection of VOCs was made using the PTR-Qi-TOF-MS technique; while the evolution of the microbial diversity was characterized after the VOCs detection by a high throughput sequencing approach targeting 16S and 18S ribosomal genes. The experimental setups are presented in Chapter II in details. Table I- 3, however, summarizes the main items of the three experimental setups underlining this work.