HAL Id: tel-01834667
https://tel.archives-ouvertes.fr/tel-01834667
Submitted on 10 Jul 2018HAL is a multi-disciplinary open access archive for the deposit and dissemination of sci-entific research documents, whether they are pub-lished or not. The documents may come from teaching and research institutions in France or abroad, or from public or private research centers.
L’archive ouverte pluridisciplinaire HAL, est destinée au dépôt et à la diffusion de documents scientifiques de niveau recherche, publiés ou non, émanant des établissements d’enseignement et de recherche français ou étrangers, des laboratoires publics ou privés.
Les effets de la répartition non-uniforme des fibres sur la
propagation des fissures á l’interface fibre/matrice dans
les matériaux composites
Linqi Zhuang
To cite this version:
Linqi Zhuang. Les effets de la répartition non-uniforme des fibres sur la propagation des fissures á l’interface fibre/matrice dans les matériaux composites. Matériaux. Université de Lorraine; Université de technologie de Luleå (Suède), 2017. Français. �NNT : 2017LORR0321�. �tel-01834667�
AVERTISSEMENT
Ce document est le fruit d'un long travail approuvé par le jury de
soutenance et mis à disposition de l'ensemble de la
communauté universitaire élargie.
Il est soumis à la propriété intellectuelle de l'auteur. Ceci
implique une obligation de citation et de référencement lors de
l’utilisation de ce document.
D'autre part, toute contrefaçon, plagiat, reproduction illicite
encourt une poursuite pénale.
Contact : ddoc-theses-contact@univ-lorraine.fr
LIENS
Code de la Propriété Intellectuelle. articles L 122. 4
Code de la Propriété Intellectuelle. articles L 335.2- L 335.10
http://www.cfcopies.com/V2/leg/leg_droi.php
Ecole doctorale EMMA
THÈSE
Pour l’obtention du titre deμ
DOCTEUR de L’UNIVERSITÉ DE LORRAINE
Spécialité: Mécanique des Matériaux (Composites) Présentée par :
Linqi Zhuang
Les effets de la répartition non-uniforme des fibres sur la propagation des
fissures á l’interface fibre/matrice dans les matériaux composites
Thèse soutenue publiquement le 24 mai 2017 à Luleå (Suède) devant le jury suivant :
Prof. Paris Federico University of Seville, Spain Rapporteur Prof. Yves Berthaud Université Pierre et Marie Curie, France Rapporteur
Prof. Daghia Federica Endommagement et rupture des composites sous solicitations Examinateur mécaniques et environnementale Ecole Normale supérieure
de Cachan, France
Prof. Zoubir Ayadi Département Science et Ingénierie des Matériaux et Métallurgie-IJL, Directeur de thèse
Université de Lorraine, Nancy, France
Prof. Janis Varna Department of engineering sciences and mathematics, division Directeur de thèse
of material science, polymeric composite materials, Luleå university of technology, Sweden
Institut Jean Lamour –UMR 7198- Département SI2M – Equipe 305 Parc de Saurupt - CS 50840- 54011 NANCY Cedex
iii
Preface
The work presented in this thesis contains five scientific papers that summarize my work performed within the Division of Materials Science in Luleå University of Technology in Sweden and in the Division of Mechanics of Materials (SI2M) in Jean Lamour Institute in France as well as Department of Aerospace Engineering in Texas A&M University in USA during the period from October 2013 to March 2017.
I am very fortunate to have the chance to do my PhD in three different universities of different countries, which I’ll forever be grateful about.
I would like to thank my advisor Professor Janis Varna first for giving me the opportunity to do research in the northernmost technical university, and for his straightforward but very helpful advice and guidance. I would also like to thank Professor Ramesh Talreja for bringing me to the world of composite and supporting me through out of my PhD study. I would also like to thank Professor Zoubir AYADI for his support and assistance with my poor French.
Special thanks go to my amazing colleagues in Lulea: Andrejs, Liva, Hana, Newsha, Hiba, Abdelghani, Johanna, Roberts, Lennart for their kind assistance and great sense of humor, which made my adventure in Luleå quite enjoyable.
I would also like to thank the Joint European Doctoral Program in Material Science and Engineering (DocMase) for financing this project.
Finally, I would like to express my greatest gratitude to my family especially my wife Xiaoying, for their unconditional love and supports, this one is for you.
Luleå, May 2017
v
Abstract
In the presence thesis, the growth of fiber/matrix interface debond of a UD composite with hexagonal fiber packing under longitudinal and transverse tensile loading was investigated numerically, with the special focus on the influence of neighboring fibers on its growth. In the current study, energy release rate (ERR) is considered as the driving force for debond growth and was calculated based on J Integral and Virtual Crack Closure Technique (VCCT) using finite element software ANSYS. In the present thesis research, we started with investigating the influence of neighboring fibers on ERR of a debond emanating from a fiber break in longitudinal loading condition. In longitudinal loading case, debond growth is mode II dominated. As the starting point for the research, an axisymmetric model consisting 5 concentric cylinders that represent broken fiber with debond, surrounding matrix, neighboring fibers, surrounding matrix and effective composites was generated. It’s found that there are two stages of debond growth, the first stage is when debond length is short, the ERR decreases with increasing debond angle, and the presence of neighboring significantly increase the ERR of debond. For relatively long debond, the debond is in a steady state growth region when ERR is almost constant regardless of debond length. In steady state of debond growth, the presence of neighboring fibers has little effect on the ERR. In the later research, a 3-D model was generated with broken fiber and its 6 nearest fibers in a hexagonal packed UD composite were modelled explicitly, surrounded by the homogenized composite. Based on the obtained results, it’s shown that ERR is varying along debond front, and has its maximum at the circumferential location where the distance between two fiber centers is the smallest. This indicates the debond front is not a circle. For steady state debond, the presence of fibers has little effect on ERR that averages along debond front. For short debond, the presence of fibers increases the averaged ERRS, and that the increase is more significant when inter-fiber distance are the smallest. When we conclude our investigation on fiber/matrix debonding under longitudinal loading, we began studying the growth of a fiber/matrix debond along fiber circumference under transverse loading. It’s found that debond growth is mixed-mode, and both mode I and mode II ERR components increase with increasing debond angle and then decreases. Debond growth is mode I dominated for small debond angle and then switch to mode II dominated. The presence of neighboring fibers have an enhancement effect on debond growth up to certain small debond angle and then
vi
changes to a protective effect. Finally, the interaction between two arc-size debond under transverse loading is investigated. It’s found that when two debonds are close to each other, the interaction between two debond becomes much stronger, and that interaction leads to the increase of ERR of each debond significantly, which facilitates further debond growth for both debond.
vii
Résumé
Dans ces travaux, nous avons étudié numériquement la croissance du décollement de l'interface fibre / matrice d' un composite UD avec garnissage hexagonale de fibre sous charge longitudinal et transversal. Nous avons mis l'accent en particulier sur l'influence des fibres voisines sur sa croissance. Dans la présente étude, le taux de libération d'énergie (ERR) est considéré comme la force motrice de la croissance du décollement et a été calculé sur la base de Integral J et de la technique de fermeture virtuelle de fissures (VCCT) à l'aide du logiciel de calcul par éléments finis ANSYS.
Dans la présente recherche de thèse, nous avons étudier d’abord l'influence des fibres voisines sur ERR d'une décohésion émanant d'une rupture de fibre en condition de chargement longitudinal. Dans le cas du chargement longitudinal, la croissance du décollement est gouvernée par le mode II. Comme point de départ l’étude, nous avons mis place un modèle axisymétrique composé de 5 cylindres concentriques représentant la fibre endommagée, la matrice environnante, les fibres voisines, la matrice environnante et le composite effectif généré. On constate qu'il y a deux stades de croissance, la première étape correspond à une longueur courte du décollement, l'ERR diminue à mesure que l'angle du décollement augmente, et la présence de voisins augmente significativement la décohésion de l'ERR. Pour une décohésion relativement longue, le décollement se situ dans une région de croissance en état stationnaire lorsque l'ERR est pratiquement constant quelle que soit la longueur du décollement. A l’état stationnaire de la croissance du défaut, la présence de fibres voisines n'a que peu d'effet sur l'ERR.
Les travails ultérieurs, nous avons mis en place un modèle 3-D (explicite) avec la fibre endommagée et ses 6 fibres les plus proches dans un composite UD compacté hexagonal, entourées par le composite homogénéisé. Sur la base des résultats obtenus, nous avons montré que l'ERR varie le long de la face frontale et a son maximum à l'endroit circonférentiel où la distance entre deux centres de fibre est la plus petite. Cela indique que le front du décollement n’est pas circulaire. Pour l'état stable du décollement, la présence de fibres a peu d'effet sur l'ERR qui progresse le long du front du décollement. Pour un décollement court, la présence de fibres augmente l'ERRS moyenné, et cette augmentation est plus significative lorsque la distance entre fibre est la plus petite. Après l’étude du la décollement fibre / matrice en charge longitudinale, nous avons commencé à étudier la croissance du décollement fibre / matrice le long de
viii
la circonférence de la fibre sous charge transversale. On constate que la croissance de la du décollement est en mode mixte, et les composants ERR du mode I et du mode II augmentent avec l'augmentation de l'angle de déformation puis diminuent. La croissance du décollement démarre principalement en mode I pour les petits angles de décollement et se poursuit en mode II. La présence de fibres voisines a un effet d’accroissement sur la croissance du décollement jusqu'à certains petits angles et change ensuite en effet protecteur.
En fin, nous avons étudié l'interaction entre deux décollement sous chargement transversale. Nous avons constaté que lorsque deux décollements sont proches l'un de l'autre, l'interaction entre devient beaucoup plus forte et conduit à l'augmentation significative de l'ERR de chaque décollement, ce qui facilite la croissance du décollement.
ix
List of appended papers
Paper A
Zhuang, L and Pupurs, A, Effect of neighboring fibers on energy release rate during
fiber/matrix debond growth. Proceedings in 16th Eurepean Conference on Composite Materials, 2014, Seville, Spain.
Paper B
Zhuang, L., Pupurs, A., Varna, J., and Ayadi, Z., 2016, "Effect of fiber clustering on
debond growth energy release rate in UD composites with hexagonal packing," Engineering Fracture Mechanics, 161, pp. 76-88
Paper C
Zhuang, L., Pupurs, A., Varna, J., and Ayadi, Z., 2016, "Fiber/matrix debond growth
from fiber break in unidirectional composite with local hexagonal fiber clustering," Composites Part Bμ Engineering, 101, pp. 124-131.
Paper D
Zhuang, L., Pupurs, A., Varna, J., Talreja, R. and Ayadi, Z., 2017, “Effects of
Inter-Fiber Spacing on Inter-Fiber-matrix debond Crack Growth in Unidirectional Composites Under Transverse Loading," Submitted to Composites Part Aμ Applied Science and Manufacturing.
Paper E
Varna, J., Zhuang, L., Pupurs, A., and Ayadi, Z., 2017, “Growth and interaction of
debonds in local clusters of fibers in unidirectional composites during transverse loading," Submitted to Key Engineering Materials
xi
Contents
Preface...iii
Abstract...v
List of appended papers...ix
Contents...xi
1. Introduction...1
1.1.Tensile failure of 0° plies...2
1.11 Fiber breakages in UD composites ...…………... 3
1.12 Fiber/matrix interfacial debonding in UD composite... 9
1.2 Transverse cracking of UD plies ………...12
1.2.1 Experimental findings………...12
1.2.2 Analytical and numerical findings………. 15
1.2.3 Fiber/matrix interface crack growth under transverse loading……….. 17
2. Objective of current thesis……….………. 22
3. Summary of appended papers………. 23
3.1 Paper A……….. 23 3.2 Paper B………...26 3.3 Paper C………...29 3.4 Paper D………...32 3.5 Paper E………. ..35 4. References...38 Paper A...49 Paper B... .. 63 Paper C... . 93 Paper D... 123 Paper E... 151
1
1. Introduction
Composites have been widely used in engineering industries especially in aerospace industry and wind energy industry due to their unique mechanical properties compared to traditional metal materials. One of most attractive features of composites is their design flexibility, i.e. engineers could design composite structures with desired properties by selecting different lay-up of composite, reinforcement or matrix materials etc. For a composite structure, depending on the design requirements, it usually contains substantial amount of unidirectional (UD) plies with fibers orienting along loading direction (called 0° or longitudinal plies) or perpendicular to the loading direction (called 90° or transverse plies). When subjected to tensile loading, 0° and 90° plies usually fail at different levels of applied load due to the difference in failure mechanisms. For 0° plies, fiber breakages, matrix cracking and fiber/matrix interface debonding are the common damage modes upon loading, due to the complicated nature of composites, those damages could occur at the same time or in a sequence. 0° plies are believed to fail when a critical fracture plane is formed by coalescing of fiber breaks through interface debonds and matrix cracks and propagates unstably. For 90° plies, the most common damages caused by tensile loading perpendicular to the fibers direction are fber/matrix interface debonding and matrix cracking. Transverse cracking is often considered as the first failure event in composite structures and the macro-scaled transverse crack is believed to form by the coalesce of debonds. The increasing structural applications of composites lay heavily on the models that could accurately predict the behaviors of composites under any given loading conditions while the accuracy of such models depends on the thorough understanding of underlying failure mechanisms, especially, the mechanism for damage initiation and final failure. For any given composites, based on the discussion above, the first failure event is usually occur at 90º plies and 0º plies control the strength of the composite. As a result, it is of great importance to investigate the failure mechanism of UD plies under longitudinal or transverse loading condition in order to gain a better understanding of failure of the composite structures.
2
1.1 Tensile failure of 0° plies
In order to investigate the tensile failure mechanisms of 0° plies, UD composites where a composite contains only 0° plies are commonly adopted. When subjected to increasing or repeated tensile loading, failure of UD composite is governed by different mechanisms, which could be summarized in fatigue life diagram proposed by Talreja [1]. As shown in the Fig.1, fatigue life diagram could be divided into three region. In horizontal region I where applied load is larger than the strength of fiber, fiber breakages is the main failure mechanism. During first cycle of loading, individual fiber with lower strength than maximum stress breaks randomly, upon further application of loading, due to stress concentration causing by the broken fiber, more discrete fiber break occurs until a critical fracture plane is formed where crack propagate unstably and lead to final failure of UD composite. Because fiber is considered not to experience fatigue, that whole process is thus non-progressive and highly statistical. When the applied load is lower than the strength of fiber, during first application, due to the statistical nature of fiber strength, individual fiber break would still occur at their weakest position as well as subsequent fiber/matrix interface debonding and matrix cracking, upon further loading, more fiber break would occur near previous damage region, as well as further growth of previous debond and fiber-bridged matrix cracking, final failure would occur when a critical fracture plane is formed by connecting each individual fiber breaks through debonding and matrix cracking. Finally, if applied load is so low that although certain damage events occur during loading, they will be arrested upon further loading. Then it reached fatigue limit as shown in the Fig.1, where final failure would not occur during cyclic tensile loading. A systematic experimental work to demonstrate fatigue life diagram could be found in [2, 3].
3
Fig.1. Fatigue life diagram for UD composite under cyclic tensile loading (Courtesy of Prof. Talreja)
It should be noted that the progress failure region (Region II) discussed in fatigue life diagram, although is proposed based on repeated tensile loading condition, it also highlights some very important failure features of UD composite under statically tensile loading: the final failure of the UD composite is also caused by the coalesce of fiber breaks through fiber/matrix debonding and matrix cracking, which forms a critical fracture plane that grows unstably. In the following section we will discuss the exact mechanisms for some of the most important damage modes under tensile loading.
1.11 Fiber breakages in UD composites
When a UD composite is subjected to tensile loading along fiber direction, individual fiber breaks first at its weakest location due to the statistical distribution of fiber strength. The breakage of a fiber causes the axial stress redistribution along fiber axis. As shown in Fig. 2, at the fiber break, fiber no longer carries axial load, and the load carrying ability of broken fiber recovers gradually from fiber break through shear stress carried by matrix. The distance from fiber break to where the axial stress recovered to up to certain level (usually 90%) of the nominal load before fiber breakage is often referred as “effective length” which represents the load transferred ability between fiber and matrix. Since at fiber break, broken fiber does not carry axial loads, this part of load has to be shared by the intact fibers nearby, which leads to the enhancement of local axial stress (or stress concentration) in neighboring fibers. If the
4
enhanced local axial stress exceeds the fiber strength, a new fiber would break resulting in more significant enhancement of local axial stress in the intact fibers nearby, which leads to the successive breakage of nearby intact fibers simultaneously or with the further increase of applied load. It’s expected that a UD composite would eventually fails if substantial amount of fibers break within the composite. Based on this idea, the majority of the UD composites failure models have been developed based on the failure of fibers in order to predict the final failure of UD composites.
In order to be able to predict the fiber breakages, the accurate calculation of stress enhancement in the intact fibers near broken fiber is the key. As a result, numerous research efforts have been devoted to investigating the stress enhancement mechanism in the nearby fibers.
Fig.2 The distribution of axial stress, and of local fiber strength along the fiber length. (Figure adopted from [4] and is originally from [5])
The first attempt to study this stress enhancement in composites was made by Hedgepeth [6] where he investigated the stress concentration in a 2-D filamentary structures. The sheet of parallel filaments is assumed to carry the normal loads and is embedded in a matrix which carries only shear. A stress concentration factor (SCF:
5
ratio between local axial stress and nominal stress applied at the fiber) of 4/3 was found for an intact fiber near single broken fiber and he also found that the stress concentration factor is larger when dynamic effect was considered. This study was based on the assumption that all the filaments carry the same extra load resulting from fiber breakage, which is considered as so called “global load sharing” theory. This theory has some drawbacks: intuitively, we expect the influence of stress field caused by fiber breakage should be within a local region near broken fiber and the nearest neighborhood should be affected the most. Hedegpeth and Van Dyke [7] then improved the previous theory by assuming only the nearest fibers have to share the extra load caused by fiber breakage and obtained smaller stress concentrator factor based on the 3-D model. These two studies are commonly considered as the first investigations on the stress concentration in the nearby intact fibers cause by fiber breakages, after that, several analytical models were also developed by various researchers [8-11] and obtained similar SCF as that in Hedgepeth’s studies [6, 7]. With the help of development of computational abilities, many numerical models were later developed in order to calculate the SCF accurately. The work done by Nedele and Wisnom [12, 13] was considered as one of the first numerical models developed to investigate the SCF. They first developed a 3-D model to account for a UD composite with fibers uniformly distributed in a hexagonal pattern, and found a smaller SCF in the nearest 6 fibers around broken fibers compared to that obtained by Hegepeth and Van Dyke [7]. They then extended their work to an axisymmetric model with broken fiber placed as the central fiber ring, and neighboring fibers were also modeled as a concentric fiber ring near central broken fiber. From the calculation they found that SCF was varying across the cross-section of nearby fibers and has the highest value at the fiber/matrix interface near broken fiber. They then calculated the mean SCF using the axial stress value at the center of nearby fiber’s cross section and obtained a smaller SCF compared to that obtained by Hegepeth and Van Dyke [7]. After that, numerous research efforts [14-25] have been done on SCF and majority of those research have been focusing on the effect of matrix yielding and fiber/matrix debonding near fiber break on obtained SCF, and based on the results obtained from those research, it is generally accepted that the presence of matrix yielding or fiber/matrix debonding would reduce the maximum SCF in the nearby fibers.
6
With the better understanding of the stress enhancement mechanism in the composites, researchers are able to developed different analytical models to predict the final failure of a UD composite. Until now, the majority of models developed to predict the failure of a UD composites are based on the so-called “fiber bundles” model, which assumes only fibers carry the axial loads and a UD composite fails when certain amount of fibers are broken. Based on that argument, the major research focus was on predicting the successive breakages of fibers. Realizing that the strength of a single fiber is not constant along the fiber length, a certain statistical distribution (usually the Weibull distribution) of fiber strength is commonly adopted when developing the composite model. The first comprehensive analytical model to predict the tensile failure of a UD composite was developed by Rosen [26]. In his model, the axial loads are assumed to be carried by fibers only, and the extra load caused by the fiber breakage is shared by all the fibers in a cross-section. The strength of the fibers is assumed to follow Weibull distribution. Based on the “weakest link” theory that fiber fails when the local stress exceeds its lowest strength value, the composite failure occurs when a cross-section fails. Zweben [27], Zweben and Rosen [28] later proposed a statistical model based on the accumulative weaken of fibers that including the stress concentration. The basic of their model lays on the argument that the breakage of a single fiber will cause stress concentration in the nearest fibers in a 2-D fiber array, which will increase the probability of failure of nearest two fibers, the breakage of nearest fibers will cause a higher stress concentration in the surrounding fibers which will further increase the probability of failure of those fibers. The final failure of a composite occurs when a first multi-fractured group of fibers is formed. A few years later Harlow and Phoenix [29, 30] also developed their own statistical model to predict the failure of UD composites. It should be noted that, until now, the analytical models we discussed so far are all considered as the “chain of bundles”, that is each fiber is considered as one chain within the bundles, and the weakest fiber fails the first, the composite fails when the fiber bundle fails. The “chain of bundles” model constitute majority of the early years’ models to predict the final failure of a UD composite until Batdorf [31] proposed his model concentrating on the formation and growth of multiple fiber fractures. In his work, he also adopted weakest link theory to predict the isolated single fiber breakage (singlet), double fractures (doublet) and multiplets with respect to applied load, a UD composite is considered failed when a Griffith-type instability occurs which
7
corresponding to a certain number of broken fibers at the same location. This approaches significantly simplify the procedures in previous “chain of bundles” models and he and his co-worker [32] as well as other research [33] found that the amount of broken fibers at the same location that could results in the beginning of instability most often varies from 6-14 fibers, this also supported by the fractography investigation conducted by Purslow [34], as he found the numbers of broken fibers within a bundle in the fracture surface of a UD composite fell within that range of numbers, as shown in Fig. 3. Besides those analytical models discussed, numerous numerical models were also develop to predict the failure of UD composite with the focus devoted on the fiber fractures, for example, in [35-40]. Those models, although can agree relatively well with the experimentally obtained failure strain of a UD composite, they are all focused only on the fiber breakages, which do not capture the exact failure mechanism of the UD composite, as we’ll shown later, which put its real accuracy in doubt.
Fig.3 Fracture surface of a UD composite. Figure adopted from [34]
In a synchrotron X-ray microtomography study conducted by Aroush et al [41], the whole process of growth of single fiber fracture (singlet) to multi-fiber fractures
8
(multiplets) and the final failure as a result of instability occurs was clearly demonstrated, as shown in Fig. 4. A more clear picture of cluster of broken fibers was captured by Garcea et al [42], as shown in Fig.5, a fracture plane containing clusters of broken fibers are displayed. A closer look at these two figure reveals that the fracture plane is not strictly planar, i.e., fibers did not break at an exact same plane and was connected by the means of fiber/matrix debonding and matrix cracking. Although the effect of matrix cracking on the stress enhancement of neighboring fibers are relatively small, as discussed by Swolfs et al [43], it plays a very important role, together with fiber/matrix debonding, in connecting individual broken fiber and forming the fracture plane, as found by the current author [44]. As a result, a more accurate model to predict the failure of a UD composite through unstable growth of the fracture plane has to be able to account for the effects of matrix cracking and fiber /matrix debonding in order to capture the correct failure mechanism. In the following section, we will specially focus on fiber/matrix longitudinal debonding mechanism.
Fig. 4 Sequence of damage evolution in a UD composite subjected to longitudinal tension. Figure adopted from [41]
9
Fig. 5 Illustration of clusters of fiber breaks. Figures adopted from [42]
1.12 Fiber/matrix interfacial debonding in UD composites.
It is clear that for a UD composite subjected to longitudinally tensile loading, fiber/matrix debonding is a very important sub-damage mode, although it will not directly lead to the final failure of the UD composite.
It has been shown that interfacial debonding would deflect original propagating brittle crack and thus increase the overall fracture toughness of composites [45, 46]. Although the concept of fiber/matrix interface it is widely accepted nowadays [47-49], the exact properties of interface is still unknown. In order to characterize the interface properties, single fiber fragmentation test has been widely adopted due to its experimental simplicity [50-55]. At the same time, it could also be used to calculate statistical parameters for fiber strength [56-59]. The idea of fiber fragmentation was first described by Kelly and Tyson [60] where they studied the interface strength of fiber-reinforced metal by assuming a linear stress build up from fiber break end. Based on shear-lag typed analysis that tensile stress is transferred back to fiber through shear stress transforms along fiber/matrix interface from fiber break, they proposed that critical length of fiber lc is related to the yield strength of fiber/matrix interface by
Eqn.1, where � the fiber breaking strength, r is is the fiber radius and � is the yielding strength of the interface, which could also be characterized as fiber/matrix interfacial
10
strength in literature published later on although the expression would be different based on the methods, for example, in [50, 51, 61]. In the single fiber fragmentation test, a continuous single fiber is usually embedded in a dog bone shape matrix subjected to tensile loading along fiber direction. Upon loading, fiber breaks at its weakest position, with increase of applied load, more fiber breaks occur until it reach saturation state where the distance between two fiber break is not long enough for the tensile stress to recover to induce further fiber break. During single fiber fragmentation, it is found that based on the fiber/matrix interfacial properties, fiber radius as well as other factors, both fiber/matrix debonding, matrix cracking and matrix shear yielding would occur after initial fiber break [62-64]. Optical method is commonly used to observe stress state near fiber break. Fig.6 shows the typical birefringence pattern at fiber break for carbon/epoxy composites, due to the high shear stress concentration near fiber break, fiber/matrix interface failure could be found (sheath region), as reported in [51, 53], and symmetric birefringence is usually found on both side of fiber beak. Based on the experimental finding from single fiber fragmentation test, several analytical work and numerical work have been carried out to study the stress transfer between fiber/matrix interface as well as fiber/matrix debond growth from fiber break [55, 62, 65-68]
� =�� � (1)
Fig.6 Birefringence pattern at fiber break (Figure adopted from [51] )
As useful as it is, however, in single fiber composite model, it does not account for the effect of surrounding constituents, which would affect the obtained results as stress field near certain fiber is closely related to its surrounding medium. Previous research [12-21, 33, 69, 70] adopted multiple fibers in the specimen in order to investigate the
11
influence of neighboring fiber on Stress Intensity Factor (SCF) and subsequent fiber breakage process. However, the effects of neighboring fibers on longitudinal debond growth is less understood. As an improvement of single fiber composite model, several numerical and analytical investigations [71-75] on debond growth from single fiber break have been conduct recently. The whole model was constructed based on three-phase concentric cylinders, with initial broken fiber and surrounding matrix to be the first two rings and neighboring substituents around them to be smeared into an effective composite phase with homogenized composite properties, as shown in Fig. 7. ERR is calculated as driving force to debond growth. It’s found that two distinct region existing during debond growth, first one is when debond length is relatively short and there will be interaction between debond tip and fiber break, which would affect obtained ERR; The other region is when debond length is long enough such that there is no interaction between debond tip and fiber break, debond would grow steadily with ERR being constant with increasing debond length. In this steady-state region, an analytical model is able to obtain and good agreements were reached between numerical results and analytical model.
Fig.7 Illustration of three-phases concentric cylinder models (Figure adopted from [4]
Despite the accuracy of previous models described above, they have analyzed an idealized geometry without taking into account the possible non-uniformity of the local fiber arrangement which is present in most of the real cases. It can be expected that the local microstructure would also affect the stress state around the broken fiber and hence
12
it can affect the debond growth rate. As a result, in the present thesis, we will specifically investigate the effects of local fiber arrangement on debond growth. Before we proceed to the numerical models, we will give a comprehensive overview of transverse failures of 90° plies.
1.2 Transverse cracking of UD plies. 1.2.1 Experimental findings
Previously we have focused our discussion on the tensile failure of 0° plies, in majority of the composite structures, when subjected to longitudinally tensile loading, 0° plies are the major load bearing plies, and failure of 0° plies often leads to the final failure of the composite. In real practice, it is also of great importance for researchers to understand the failure initiation of composites. For composites containing off-axial plies, especially 90° plies, when subjected to longitudinal tensile loading, the first failure event has been commonly found as transverse matrix crack propagating through the thickness in 90° plies, as shown in Fig. 8. A closer look at these transverse matrix crack (Fig. 8(b)) reveal that the observed macro-scaled matrix crack actually results from the coalesce of individual fiber/matrix debond. After the first transverse matrix crack is formed, the number of transverse crack increases with increasing applied load, as shown in Fig. 9.
Similar to fiber/matrix longitudinal debonding discussed above, the multiplication of transverse cracks does not directly lead to the final failure of composites. However, it has been proven [76-80] that multiple transverse cracking will lead to degradation of composite stiffness and strength. Due to its importance in determining the integrity of composites, the mechanism of multiple transverse cracking has been studied by numerous researchers. In the following paragraph let’s first focus on some experimental findings to have a better idea of the whole process.
13
Fig.8 Illustrations of (a). transverse matrix crack in 90° plies, (b) Zoom in on a matrix crack revealing debonding at fiber/matrix interface. (Figure adopted from [81])
Fig. 9 Development of transverse cracking with increasing applied load in glass-fiber cross ply laminate. (Figure adopted from [78]
Early work done by Garrett and Bailey [82] found that for different lay-ups of cross-ply laminates, transverse crack initiates at around 0.4% of the strain, however, the spacing between transverse cracks depends on the thickness of transverse plies. As shown in Fig. 10, the transverse crack spacing decreases with increasing thickness of
14
transverse plies. The so-call “constraint effects” by the longitudinal plies was later investigated by Parvizi et al [83, 84] where they found the transverse cracking process changed significantly in cross-ply laminates with different transverse and longitudinal plies ratio. For cross-ply laminates with high percentage of transverse plies, fully developed multiple transverse cracking is the main mechanism, with the decrease of transverse ply thickness, edge cracks are most commonly found and slowly propagate across the specimen width, and for a much smaller transverse ply thickness, the transverse cracking process was completely compressed. This “constraint effect” is demonstrated in Fig.11. As it could be seen from Fig.11, the number of transverse crack decreases as the thickness of the transverse plies reduced. The constraint effect of neighboring plies could be explained in terms of stress recovery within transverse plies. Once a fully propagated transverse crack is formed within transverse plies, the normal stress of the transverse plies at cracking plane is zero, and that normal stress has to be transferred back to transverse plies and fully recovered at certain distance from the cracking plane through shear stress within the interface between transverse plies and neighboring plies. Once the normal stress is fully recovered, another transverse crack is considered to form, and this same process results in the multiple transverse cracking process. Depending on the material properties and the lay-up of composite laminates, the ability of normal stress recovery through shearing varied, which result in the different spacing between transverse cracks. It is expected that as the transverse crack spacing reduced, the ability of normal stress recovery through shearing decreases and there will be a certain transverse cracking spacing below which normal stress will never be fully recovered, and thus no more transverse crack is formed after that. This is so-called “Characteristics Damage State” (CDS) which is first discovered by Reisfnider and his co-workers [85-87]. The CDS was first found [85] to be a state where the number of transverse cracks saturated, i.e., transverse crack spacing remain constant with increasing cycles in fatigue loading or increasing applied load in quasi-static loading. Later the same author and his co-worker found [87] that the residual strength, stiffness of the composites also influenced significantly by CDS.
15
Fig.10 Transverse cracking in specimens with different transverse-ply thickness (a). 0.75mm, (b). 1.5mm, (c). 2.6mm. (Figure adopted from [82])
Fig.11 Illustration of the “constraint effect” in cross-ply laminates. The transverse ply thickness is reduced from a to d as the thickness of the transverse plies reduced. Figure
adopted from [84]
1.2.2 Analytical and numerical findings
The experimental findings on transverse cracking in UD plies have been briefly summarized in the previous section. Multiple transverse cracking is found to be the main mechanism for UD plies subjected to transverse tension. The presence of multiple
16
transverse cracks also reduce composite stiffness, as a result, researchers are interested in developing analytical and numerical models in order to predict the corresponding multiple transverse cracking and resulting stiffness degradation of composites. Some of the milestones in this area include the “ACK” method developed by Aveston et al [88] which was able to predict whether it is a single facture or multiple transverse cracking in composite based on a simple strength argument where stress analysis was carried out using shear-lag type analysis. In that study, normal stress originally carried by matrix was assumed to be transferred back to matrix at certain distance away from matrix crack plane through friction between matrix and fiber interface. The appearance of the next matrix crack was predicted based on an energy balance method. The crack spacing was able to be predicted then. However, one of the major limitations is that this approach assumes constant shear stress which due to friction in normal stress recovery process. This approach was later extended by some of the same authors [89] to account for fully bonded and partially bonded composites. In order to predict the stiffness degradation of composite due to multiple transverse cracking, Hashin [90] adopted variational approach to investigate the stress distribution and stiffness degradation in a cracked cross-ply laminate. In his work, the local tensile stress is assumed to be constant through thickness and the stress field in the cracked laminate was represented by the original uncracked stress field plus the stress perturbation caused by transverse cracks, and the solution of the stress field is later solved by minimized the complementary energy of the composite. Similar variational approach was later adopted by other researchers [e.g[80, 91] ] to investigate transverse cracking in the cross-ply laminates to account for the strain energy release rate of the matrix crack and variation of local tensile stress across thickness. Talreja [79] adopted a continuum damage theory to study the multiple cracking and stiffness degradation problem by using vector field to characterize the damage (matrix cracks) for various lay-up of laminated composites. The material constants in this work have to be determined experimentally. Recently Huang et al [92] was able to adopted a statistically analysis to investigate the multiple cracking process which also be able to account for the effect of manufacturing defects.
The analytical models we discussed all investigated the crack initiation and multiple cracking based on the assumption that plies are homogenous solid. With the development of computational mechanics, more numerical models were developed that
17
could study the transverse cracking mechanism in a constituent level. For example, Asp et al [93-96] found the stress field within epoxy matrix near fiber/matrix interface to be almost equally tri-axial, which is a preferred condition for matrix cavitation process. They argued that as cavitation grows and reaches its criticality based on dilatational energy density, it bursts open and propagates towards fiber/matrix interface leading to the initiation of fiber/matrix debonding, which is also the initiation of transverse cracking as macro-size transverse crack would eventually occur by the coalesce of debonds. They also conducted the “poker chip” typed experiment [95] of commonly used epoxy materials and found out the critical dilatational energy densities are not very sensitive to difference of epoxy materials. Fiedler et al [97-99] conducted several FE analysis of composite transverse failure and found that hydrostatic tensile stress is responsible for relatively low transverse failure strain and thermal stress and fiber volume fraction is found to influence of transverse failure process.
1.2.3 Fiber/matrix interface crack growth under transverse loading
We have discussed multiple transverse cracking in UD plies, which is the main failure mechanism for composites subjected to transverse tension. However, in many applications of composite materials, design is based on the threshold for first crack formation, which is usually found to be transverse cracking in 90° plies. As shown in Fig.8, the macro-sized transverse crack is formed by the coalesce of debonds. As a result, understanding individual debond growth under transverse loading is the key to investigate the first macro-sized transverse crack growth.
Similar to the case for the study on longitudinal fiber/matrix debonding, single fiber composite models were widely adopted at the beginning due to its simplicity. Fig 12 shows the experimental set-up of a single fiber composite subjected to transverse tensile loading. In this composite, single fiber is placed at the center of matrix materials, and the whole specimen is subjected to transverse tension. During the test, fiber/matrix interface first debonds due to existing flaws, upon further loading, for relatively weak fiber/matrix interfacial bonding, it’s found by Zhang et al [100] that debond first grows along arc direction, and then propagates along fiber direction, however, for composites with good fiber/matrix interfacial bonding, it’s found that once initiated, debond growth along arc and fiber direction almost simultaneously and the debond angle decreases
18
with increasing distance from initial defect site. The whole process of interfacial transversely debonding is sketched in Fig.13.
Fig.12 Illustration of single fiber composite test. The specimen is subjected to transverse tensile
loading. (Figure adopted from [100])
Fig.13 Interfacial debonding processes for a single fiber composite. Figure adopted from [100]
When it comes to study fiber/matrix interface crack (debond) growth, energy release rate (ERR) is usually investigated as the driving force. The general trend for ERR (Fig.15) of a transverse debond in a single fiber composite could be found in a
19
numerical study conducted by Paris et al [101] for the model shown in Fig.14. As shown in Fig.15, for each material system, debond growth is mixed-mode. Both mode I ERR component (GI) and mode II ERR component (GII) increases first with increasing debond angle and then decreases. For relatively small debond angle, debond growth is mode I dominated and then switches to mode II dominated growth for larger debond anlge. With the further increasing of debond angle, the crack faces come into contact and debond growth is pure mode II. One of the first studies to investigate the ERR of debond under transverse tension was conducted by Toya [102] analytically where he considered single fiber was embedded in the infinite matrix material and derived the expression for the ERR of different debond angle. The similar fiber/matrix interfacial problem was later investigated by Paris et al [103] numerically using Boundary Elements Method (BEM). This is also one of the first numerical studies on fiber/matrix interface crack growth under transverse loading. This study, together with investigation performed by Varna et al [104] clearly demonstrate the a physical relevant crack face contact zone developed for relatively large debond angle and that contact zone increases with keep increasing of debond size. Paris and his co-workers later published a series of paper to clarify the unknown aspect of transverse debond growth for a single fiber composite. For example, when dealing with potential debond crack kinking out of interface toward matrix in a single fiber composite, Paris et al [101] found that the debond is most likely to kink out of interface between 60º ~ 70º of semi-debond angle, that’s when the ERR of kinked crack is the largest. Regarding to the effect of thermal stress, Correa et al [105] found that thermal stress has a protective effect on debond growth due to the compression nature of thermal stress in single fiber composite. A common question when modeling the debond in a single fiber composite is whether it should be a symmetric debond from both side of the fiber or there is only one debond? García et al [106] conduct the relevant study and conclude that based on the amount of energy required, single debond requires less energy and thus would be the most likely scenario. The discussions we have so far mainly focus on the debond growth in a single fiber composite under uniaxial tension along transverse direction. Some researchers also developed failure criterion to predict the onset of fiber/matrix interface debond under biaxial tension, for example work done by Carraro et al [107] and Mantič et al [108].
20
Fig.14 Illustration of the numerical model for single fiber composite. Figure adopted from [101]
Fig.15 Illustration of the trend for ERR of the debond in a single fiber composite. Figure adopted from [101]
Although single fiber composites are very useful in helping researchers understand some basic mechanisms of fiber/matrix interface debong growth under transverse tension. There aresome major limitations regarding to this type of model. One of the
21
most important limitations one might expect is whether single fiber composite could simulate the actual stress field in composite. Asp et al [93-95] studied the local stress field around fibers in the cross-section of a unidirectional (UD) composite loaded in transverse tension and based on energy considerations proposed that the debonding results from unstable growth of a cavity in the matrix near the fiber surface. These studies clarified the role of the triaxiality of the local stress field in initiation of debonding. Therefore, a proper understanding of debond initiation and growth is expected to come from multiple-fiber composite studies. Recently, a few studies have gone in this direction [109-111]. In [109, 111] the approach taken was to use a cohesive zone model, which has the interface strength and fracture toughness as two material properties. As noted above, Asp et al [93, 95] showed that failure at the fiber-matrix interface depends on the triaxial stress state, not on the tensile stress alone. This casts doubt on the use of a cohesive zone model for studying the debonding process. In [24], the concurrent and growth debonds have been investigated by linear elastic-brittle fracture based on a numerical model containing ten fibers embedded in a matrix cell. However, no detailed information about the influence of local fiber bundles on debond growth could be obtained from that paper. While these studies have been useful in generating understanding of the local interactions in the debonding process, two aspects need further clarity. First, the influence of inter-fiber distance on debond growth in a fiber cluster needs to be understood, and second, the debonding process should be analyzed in terms of the energy release rate (ERR) of the arc-shaped interface crack. These two aspects have been studied by Sandino et al [112], using a two-fiber model (Fig.16). As shown in Fig.16, an undamaged fiber at different locations near a central fiber with debond and it’s found that the neighboring fiber has a protective effect on debond growth at all positions except when the fibers are aligned with the loading direction. As useful as their results are, however the two-fiber composite model is still not representative of a real composite where multiple neighboring fibers are distributed around the fiber with debond.
22
Fig.16 Illustration of two fibers numerical model. Figure adopted from [112]
2. Objectives of current thesis
Based on the previous discussions, it’s clear that fiber/matrix interface debonding plays a key role in leading the initiation of the first damage event (i.e. transverse cracking) or final failure in a composite. Although single fiber composite model has been widely adopted by researchers conducting investigation on the fiber/matrix interface debonding mechanism, it’s now commonly accepted that single fiber composite model has major limitations and thus could not be a good representative of real composite. Despite the efforts by various research groups, current state of understanding on the fiber/matrix debond process is still limited, especially when the local micro-structures are present. There are uncertainties regarding to the effects of local micro-structures on fiber/matrix interface debonding process. As a result, this thesis is aiming to clarify some of those mysteries by specifically investigating the effects of presence of neighboring fibers on debond growth under longitudinal tension or transverse tension. The objectives of current thesis could thus be summarized into following two parts:
1. As the first part of the research, we will try to clarify the effects of neighboring fibers and their closeness on fiber/matrix debond growth under longitudinal tension. In this part of investigation, the debond growth from single fiber break will be studied using both axisymmetric and 3-D finite element (FE) model.
23
ERR is considered as the driving force for debond growth. Both energy method and fracture mechanics method will be adopted in order to calculate ERR; the distance between neighboring fibers and debonded fiber is varied in order to investigate the effect of fiber closeness on debond growth. Finally, we will also compare the results obtained from both axisymmetric and 3-D models to make an assessment of the ability of different FE model on this issue.
2. As the second part of the research. We will investigate the influence of neighboring fibers on fiber/matrix debond growth under transverse tension. In this part of study, debond is assumed to grow along circumferential direction of the fiber. Two scenarios will be studied, in the first case, only one debond is assumed to initiated, and the distance between neighboring fibers and debonded fiber would vary in order to investigate the effect of fiber closeness on transverse debond growth; In second case, besides the original debonded fiber, we would assume another fiber/matrix debonding occur at a neighboring fiber and try to clarify the effect of this debond in the neighboring fiber on the growth of original debond.
The current thesis research results in 5 scientific papers and we’ll describe some highlights of each paper in the following section.
3. Summary of appended papers 3.1. Paper A
Paper A is the beginning of current thesis research. In this paper, an axisymmetric FE model was developed in order to investigate the ERR of debond emanating from a fiber break along fiber axis. For this case, it was found that there are two distinct regions, one is when debond length are relatively long, and thus there is no interaction between debond tip and fiber break, debond growth in self-similar way; another situation is when debond length is short, and there is strong interaction between debond tip and fiber break.
For self-similar debond, the axisymmetric model is shown in Fig.17. The model consists of a fiber as a central phase (denoted as F), surrounded by a matrix phase (M), neighboring fiber phase (F), another matrix phase (M) and effective composite phase (C).
24
For self-similar debond growth the ERR can be calculated from the condition that at fixed applied load F the bonded region with length dld (Fig.17a) becomes a debonded
region with the same length dld (Fig.17b). Hence, the ERR for self-similar debond
growth can be found using the potential energy change U as:
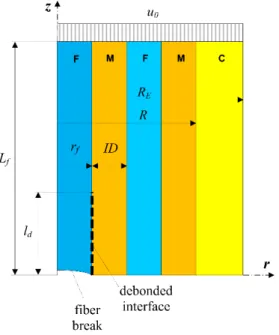
d f II dl r U G 2 (2) For short debond, the axisymmetric model generated is displayed in Fig.18. In principle it is very similar to the 5 cylinder model used for self-similar debond ERR calculation (see Fig.17) with the difference that the fiber break is included in the model, the fiber is partly debonded (with debond length denoted as ld in Fig.18) and the length
of the model Lf is significantly larger. The ERR is calculated using Virtual Crack
Closure Technique (VCCT) and J integral methods.
Fig.17 Schematic representation of a 5-phase FEM model: F – fiber, M – matrix, C – effective composite. a) bonded region; b) debonded region.
25
Fig.18 Schematic representation of a 5-phase concentric cylinder assembly FEM model for short debond energy release rate calculations: F –fiber, M – matrix, C – effective composite.
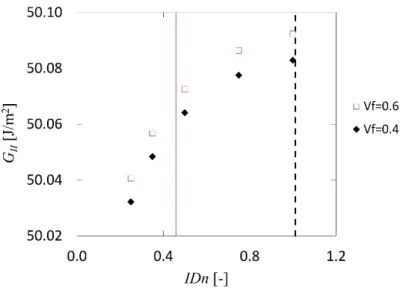
The major results of this paper are displayed in Figs.19 and 20. As shown in Fig. 19, for self-similar debond, for two fiber volume faction (Vf) studied, ERR is almost constant for differnet inter-fiber distance (IDn), which indicated that presence of fibers have little effect on ERR for self-similar debond. For short debond, as shown in Fig. 20, for each inter-fiber distance case, ERR decreases with increasing debond length and reaches a constant value when it approaches self-similar debond growth. The effect of neighboring fibers are more significant for shorter debond length.
Fig. 19 Energy release rate as a function of inter-fiber distance for self-similar debond growth.
26
Fig. 20 Energy release rate as a function of normalized debond length.
3.2 Paper B
Paper B summarizes a countinous study following the work done in Paper A. In paper A, we investigated the longitudinal debond growth using an axisymmetric model. Although it’s very convinient to use the axisymmtric model, we have to assume ERR is constant along debond front, which should not be the case as expected. As a result, In Paper B and Paper C, 3-D FE models (Fig.21) are created to investigate the possible angular variance of ERR and the difference between results obtained from 3-D model and axisymmetric model.
Fig. 21 a) UD composite with a broken and partially debonded fiber; b) Hexagonal distribution model; c) unit cell =30°
27
In Paper B, a 3-D FE model was first created to inverstigate the ERR of self-smiliar debond. Two different approaches are adopted to calculate the ERR. The first one is the enrgy method using the FE model shown in Fig. 22. It’s based on the same procedures as decribed in Paper A, we calculated the ERR based on the difference of potential energy between two unit cells. The second approach was to using the short debond model (Fig.21), and calculate the ERR usnig VCCT and J integral for relatively long debond length when debond is in a self-similar growth. This approaches is based on the findings in Fig.20, as we found ERR reaches a plateau for long debond length.
Fig.22. Representative volume element of bonded region (a) with length dld, which due to
debond growth changes to debonded region (b) with length dld
We now discuss some major results obtained from this study. First let’s look at the ERR result obtained using J integral based on short debond model. The angular variation of ERR along debond front is very clear for each inter-fiber distance case (represented by local volume fraction Vfloc, as displayed in Fig.23. And ERR has the
28
Fig.23 J-integral values for CF/EP Vf 0.6 in purely mechanical loading
z 1% obtainedusing the debond front model
Table 1. Energy release rate values for CF/EP Vf 0.6in purely mechanical loading
% 1 z
loc f V 0.66 0.72 0.78 0.60 (3-cyl) en G [J/m2] 50.22728 50.22197 50.21351 50.45131 J[J/m2] 49.38511 49.35217 49.27961 50.17184 I G [J/m2] -0.00238 -0.00241 -0.00210 0.01534 II G [J/m2] 50.16155 50.21543 50.28309 49.08337 III G [J/m2] 0.00460 0.00585 0.00500 0.00000029
Table 2. Energy release rate values for CF/EP Vf 0.4in purely mechanical loading
% 1 z
loc f V 0.66 0.72 0.78 en G [J/m2] 50.22189 50.21631 50.20757 J[J/m2] 49.54135 49.54620 49.47209 I G [J/m2] -0.00245 -0.00246 -0.00219 II G [J/m2] 50.31723 50.39105 50.47968 III G [J/m2] 0.004496 0.00595 0.00453Tables 1 and 2 show the comparison of averaged obtained ERR results for each debond length for each inter-fiber distance case with ERR calculated using energy method. Based on the results shown in Tables 1 and 2, ERR value is in good agreement for both models. Which give us an indication that for self-similar debond growth, although ERR is varied along debond front, the averaged ERR is almost constant and the presence of fibers has little effect on the averaged ERR.
The results discussed so far are for pure mechanical loading, the results for thermal loading could be found in Paper B attached in this thesis
3.3 Paper C
In Paper B, the ERR of self-similar debond emanating from a fiber break was calculated using 3-D models with the presence of neighboring fibers. In Paper C, we continued to look at the ERR of short debond using 3-D models displayed in Fig.21. Based on the discussion in Paper B, it’s clearly that the ERR is varied along debond front. For short debond, under pure mechanical loading, the same feature is found, as
30
shown in Fig.24. As a result, it is suggested that debond front would not remain circular during growth in reality.
(a)
31
(c)
Fig.24 a). Angular dependence of J-integral values for CF/EP in mechanical loading.z 1%
, loc f
V =0.78, b). Angular dependence of J-integral values for CF/EP in mechanical loading
% 1 z , loc f
V =0.72, c). Angular dependence of J-integral values for CF/EP in mechanical loading z 1%, loc
f
V =0.68.
Another interesting finding is that when comparing the results between averaged ERR obtained through 3-D model and ERR calculated by axisymmetric model discussed in Paper A. As shown in Fig.25, the values obtained from axisymmetric model is slightly higher. This is due the fact the in axisymmetric model, the influence of neighboring fibers are highest and the same along debond front, as a result, the ERR calcuated by axisymmetric model could be viewed as the upper bond for this longitudinal debond growth case.
32
Fig. 25 Average ERR against normalized debond length obtained by the 3-D hexagonal model and axisymmetric model
3.4 Paper D
Previous 3 papers focus on investigating the growth of longitudinal debond with the presence of neighboring fibers. In Paper D, we switches out focus on the fiber/matrix interface debond growth under transverse tensile loading. In this case, the debond will grow along circumferential diretion along fiber/matrix interface. The FE model adopted in Paper D is shown in Fig.26, it follows the same concept as previous models developed for studying longitudinal debond growth: the debonded fiber is placed at the center of the model, surround by the nearest 6 fibers in a hexagonal array UD composite. The debond is assumed to initiated from the one side of fiber, as indicated in Fig.26. Due to symmetry, only one half of the composite is modelled.
33
Fig.26 Model description
The general trend of ERR for transverse debond could be summarized in Figs. 27 – 29, which present the result for CF/Epoxy composite with volume fraction Vf=0.6.
Fig.27 shows the ERR of debond under pure mechanical loading. It’s shown that transverse debond growth is mixed-mode, for both mode I and mode II ERR components, they increases first with increasing debond angle and then decreases with further increasing of debond angle. For small debond angle, debond growth is mode I dominated and then switches to mode II dominated. At semi-debond angle at around 70º, crack surface come into contact significantly and debond grows in pure mode II. This angle where debond growth changes to pure mode II is called the transition angle, and that transition angle depends on the material system. For very small debond angle, the ERR increases with decreasing inter-fiber distance (or increasing Vfloc).
For when theraml stress due to cooldown process is considered, the ERR is found to derease compared to the results obtained in pure mechanical loading (Fig.28). This is due to the compressive stress generated during thermal cooldown for UD composite. However, for a laminated composite, because of the constraint from neighboring plies, transverse plies developed tensile stress globally, which results in higher ERR for debond in a laminated composite , as shown in Fig.29.
34
Fig.27 Normalized ERR with respect to debond angle for CF/EP UD composites under mechanical loading. εx = 0.5%. Vf = 0.6
Fig.28 Normalized ERR with respect to debond angle for CF/EP UD composites under thermo-mechanical loading. Vf = 0.6 , ΔT=-100°C, εx=0.5%
35
Fig. 29 Normalized ERR with respect to debond angle for CF/EP UD plies, equivalent to 90-layers of CF/EP cross-ply laminate under thermo-mechanical loading. Vf = 0.6, ΔT=-100°C, εx=0.86%
3.5 Paper E
In paper D we investigate the ERR of single transverse debond with the presence of neighboring fibers. Once the case for single transverse debond has been understood, we continue our inverstigation on the next relevant topic: what if there are two fiber/matrix interface debonds exist?.
In order to understand this problem, an FE model was created based on the previous mode discussed in Paper D. The difference is that in this model, another debond was assumed to be presence in neighboring fiber F1 or F2, as shown in Fig.30 (we only show debond in F1). Three cases of the composite with microdamage have been analyzed:
Case 1μ The central fiber has a debond angle θ. Remaining fibers are perfectly bonded.
Case 2μ The central fiber has a debond angle θ. Fiber F1 has Semi-angle of 60° debond on the left side.
Case 3μ The central fiber has a debond angle θ. Fiber F2 has 60° debond on the right side.
The main results for Case 1 and Case 2 are shown in Fig. 31. Based on the results displayed in Fig.31, it is clear that the presence of neighboring debonds increase the
36
ERR of central debond significantly, and that effect is more prominent when inter-fiber distance (IDn) is smaller.
Fig.30 Schematics of the model used for debond growth analysis around the central fiber showing explicitly the central fiber and the 6 closest fibers. One of them may have a Semi-angle of 60° debond on one side. The fiber/matrix unit is embedded in a homogenized composite.
37
(b)
Fig.31 Energy release rate versus debond length and Case 1 and Case 2 for different values of interfiber distance: a) Mode I: b) Mode II.
38
References
1. Talreja, R., Fatigue of composite materials: damage mechanisms and
fatigue-life diagrams. Proceedings of the Royal Society of London. A. Mathematical
and Physical Sciences, 1981. 378(1775): p. 461-475.
2. Gamstedt, E. and R. Talreja, Fatigue damage mechanisms in unidirectional
carbon-fibre-reinforced plastics. Journal of Materials Science, 1999. 34(11): p.
2535-2546.
3. Gamstedt, E.K., L.A. Berglund, and T. Peijs, Fatigue mechanisms in
unidirectional glass-fibre-reinforced polypropylene. Composites Science and
Technology, 1999. 59(5): p. 759-768.
4. Pupurs, A., Micro-crack Initiation and Propagation in Fiber Reinforced
Composites, in Engineering Sciences and Mathematics. 2012, Luleå University
of Technology.
5. Hull, D. and T.W. Clyne, An Introduction to Composite Materials:. 1996, Cambridge: Cambridge University Press.
6. Hedgepeth, J.M., Stress concentrations in filamentary structures. NASA TND-882, 1961.
7. Hedgepeth, J.M. and P. Van Dyke, Local stress concentrations in imperfect
filamentary composite materials. Journal of composite materials, 1967. 1(3): p.
294-309.
8. Fukuda, H. and K. Kawata, On the stress concentration factor in fibrous
composites. Fibre Science and Technology, 1976. 9(3): p. 189-203.
9. Goree, J.G. and R.S. Gross, Stresses in a three-dimensional unidirectional
composite containing broken fibers. Engineering Fracture Mechanics, 1980.
13(2): p. 395-405.
10. Fukuda, H., Stress concentration factors in unidirectional composites with
random fiber spacing. Composites Science and Technology, 1985. 22(2): p.
153-163.
11. Ochiai, S., K. Schulte, and P.W. Peters, Strain concentration factors for fibers
and matrix in unidirectional composites. Composites science and technology,

![Fig. 5 Illustration of clusters of fiber breaks. Figures adopted from [42]](https://thumb-eu.123doks.com/thumbv2/123doknet/14525477.722928/23.892.176.695.110.431/fig-illustration-clusters-fiber-breaks-figures-adopted.webp)