HAL Id: hal-01212524
https://hal.inria.fr/hal-01212524
Submitted on 6 Oct 2015HAL is a multi-disciplinary open access
archive for the deposit and dissemination of sci-entific research documents, whether they are pub-lished or not. The documents may come from teaching and research institutions in France or abroad, or from public or private research centers.
L’archive ouverte pluridisciplinaire HAL, est destinée au dépôt et à la diffusion de documents scientifiques de niveau recherche, publiés ou non, émanant des établissements d’enseignement et de recherche français ou étrangers, des laboratoires publics ou privés.
Energy-efficient Cloud Elasticity for Data-driven
Applications
David Guyon
To cite this version:
David Guyon. Energy-efficient Cloud Elasticity for Data-driven Applications. Computer Science [cs]. 2015. �hal-01212524�
Master research Internship
Master Thesis
Energy-efficient Cloud Elasticity for Data-driven Applications
Domain : Cloud Computing, Energy Efficiency, Elasticity
Author:
David Guyon
Supervisor: Anne-C´ecile Orgerie, CNRS Christine Morin, INRIA Myriads research team
Abstract
The Cloud evolves everyday to give better services like on-demand storage and on-demand compute resources. The increase of the demand of Cloud services raises environmental questions. The electricity consumed per year for running these services is more important than the annual electrical consumption of India.
There are studies proposing solutions to lower the power consumption of the data centers by consolidating the system and turning off some servers. These solutions focus on the Cloud to save energy and do not take the users into consideration.
The solution we propose to this energy problem is to offer the user a simple control to manage the energy impact of her application in the Cloud. Our study is focused on scientific data-intensive applications. She can choose between energy efficient and performance execution mode which results in more or less resource allocation in the Cloud for her application. Less resource allocation allows a better consolidation of the virtual machines, and favors the shutting down of more unused physical servers.
For the evaluation we deployed our solution on Grid’5000, a French platform for experiment-ing distributed systems. As benchmark we ran Montage, a workflow dealexperiment-ing with astronomic images of the space. The evaluation shows promising results in term of power consumption. The execution time of the workflow is longer in energy efficiency than in performance but the energy saved is worth it.
Our solution can thus provide trade-offs between energy and performance which are different than the one usually provided.
Contents
1 Introduction 2
2 State of the Art 3
2.1 Review of Available Cloud Infrastructures . . . 3
2.1.1 One Need Behind Cloud Computing’s rise: Handling Flash Crowds . . . 3
2.1.2 Cloud Computing Definition . . . 3
2.1.3 Cloud Solutions Against Flash Crowd . . . 4
2.1.4 Introduction to Virtualization . . . 4
2.2 Energy Consumption in Data Centers . . . 5
2.2.1 Zoom on Wasted Energy . . . 5
2.2.2 Virtualization and Energy Consumption . . . 6
2.3 Data Challenges in the Cloud . . . 7
2.3.1 The Way it is Implemented . . . 7
2.3.2 Energy-Efficient Data Management . . . 8
2.4 Flexible Usage at the Expense of Higher Energy Consumption . . . 9
2.4.1 Introduction to Elasticity . . . 9
2.4.2 Resource Monitoring Systems . . . 9
3 Our contribution: A User Controlled System for Green Cloud Computing 12
3.1 Motivation . . . 12
3.2 Architecture Overview . . . 14
3.2.1 General Cloud Architecture . . . 14
3.2.2 Host Selection . . . 15
3.2.3 Hosts Power Optimization . . . 18
4 System Implementation 20 4.1 Tools . . . 21
4.1.1 OpenStack . . . 21
4.1.2 FRIEDA . . . 21
4.1.3 Python packages . . . 22
4.1.4 Callback mechanism using Netcat . . . 22
4.1.5 Power Management Simulation of the Hosts . . . 22
4.1.6 Mutual Exclusion for Synchronization . . . 23
4.2 Software Design . . . 23
4.2.1 Project Architecture . . . 23
4.2.2 Execution Scheduling . . . 24
5 Experimentations 27 5.1 Experimental Platform . . . 27
5.2 Power On Simulation on the Hosts . . . 27
5.3 Montage Workflow . . . 28 5.4 Experimentation . . . 29 6 Conclusion 35 6.1 Contributions . . . 35 6.2 Experience Gains . . . 35 6.3 Future Works . . . 36
6.3.1 Automatic parallelization of the workflows . . . 36
6.3.2 Montage Benchmark using all available CPUs . . . 36
6.3.3 Reuse already created Instances . . . 36
6.3.4 Integrate Workflow Management into FRIEDA . . . 36
6.3.5 Design incentive economic models . . . 36
A Appendix: YAML file for FRIEDA 40
B Appendix: YAML file for workflow description 42
Preface
I did my internship at the IRISA/Inria Rennes, Bretagne Atlantique laboratory. Inria stands for the French ”Institut National de Recherche en Informatique et en Automatique” which means ”French Institute for Research in Computer Science and Control”. IRISA stands for ”Institut de Recherche en Informatique et Syst`emes Al´eatoires” meaning ”Research Institute of Computer Sci-ence and Probabilistic Systems”. The laboratory was established in 1967 when the Plan Calcul was introduced. This is a French governmental program launched in 1966 and approved by Pres-ident Charles de Gaulle in order to promote the computer industry and the associated research activities. Today, there are more than 40 teams in the Rennes site working on different research topics.
For the internship of my second year of Master degree I joined the Myriads team. The objective of Myriads is to design and implement autonomous distributed systems. The team tackles the challenges of dependable application execution and efficient resource management in the future Internet of Services. It currently focuses its research activities on Cloud Computing, addressing in particular energy management in Clouds.
The internship was supervised by Christine Morin and Anne-C´ecile Orgerie. Christine Morin is senior researcher at Inria and also the Myriads team leader. Anne-C´ecile Orgerie is researcher at CNRS and member of the Myriads team.
Acknowledgement
I would like to thank Anne-C´ecile Orgerie and Christine Morin for helping me all along the internship, for their helpful suggestions that helped me improve this report and for giving me a great experience of the research world. This experience will be essential for my future in this area. I am also grateful to Matthieu Simonin for his time when I had troubles with OpenStack and Pascal Morillon for helping me using Grid’5000. I also would like to thank Julien Lefeuvre for the complete and interesting answers he gave to my many questions.
Finally I am thankful to the Lawrence Berkeley National Laboratory, especially to Devarshi Ghoshal for his support with FRIEDA and above all for this interesting international collabora-tion.
1
Introduction
The Internet is now more than 40 years old and the demand is still growing every day. Plenty of web applications have appeared recently, like Google Doc, Youtube and they quickly became essential tools in our everyday life. Each of these applications consumes storage, network and computing resources and this is why, in the last decade, a lot of data centers flourished all around the world.
A growth in the number of data centers and thus in resources, implies a significant increase in power consumption. With climatic changes and how fast the Internet evolves, an important care should be taken about the energy data centers consume. Hopefully, there are researchers making studies on this energy consumption problem. They try to explain the trend of the energy consumption in data centers and to locate where the energy wastes are. They propose solutions to minimize these wastes with as little impact as possible on the performance of the client’s applications but, as explained in the state of the art section, these solutions remain complex to configure. Sometimes the user does not have any control of this configuration and sometimes there are too many complex parameters to control.
The internship subject is to define a new model which gives the ability to an ordinary user to choose how efficiently an application will be executed in terms of energy and performance. An easy-to-use knob is available to the user which allows her to adjust the execution from total energy saving to high performance execution. Thus the application can have a high performance run with an important consumption of energy, or it can have an energy-efficient run where the performance is not as high as it could be.
The execution mode selected by the user have an impact on the amount of resources allocated to her application. With an energy-efficient run, the virtual machine running the application has fewer resources and allows a better consolidation of the virtual machines. The consolidation improvement may increase the number of unused physical servers that can be shut down.
The duration of the internship did not allowed us to run complex experimentations. The experimentations presented at the end of the report are still preliminary works that should be improved before the oral presentation.
The rest of this report is organized as follows: Section 2 presents the state of the art in the domains of Cloud Computing, Data Management, Energy and Elasticity. In Section 3, we discuss our contribution to this research area. The system implementation we designed is explained in Section 4. Then, the result of our contribution is shown in the experimentation described in Section 5. Finally, Section 6 concludes.
2
State of the Art
This section presents the state of the art in the domains of Cloud Computing, Data Management and Elasticity with an important glance on Energy. It contains a review of the ideas and the tools presented in the papers that were read for the bibliography and presents the ones that are essential to properly realize the internship.
2.1 Review of Available Cloud Infrastructures
The word Cloud is new if we don’t talk about the ones in the sky. By Cloud, we mean Cloud computing and there exist different definitions of this word. In this section we start with a presen-tation of local servers and we explain what a flash crowd is. Then we define Cloud computing and explain why we need the Cloud today. Afterwards we present an example where the use of Cloud is essential. Finally, we introduce the notion of virtualization.
2.1.1 One Need Behind Cloud Computing’s rise: Handling Flash Crowds
Before Cloud was invented, web applications were hosted on local servers. The application runs on a server with a fixed amount of resources depending on the application needs. When the ap-plication popularity increases, the number of users accessing this apap-plication also increases causing unanticipated use of the network and computing resources present on the server. This large crowd peak caused by the popularity of the application is called flash crowd. In the best cases the server is slowed down by the load but sometimes the server completely crashes and the clients lose access to the service. An immediate solution is to add another local server on which the same application is running. This solution quickly becomes unmanageable for the user because the second server may not be enough to support the load and the server will be useless after the peak of visits [14, 15].
2.1.2 Cloud Computing Definition
This new term, Cloud computing, is a computing terminology that defines the fact of using many servers all together to run one or more applications on it. A Cloud is made of computing resources (e.g., networks, servers, storage, applications, and services) that are available on-demand through network accesses. The users can request access over the Internet for computing resources to run their applications [22]. The regular pricing model is the pay-as-you-go model. The users only pay for the amount of resource that is used. As an example, Dropbox is a service running in the Cloud with an important use of storage resources and network resources. However, its need for computing resources is less important than the storage and the network resources.
There are different levels of services in a Cloud [20]:
IaaS (Infrastructure as a Service) is the lowest level where the consumer requests for computing resources such as processing, network or storage resources. Amazon Web Services provides one of the most popular IaaS, Amazon EC2 [1]. It allows users to rent virtual computers on which to run their own computer applications.
PaaS (Platform as a Service) is the middle level often used by developers because it provides a programming and execution environment. Google’s App Engine [4] is a PaaS where the developers develop and deploy their applications.
SaaS (Software as a Service) is the highest level of a Cloud. The client directly communicates with a software running in the Cloud. Google Docs is an example of SaaS where the clients use it as an on-line text editor without knowing the platform or the infrastructure used in background.
2.1.3 Cloud Solutions Against Flash Crowd
As an illustrating example, we take a website that stores pictures during a specific amount of time. Anyone can upload a picture to the platform and receives a link when the upload is done. The link points to the picture and can be shared freely. When the deadline is reached, the picture is automatically removed and the link becomes dead.
If it is running on a local server, when a flash crowd occurs, a large number of picture uploads will happen and the storage will be too small if it is not designed to support it. A large variety of Cloud solutions exist that allow web applications to support flash crowds with a cost depending on the load.
In our example, a good solution would be to use Amazon S3 [2] that offers a resizable Cloud storage with a pay-as-you-go pricing. When a flash crowd occurs, Amazon S3 automatically scales up the storage space according to the price the application owner agreed to pay. If the account doesn’t have enough money, Amazon S3 will scale up the storage space as much as it can but when the maximum is reached, the application may fail because it cannot find any place to save the upcoming pictures.
With compute-intensive applications or maybe because we want to leave the local server design, a good solution is Amazon EC2 [1]. The user can rent a Virtual Machine (VM) with variable resources. The term outsourcing defines the action of using this kind of external resources. Virtu-alization is presented in the next paragraph.
2.1.4 Introduction to Virtualization
In an IaaS, physical resources are shared between many virtual computers that any user can rent. When a user rents a virtual computer, he can install an Operating System (OS) from a list provided by the Cloud provider. This kind of virtual computers are usually called Virtual Machines (VM) and from the Cloud provider point of view, they are simple files that can be manipulated like any other files: creation, deletion, edit and move. The VM file is called an image. From the VM point of view, its resources, such as RAM, disks, network bandwidth are virtual resources because they can be changed at any time. In our pictures hosting example, if the need for storage increases, the client can ask the VM controller to allocate more hard drive space to the VM.
In [11], D. Cerbelaud et al. present four platforms to manage VMs: ECP, Eucalyptus, Open-Nebula and oVirt. These platforms have similar features, such as storing the VM images, uploading the images to hosts, and different implementations for each feature. Some platforms also have ad-ditional features. For example, some of them give the ability to choose the VM host and to take snapshots in order to recover a stable state when an error occurs. An important feature that only
OpenNebula supports among these four solutions is live-migration. The live-migration feature is the action of moving a VM during its execution from one host to another. The migration implies a short time (about a few seconds) when the VM is unavailable until the last few pages are trans-ferred to the new host. OpenNebula also provides a monitoring feature that allows the hypervisor to know the amount of CPU used, the amount of reserved and used memory, the network traffic, etc.
Virtualization gives to the developer the ability to configure its VM with more resources as well as to duplicate the VM. Duplicating the VM allows to balance the load of an application on as many instances as required by the demand. Thus, the application level will need a tool to fairly distribute the load over the VMs: a load-balancer. With a load balancer the client appears to communicate with a single host. In the server side, it assigns the client to a specific VM depending on their current load [15]. This system has its limitations. It takes about 1 minute to scale up (ability to redirect to a newly created host) and when scaling down it must wait for all client sessions to terminate. Despite its ability to handle host failures, if it is the load balancer that fails, the system experiences total failure.
Despite the myriad of existing Cloud solutions, each of these solutions offers to the user different features. This bibliographical study allows us to determine which of these features we are going to use. We are mainly interested in live-migrations and energy monitoring. These platforms are proven tools that give us the foundation for our future work. Features like live-migration and system information such as CPU usage are essential for our study.
2.2 Energy Consumption in Data Centers
In [19], the authors present the evolution of the electricity used per server from 2000 to 2010. From 2000 to 2005, there was a doubling in power used but after 2005, this trend began to slow. The reasons are 2008 and 2009 financial crisis, the expanding of virtualized systems and the arrival of power management which reduces the electricity consumption. It is estimated that data center servers currently consume about 0.5% of the total electricity consumption in the world and the percentage will be quadruple by 2020 if the current demand continues to go on [26].
2.2.1 Zoom on Wasted Energy
A.-C. Orgerie et al. present in their survey [23] a list of the origins of wasted energy in data centers, such as cooling, high frequency CPUs and unused servers. Hereafter we expose a few solutions from this paper to minimize these wastes.
At the data center level, cooling is an important energy consumer and its operation consumes almost half of a center’s total energy. Google built an innovative free cooling data center in Hamina, Finland. It uses the cold water from the sea to cool the servers down and then keeps the warm water outside until it reaches the temperature of the sea in order to cause no impact on the environment. At the server level, when we take a close look at a server, we can see that an important amount of energy is used by the CPUs, at each disk access and sometimes because of unused USB ports. Many solutions exist, like scaling the voltage and the frequency of the CPUs (DVFS) and reducing disk accesses with a smart use of the memory. A correct BIOS configuration of the servers as well
as turning the servers into sleep mode after not being used for a specific amount of time can have a significant impact on the total energy consumption.
The authors of [23] also show that, on average, a farm of servers contains about 10% of unused servers. The reason can be an unvisited website with its VM living all alone on a server. The server is said to be in an idle state. When the server is not loaded with a user application, an important amount of energy is consumed to maintain the OS and the hardware peripherals such as disks, memory, motherboard, PCI slots, and fans. The authors in [16] reported that today’s servers consume up to 50% of their peak power when idle. This kind of consumed energy represents the static energy consumption of the server. Their idea is to use live-migration in order to concentrate as much as possible VMs on a single host and then to turn off the empty ones. It is on this specific problem we want to concentrate our work. Section 2.4 presents few already existing solutions against this waste of energy.
2.2.2 Virtualization and Energy Consumption
A system using virtualization has an additional software layer responsible for the allocation of the available physical resources to each VM. Original systems do not have this layer because there is a single OS per machine and because it is running alone on the server, it has access to all the resources. At first glance, the original system solution seems to consume less energy but how efficiently is it consumed? In our picture hosting website, when nobody is using it, the application does not use any of the server’s resources. At this stage, the server’s performance is very low. Then when the traffic increases, the server’s performance also increases but probably not even to 100% performance because of unused resources. These unused resources could be used by another application. Virtualization allows the system to run more than 1 OS per server and thus 2 applications (2 VMs) using 50% of the total resources of a server can run side by side on the same machine. Even if the software layer consumes a fraction of energy, the server runs with 2 applications on it at its maximum performance because all the resources are used. Equivalently, the original system solution would run 2 servers at 50% performance each which implies a double in static energy consumption and an important amount of unused resources on both server.
The amount of resources an application needs varies constantly, thus varying the general per-formance of a server. In our example with 2 applications living side by side, if one needs more resources they won’t be available instantly because the server already has 100% of its resources used. A reconfiguration must be computed to allocate the VM executing the application to another server with enough available resources. The reconfiguration takes time and energy. When the VM moves, it takes network traffic energy, storage energy and computation energy. In some cases, the consumer agrees to have a little performance degradation, for example by exceeding the deadline of its application. This agreement allows the reconfiguration to be performed in order to save a maximum of energy.
A reconfiguration often implies a live VM migration. Doing a migration has different costs (e.g. energy cost, time cost, resource cost) that can be minimized if done in a smart and efficient way. H. Liu et al. present in [21] a live migration model relying on the principle of dirty pages. Rather than shutting down the VM, do the transfer and then restart the VM in another server, their model splits the VM into pages and transfers the fixed parts to the other server while the VM is still running. When the only parts left are parts containing memory constantly changed by
an application, the VM is stopped and the remaining parts are transferred. It is only now that the service is suspended for a short time slice (so short that it is sometimes neglected). When all pages are in the new server, the VM is launched from its previous state. Indeed, the memory is also copied during the migration thus the VM does not reboot but simply continues its execution as if nothing had happened. An energy consumption prediction model of live VM migration allows determination whether the energy savings are greater than the energy cost. They show that their model leads to significant gains both in term of migration latency and energy savings.
A performance and energy consumption analysis tool for Cloud systems called StressCloud is presented by F. Chen et al. in [13]. This tool can collect performance information and energy consumption information of Cloud systems. Their experimental results reveal interesting behaviors. Firstly, the energy consumption of computation-intensive applications increases dramatically when CPU usage increases. However, the energy consumption of a memory-intensive application remains stable when the memory usage increases. Secondly, they show that parallelization is a good practice to save energy and time but parallelizing an application in too many tasks can make it worse. Finally, separating computation-intensive, data-intensive and communication-intensive tasks into different VMs rather than mixing them together into the same number of VMs is more efficient in two ways. It is more energy-efficient because having the same kind of tasks grouped together implies less information exchanged between VMs. It also gives a higher throughput because the application executes faster thanks to the reduction of information exchanged. Their analytical results can be used for the design of an application running in the Cloud in order to maximize performance and minimize energy usage.
There are plenty of possible optimizations to save energy. However, they are complex and often executed in a dynamic way by the IaaS with no consideration to the users needs.
2.3 Data Challenges in the Cloud
Applications running in the Cloud sometimes need a lot of data input and generate important amounts of data. Here, we are facing different data challenges: data storage, data processing, data movement and data management. An application generating a large amount of data implies a storage space adapted to this data generation and also a data movement system to transfer it. Each application uses and produces data differently. In our study we focus on scientific applications that are data-intensive workflows. Compared to other applications, scientific applications can process dozens of gigabytes of data, compare data with results from previous executions and have a large data output size.
2.3.1 The Way it is Implemented
When designing an application, the developer needs to take into consideration the wide variety of tools available in the Cloud. Its application may be designed as a centralized system with one single large application with large amounts of data or as a distributed system with large number of applications each with a small data footprint. An example of data implementation in a centralized system is to use Key-Value stores such as Bigtable [12]. Relational database technology will allow applications to scale out to petabytes of data, a much more economic solution than expensive commercial solutions [10]. From a higher point of view, the use of Amazon EC2 and Amazon S3 is
a good combination. The data is stored in Amazon S3 buckets and the computations are done on Amazon EC2 instances. All processes are sharing together these buckets and can transfer data to the Cloud and from the Cloud.
2.3.2 Energy-Efficient Data Management
In their paper [24], C. Szabo et al. propose a framework for task allocation that considers data transfer and execution time. Their approach is based on the locality of tasks in a Cloud and the order on which they are executed. Processes execute on Amazon EC2 instances and generate their output on Amazon S3 buckets if it is needed by another process. Thus, another process can use the output present in a bucket if its computation depends on previously generated output. The aim is to minimize the data transferred between tasks and also the execution runtime by moving the execution close to the data and by a smart parallelization of the tasks. The data is dispatched in different sites, this is why the system assigns each task to the site that has most of its input files (locality-aware). This approach performs well for computationally-intensive workflows but is mainly efficient for data-intensive workflows. To facilitate data locality they only transfer data products to the S3 storage when needed by child tasks running on other EC2 Cloud instances. They achieve a significant improvement in data transferred and the ordering of tasks allows a reduction in runtime.
Moving the execution close to the data can make important improvements in data transferred, in runtime and thus in energy consumption. However it is not always better to move the execution as shown in [17]. In the case of a data-intensive application, previous results have shown that it is better to move the execution close to the data in order to have a minimum of data transferred. In the case of a computation-intensive application, there isn’t any improvement when moving the execution because the data size is negligible compared to the computation. Always moving the execution to the data is not a good practice because it depends on the type of the application we want to make more energy-efficient.
D. Ghoshal et al. [17] pointed out this fact while testing FRIEDA. It is a framework developed at the Lawrence Berkeley National Laboratory, California. It is currently maintained by Devarshi Ghoshal, a Postdoctoral researcher in the Data Science and Technology group. FRIEDA is a tool to manage data transfers from the Cloud and to the Cloud and to automatically configure the storage system and the VMs in order to respond to the applications’ needs. It provides data locality to an application at run-time in a transparent way by managing data transfers to the Cloud and from the Cloud. It separates the execution mechanism into two levels: data control and execution phases. FRIEDA contains 3 components: the controller, the master and the workers. The execution lifetime starts with a data transfer and when it is done the process execution starts. They have different ways to partition data: no partitioning, pre-partitioning and real-time partitioning. Pre-partitioning is used when the needed data is pre-determined allowing each node to have the data it needs for its computation thus saving on data movement costs. The real-time scheme is used when each computation is not identical or when additional resources might become available during the execution. The results show an important speedup when using parallelization and that the decision of moving the data to the task and vice versa depends on the type of application: data-intensive or computation-intensive.
Figure 1: System architecture of the system presented in the paper [25]
This aspect has to be taken into consideration if we want to reduce the consumption of an appli-cation or a Cloud infrastructure.
2.4 Flexible Usage at the Expense of Higher Energy Consumption
2.4.1 Introduction to Elasticity
N. R. Herbst et al. proposed a definition of elasticity in [18]:
Elasticity is the degree to which a system is able to adapt to workload changes by provi-sioning and deproviprovi-sioning resources in an autonomic manner, such that at each point in time the available resources match the current demand as closely as possible.
An elastic system is able to allocate more resources, automatically or not, to an application in an underprovisioned state. If the application is overprovisioned, the system frees the resources in order for the application to meet an optimal state. These actions are named scaling up and scaling down and the time it takes to execute and how precisely represents the efficiency of the elastic system.
Two kinds of elasticity are presented in [25]: vertical elasticity and horizontal elasticity. Vertical elasticity dynamically changes the hardware allocation of a running VM. It is typically the action of adding CPU and RAM. Horizontal elasticity doesn’t act in the hardware but in the number of allocated VMs to a specific service. The application is running in parallel in a varying number of VMs. A last feature used for elasticity is DVFS. DVFS means Dynamic Voltage and Frequency Scaling and corresponds to the action of dynamically changing the voltage and the frequency of a CPU depending on the current load of an application running on it. It allows another dimension to power management. It is also possible to turn on and off individual cores. This feature is called VOVO for Vary-On/Vary-Off.
2.4.2 Resource Monitoring Systems
S. Tesfatsion et al. present in [25] a system that combines horizontal and vertical scaling and CPU frequency changing to improve energy efficiency. Their system model takes as inputs the
CPU frequency, the number of VMs and the number of cores and gives real-time measurements of the power usage and the performance of the system. The system is able to adapt the available resources depending on the need of an application. An optimal configuration is automatically made to minimize energy consumption while meeting the performance target. A manual edit of the configuration is hopefully available. It can be used to remove large oscillations in the resource allocations.
Their model equation takes 3 configurable constants: α, β, γ. As shown in Figure 1 the controller of the system adjusts the configuration in a control loop that compares the current state of the system and the reference signal which is the image of the target performance. In its calculation for the new configuration, it uses these 3 parameters. The α constant represents the weight for energy saving and β is the weight for guaranteeing application performance. The last constant γ controls the stability of the system. By varying the parameter α the system reacts more or less aggressively to minimize energy consumption. With β, it focuses on performance and thus respond more quickly to performance deviation. With only α and β a problem of oscillation may occur. Indeed, minimizing energy consumption (α value near 1.0) causes the system to react aggressively and reconfigurations happen too often. The γ parameter allows to accomplish the optimization in a stable manner. It defines how fast the system should react in order to avoid oscillations.
2.4.3 Elasticity to Save Energy
In the previous section, we have seen how to monitor a system thanks to a control loop that does reconfigurations depending on three parameters and few words have already been said about saving energy, such as DVFS and VOVO [25].
EARH, for Energy-Aware Rolling-Horizon, is an algorithm made by X. Zhu et al. [26]. This algorithm does a real-time energy-efficient task scheduling by dynamically starting hosts, closing hosts, creating VMs, canceling VMs and migrating VMs according to the system workload. A model calculates the energy consumption for each task ti and is also able to calculate the energy
consumption of a host hk depending on the states of the VMs vjk it owns. Each host contains
running VMs and VMs in an idle state. An optimization it uses to save energy is the migration of the running VMs to another host in order to empty a host from VMs which are not in an idle state. The idle hosts can be shut down, which further reduces the total energy consumption. Another optimization is to consolidate the current VMs to make room for creating new VMs on it when the task count increases.
The authors of [16] designed a sophisticated model for elastic systems which handles dependen-cies between tasks and the deadline of each task. Their idea is to represent the workflow in a graph of tasks Gawhere the vertices are the tasks Tia and the edges the dependencies between tasks Wi,ja .
Each dependency contains a weight representing the amount of data that needs to be transferred from Tia to Tja.
The tasks have a deadline called Worst-Case Execution Time (WCET). If the deadline is ag-gressive, the system will allocate more VMs to the workflow Ga and if the deadline is too tight, the
request will be rejected or dropped during the scheduling because the system is not able to execute it on time. An admission control is executed in two passes. First, the system tries to schedule the tasks in Gadepending on their deadlines with infinite resources. If it is impossible to schedule, the
cause exceeded deadlines. If deadlines are not met too often, the workflow is also rejected.
In their paper, Y. Gao et al. bring a new feature in the energy saving quest. Each server has an optimal utilization level named Optx which is around 0.7. It means that over 70% of CPU
usage, the CPU consumption is no longer linear and consumes a lot more. The system tries not to exceed this value during the scheduling operation to minimize the total energy consumed by the data center. A trade-off is made between energy efficiency and dropped requests. When properly configured it allows to improve the energy consumption costs from 16% to 23% depending on the number of users to serve.
Smart elastic reconfigurations allow data centers to save energy but require as compensation complex models with many parameters which are difficult to automatically configure according to applications. This is why the Cloud user is rarely involved in the elastic reconfiguration decision making and when involved the user is unable to consider its application performance because the infrastructure does not provide other elements.
3
Our contribution: A User Controlled System for Green Cloud
Computing
3.1 Motivation
Our goal is to minimize the electrical consumption that exists in the Cloud. In the state of the art, it has been seen that various studies and works contribute to the saving of energy in the Cloud by turning off the hosts when they are empty. Turning off as many hosts as possible allows to significantly reduce the energy consumed as static consumption is high. The difficulty is that it is impossible to power off a host while there are remaining VMs running on it. A solution is to consolidate the workload in order to concentrate all the VMs on as few hosts as possible. The consolidation can empty few hosts. Thus, the empty hosts can be turned off and the saving of energy becomes possible.
A Virtual Machine is often called an instance. When creating an instance in the Cloud, a flavor has to be selected. A flavor corresponds to the hardware configuration of the instance. A list of flavors is presented in Figure 2. As for example, the medium flavor has 2 CPUs, 4 GB of RAM and 40 GB of HDD. The flavor selection is made depending on the amount of resources the application needs. If the application needs 1 CPU, 2 GB of RAM and 10 GB of HDD, the small flavor is chosen. The selected flavor defines the size of the instance on the host. An instance with a flavor that requires a lot of resources makes the consolidation more difficult to perform than with smaller instances as hosts capacity is limited.
Figure 2: List of flavor types
Solutions dealing with the saving of energy have been presented in the first section. They opti-mize the instances distribution to be able to turn off as many hosts as possible and also consolidate the system to avoid turning on a new one. The reconfiguration of a system is made in an automatic way and can be costly if oscillations occur during the reconfiguration. In the existing systems, none of them consider the user as a main lever to save energy. Sometimes the user does not have any control over the system execution and when the user has a way to adjust a few parameters she does not feel comfortable to control them because they are too complex to use.
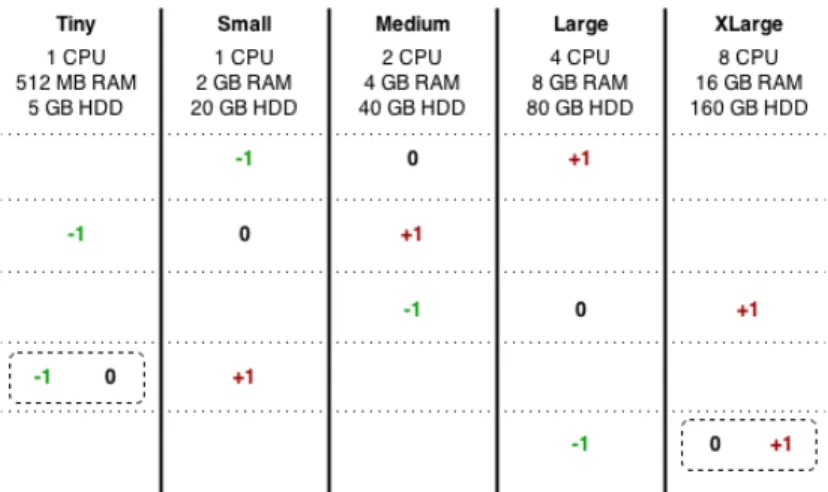
Our objective is to design a system where the user can make a trade-off between energy effi-ciency and performance. We choose to provide a simple control on this trade-off with 3 possible values: energy efficiency, normal execution and performance. The system takes into account this trade-off during the flavor selection management. First, the system selects the best suitable flavor depending on the user application needs. It corresponds to normal execution. Then, if the user chooses an energy efficient run or a performance run, the system selects the flavor type just under or above the best suitable flavor. Figure 3 illustrates this selection mechanism for the possible options. Each black zero corresponds to the best suitable flavor for the current application. The green −1 and the red +1 are respectively the energy efficient and the performance flavor choices.
Figure 3: Table showing the flavor selection mechanism
The application the user wants to execute on the Cloud has to be uploaded to the system. As specified in the state of the art, we focus our work on data-intensive scientific applications and so, the system is optimized for this kind of applications. In our case these applications are called workflows because they are composed of different steps with data flow between steps. As an example of workflow, it can be an astronomic application dealing with a large number of images of space.
Figure 4: Simple workflow ex-ample
An important data flow rate exists in and out of the workflow and these data transfers need to be handled by an application focusing on this data problem in order to be efficient. This application is introduced in Section 4.1.2.
A step of the workflow corresponds to a part of the workflow that runs alone on a single instance. Steps may run in parallel or in sequence depending on the workflow design. Each step has spe-cific needs for resources in terms of CPU, RAM and HDD. Figure 4 depicts a simple example of workflow that has 2 steps running in parallel and then a final step which is executed when the 2 first ones are terminated. As shown in the example, the required resources can be different between steps. The flavor selection presented just above applies for each step of the workflow. Thus, an energy effi-cient execution mode implies all steps to run on an instance with a flavor just under the best suitable one. The same applies for a
performance execution mode, the flavor just above the best suitable one would be chosen.
So, the user sends her workflow and the execution mode she selected. The energy efficient execution mode allows the controller to allocate less resources than planned to each step of the workflow. It can result in a longer execution time but in return, it allows to have more remaining free resources on the host. If the performance mode is chosen, more resources than needed are allocated to the workflow. It can speedup the execution time but takes more room on the hosts.
A user that accepts to lose a bit of performance is important in this system. The saving of energy is focused on the act of turning off the hosts. If a user agrees to have less resources for her workflow, it means that one or more workflows can probably run beside the first one on the same host. Indeed the workflow takes longer to execute but, is the energy consumed by the exceed execution time worth the static energy of a new host? If we keep in mind that other workflows run beside our workflow, taking longer to execute may not be a problem. The static energy can be divided by the number of users currently using the host. The more users there are, the less static energy is consumed per user. Experiments in the next section will show the amount of static energy consumed by a host and the importance of turning them off.
On the other side, someone who chooses performance can have an execution time faster than originally intended. But her workflow will take more resources on the hosts and may require turning on new hosts to respond to the workflow’s demand. In addition, some resources may be useless in case of low parallelism. In result, the total energy consumed by the Cloud is more important because of the static energy of the new hosts that had to be turned on.
More than green awareness, we need an incentive mechanism to motivate the user to turn green. An idea would be to establish a pricing system depending on the user’s choice. This system would give the user the opportunity to pay less if she chooses to run the workflow in an energy efficient mode and to pay more if the performance mode is chosen. The additional price would correspond to a kind of carbon tax. In normal execution mode, the price would be the usual one. The study of incentive mechanisms and pricing models is out of the scope of our work. Our contribution is focused on giving the user an easy-to-use way to adjust the execution of her application in the Cloud. This parameter can be represented as a knob similar to the one presented in Figure 5 that moves from energy efficiency to performance.
Figure 5: Knob to select the execution mode
3.2 Architecture Overview
3.2.1 General Cloud Architecture
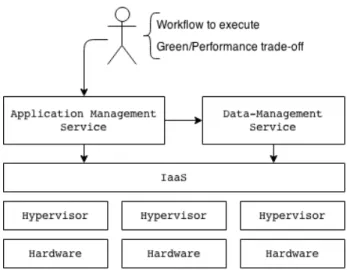
We designed the architecture of our system in layers as shown in Figure 6. The layer at the very bottom represents the physical machines which we call hosts. The Infrastructure-as-a-Service layer is the program that manages the Cloud. It has a panel of available hosts where the VMs are executed. It receives commands from the above layers like instance creation or deletion and can retrieve information about the hosts and instances states. On each host a hypervisor program is running and has direct access to the hardware in order to provide the memory management and the CPU scheduling of all VMs. Thus this hypervisor layer is responsible for the management of the VMs on a host. It handles the creation of the instances and also their execution. The application management service is one we built from scratch. It is the user entry point. The user is asked to upload the workflow she wants to execute and also the chosen execution mode. Then the system
Figure 6: General cloud architecture
selects the flavor that will be used at each step of the workflow depending on the required resources and the selected execution mode. When the flavors are defined, the program requests the IaaS layer to give the amount of available resources on each host. For each instance to create, an algorithm searches for the best suitable host where to create the instance. The selection is made in order to avoid turning on a host and thus consolidate the system as much as possible. This algorithm is explained in more detail in the next section.
The last component is the data-management service. This service is responsible for all data transfers and for preparing the instances for the workflow execution. Assuming that the two first steps of the workflow presented in Figure 4 need input data incoming from an external storage system, this service takes care of the preparation of the storage system. This layer handles the preparation of the input data by mounting the storage system if provided or by doing the data transfers. In the workflow example, the first step with two parallel components generates output files that are going to be used as input of the step B. It is also handled by the data-management service. If an output location is provided, the program automatically transfers the data to this location.
3.2.2 Host Selection
We have seen in Section 3.1 how to select the flavor that will be used for the instance creation. Now we need to find which host is the most appropriate for running the instance. Our main goal is to turn off as many hosts as possible and thus we would like to avoid turning on a new one. The idea is to find a host that has just enough free resources for our new instance. This way the hosts will be filled as much as possible before turning on a new one.
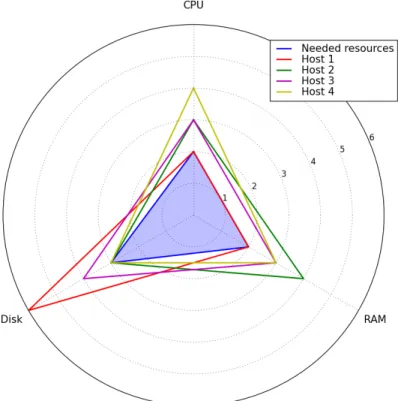
In order to properly understand the problem, we designed a 3 axes graphic as shown in Figure 7. Each step of the axes corresponds to how many resources the tiny flavor needs. Thus, one step on the CPU axis corresponds to 1 CPU, 521MB on the RAM axis and 5GB on the disk axis. The triangle filled with the blue color represents the VM we want to instantiate. The size of the
triangle corresponds to the resources the instance needs. In this case, it needs 2 × CP U , 2 × RAM and 3 × Disk. The other triangles are the available hosts. Each triangle represents the available resources on the corresponding host. For example, Host 1 represented in red color has 2 × CP U , 2 × RAM and 6 × Disk available.
Figure 7: Radar diagram for the host selection
To implement an algorithm that finds the best suitable host we need to define what we call the delta value. It corresponds to the difference between the available resources on the hosts and the needed resources by the instance. The calculation of this delta value is defined in Equations 1 − 4. If any of the delta values are negative (∆ cpu, ∆ ram or ∆ disk), it means that the current host does not have enough resources for the instance. This host can not be selected for the instance creation. If the general delta value is positive, the current host can instantiate the instance and will have remaining free resources after the creation. When the delta value is equal to zero, the host will be completely full after the creation. This case is a perfect match because all the host resources are allocated.
∆ cpu = available cpu − needed cpu (1)
∆ ram = available ram − needed ram (2)
∆ disk = available disk − needed disk (3)
∆ = ∆ cpu + ∆ ram + ∆ disk (4)
The hosts configuration presented in Figure 7 is particularly interesting. Indeed, if we create the instance on any of these 4 hosts, the delta value is always equal to 3. It means that the amount of free remaining resources after the instance creation on any of these hosts would be equal to 3. As for instance, the host 3 has 3 available CPUs, 3 available RAMs and 4 available Disks. Compared to the blue triangle, there is a difference of 1 step for each axis, so a total of 3.
In this specific case, which host is the best suitable? To answer this question we defined what we call the number of delta to zero value. This value is the number of axis that has its delta value equal to zero. The pseudo-code to calculate this value is presented in Algorithm 1. For the host 1, ∆ cpu and ∆ ram are equal to zero, thus the number of delta to zero is 2. A host that has only one axis filled like the host 2 and the host 4 (∆ disk) would not be the best choice because it makes the creation of another instance impossible and the remaining free resources are more important. Host 1 is the choice where the host is the most filled. This is why we choose to select the host that has the most number of delta to zero.
Algorithm 1 Calculation of number of delta to zero function calculate nb ∆ to zero(host)
nb ∆ to zero ← 0 for all axis in host do
if ∆ axis = 0 then nb ∆ to zero ← nb ∆ to zero + 1 end if end for return nb ∆ to zero end function
Algorithm 2 presents the pseudo-code function searching for the best suitable host. If the algorithm does not find any suitable hosts, it tries to find a host in the list of hosts that are turned off. In this list, the algorithm takes the first host that has enough resources for the instance to create. The selected host is then turned on in order to create the instance on this one. If many hosts are found as suitable for the given flavor, the algorithm calculates the delta value of each host and execute the function introduced in Algorithm 1. Next it selects the host with the lowest delta value and the highest number of delta to zero. This host is then returned and the instance will be created on it.
Algorithm 2 Search the best suitable host for the flavor in parameter function find best suitable host(flavor)
turned on hosts ← get all turned on hosts()
possible hosts ← remove hosts without enough resources(turned on hosts)
if possible hosts is empty then . Search a suitable host in the list of turned off hosts turned off hosts ← get all turned off hosts()
host to turn on ← find first host with enough resources(turned off hosts) if host to turn on is empty then
return None . Error: not enough resource in the Cloud
else
turn on(host to turn on) return host to turn on end if
else . Select best suitable host in the list of possible hosts
for all host in possible hosts do for all axis in host do
delta ← calculate ∆(axis, flavor ) save ∆(host, delta)
end for
nb delta to zero ← calculate nb ∆ to zero(host) save nb ∆ to zero(host, nb delta to zero)
end for
best hosts ← get hosts with min ∆(possible hosts)
host to return ← get host with max nb ∆ to zero(best hosts) return host to return
end if end function
3.2.3 Hosts Power Optimization
So far the benefits in energy is only seen from the user point of view thanks to the knob that controls the execution mode. The selected execution mode has an impact on the flavor selection and thus in the host selection. The Cloud can benefit from this consolidation to do energy optimization.
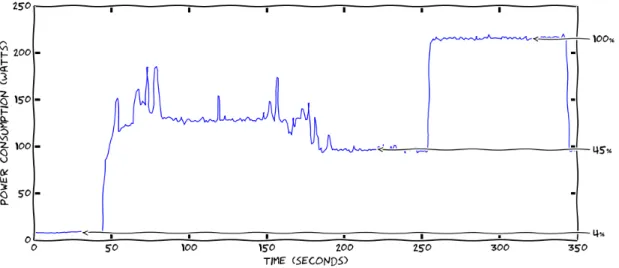
Figure 8 presents the power consumption of a host in different states. At the beginning the host is turned off and starts turning on at time 40. When turned on at time 190, there is an idle stage where the host is not used and finally the power consumption when all CPUs are used at 100%. A fully-loaded host is considered as used at 100%. By comparing the power consumption when fully-loaded with the other stages, we realize that the idle stage is 45% of the maximum power consumption. This energy is consumed while the host does nothing. A turned off host is only 4% of the maximum power consumption. Thus we want to avoid as much as possible the idle state and turn off the hosts when it is possible.
The host selection allows to avoid turning on a new host but does not provide a solution to turn off idle hosts. An algorithm responding to this problem has been designed. Each time a
host selection is made and each time a workflow step terminates, a routine goes through all hosts to check the amount of resources currently used on each of them. If there exists hosts with no resources currently used, it means these hosts are empty. All hosts detected as empty are then turned off.
Figure 8: Power consumption stages of a host turned off, turning on, in idle state and fully-loaded
In this section we presented our solution which is to give the user a way to run her workflow on smaller VMs. Using small VMs allows a better consolidation in the Cloud and also avoids to turn on many hosts. Our bet is that fewer turned on hosts implies a lower general power consumption. In the next section we talk about the implementation of our solution.
4
System Implementation
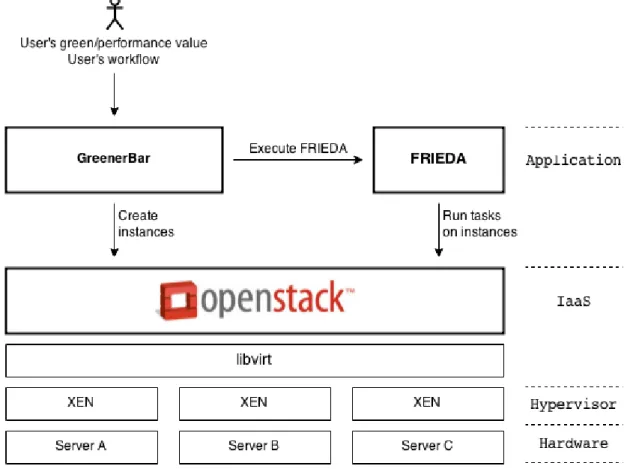
Figure 9 presents the tools we used for the implementation of the system architecture introduced in the Figure 6. For the IaaS layer, we selected OpenStack because it is an open-source tool well documented that responds to our needs. It is presented in detail in Section 4.1.1. For time saving we chose Xen for the hypervisor layer because it is the one that was already used by the OpenStack installation script. We selected FRIEDA [17] as the data-management application because it has all the features we need for this task. This tool is developed in California, at the Lawrence Berkeley National Laboratory, by a team affiliated with the Myriads team. This link between the teams, in addition that FRIEDA suits our needs, motivated the choice to use it. This tool is presented in Section 4.1.2. Finally, in the Application layer, the GreenerBar program is the core of our system. It is the user entry point and also where the workflow scheduling is made in an energy efficient way. The whole source code has been written in this application and is detailed in Section 4.2.
4.1 Tools
4.1.1 OpenStack
OpenStack is the Cloud computing platform solution used for the IaaS layer. This tool is free to use and open-source. OpenStack has a modular architecture with various code names for its components. There is the compute component, named Nova, which is the main part of the IaaS system. It handles the Cloud computing fabric controller, supporting a wide variety of virtualization technologies, including the one we use, Xen. Horizon is the dashboard component. It provides to the users a graphical Web interface to access, provision, and automate cloud-based resources. The image component, called Glance, provides a delivery service for disk images. A disk image contains the Operating System to install on a newly created instance. Glance has a list of predefined images and can retrieve on-demand a link pointing to a specific image we want to install on an instance. The telemetry component, Ceilometer, allows the access to a panel of counters like the amount of CPU used each second by each instance. It is usually used as a billing system but in our case it has been used to present the result of the experiments.
4.1.2 FRIEDA
FRIEDA manages data transfers from and to the Cloud and automatically configures the execution to use the storage system and the given VMs. A full presentation of the tool is given in Section 2.3.2. FRIEDA can run over different Cloud systems like Amazon EC2, Eucalyptus and OpenStack. Thanks to the OpenStack compatibility, we were able to use FRIEDA as an handler of the workflow execution. At each step of the workflow, a command is sent to FRIEDA with the ids of the VM instances to use, an action to execute and the location of the input files. The action will be executed on the given instances, all running in parallel and each with a portion of the total input files. The action to execute with the input files location and some other parameters are grouped in a YAML file. This execution definition file contains:
• the path to the script to execute
• the command line to execute the script • the path to the input files
• the type of the input files
• the path where to upload the output files (optional)
• the type of the output files (optional) • the execution mode to use
• the data partition to use
frieda all -c conf.yaml -i master inst id,worker1 inst id,worker2...
The above command executes the step defined in conf.yaml over the worker instances given in parameters. An example of this file is presented in Appendix A. It needs at least 2 instance ids: one master and one worker. The master instance schedules the execution and dispatches the load over the available workers. As many workers as we want can be passed in parameters. For example, if there are 4 input files and 2 workers, the master will command each worker to execute their script on 2 files. These worker instances run in parallel.
4.1.3 Python packages
In this project several existing Python libraries have been used. The three most important ones are the following ones:
logging and coloredlogs offer a colored logging service. It allows to inform the user about the execution status with this kind of line of code: logger.error("VERSION is not set").
python-novaclient is a library made by the OpenStack community that communicates with the API of the Nova component. It allows to use Python code to execute actions on the Cloud infrastructure. For example, it can control the hosts manager, the flavors manager, the images manager and so on.
python-ceilometerclient is another library made by the OpenStack community that communi-cates with the API of the Ceilometer component. In this project it is used to fetch the cpu usage of each instance.
4.1.4 Callback mechanism using Netcat
After an instance creation, a post-installation script is executed on the instance in order to prepare the tools needed by the workflow. Thus, an instance is only ready when this script has terminated its routine. A step of a workflow can only start its execution when all of its VMs are ready. A callback system that informs the GreenerBar application when each instance is ready needed to be implemented. The well-known netcat tool is used for this purpose. At the end of each post-installation script the command hostname | netcat $CONTROLLER IP 4242 sends the hostname of the current host to the GreenerBar application to inform that the instance is ready. On the other side, a Python socket is waiting for a response from all instances. When a response has been received from all instances, the execution of the step of the workflow can start.
4.1.5 Power Management Simulation of the Hosts
Turning on and off a host is not a feature natively included in OpenStack. The tool named Kwapi [6] handles this feature. It is developed in Lyon mainly by Fran¸cois Rossigneux. Kwapi can be added to OpenStack but its addition is complex. According to the time of the internship it was not conceivable to spend too much time on its inclusion. We chose another solution which is to simulate the extinction of the hosts. The simulation system uses variables that define the state of each host. In addition to the state of the hosts, it also saves the dates of each power on and power
off of the hosts. When turning on a host, a timer waits for a specific amount of time corresponding to the time that it takes for a real host to turn on.
4.1.6 Mutual Exclusion for Synchronization
The power management simulation system raised a synchronization problem. Indeed, the applica-tion management service uses many threads and all threads access the variables for the hosts power management simulation. Because they were reading and writing on these variables at the same time, we faced unexpected behaviors. To get rid of this problem, we integrated a mutual exclusion system using the Python method threading.Lock(). When the variables are used by a thread, this method forces the other threads to wait for their access until the first thread stop writing or reading on these variables.
4.2 Software Design
Now we will describe the implementation of the GreenerBar which has been done in Python.
4.2.1 Project Architecture
The UML diagram in Figure 10 presents the architecture of the project. The main.py file is the program entry point. This is where the user specifies the execution modes and the YAML files containing the workflow descriptions. The Workflow class handles each workflow configuration and execution. Each Workflow object is executed in parallel by the Main class. These two classes use a panel of classes located in the managers package.
The JobManager class is where the workflow description is saved. Each step of the workflow is saved into a Job object. This object contains the amount of needed CPU, RAM and disk but also the execution information such as the script to execute, the instances to use, the input files and the output directory.
The classes ClientManager, HostManager, ImageManager, FlavorManager, InstanceManager, KeypairsManager,AvailabilityZonesManager, AggregatesManager and SecurityGroupsManager are just abstraction of what offers the python-novaclient package. It uses the API of the Open-Stack Nova component by sending REST requests: GET, PUT, POST and DELETE. If we take the FlavorManager class as an example, it can retrieve the list of flavors or a specific one, create a new flavor and delete an existing one. Thanks to all the available API requests over all OpenStack components, the implementation of the methods which flavor for job in FlavorManager and which host for flavor in HostManager has been possible. The first method handles the flavor selection depending on the needed resources for the current job and the chosen execution mode. The second method does the host selection depending on the selected flavor.
At an instance creation, a post-installation script can be passed a parameter. This bash script is executed on the newly created instance just after its instantiation. The PostInstallScriptsManager class manages all the available post-installation scripts.
The CeilometerManager class is an abstraction of the python-ceilometerclient package. Using the API of the Ceilometer component, it retrieves the CPU usage per second of any existing or already terminated instances.
Figure 10: UML diagram
The power consumption in Watt of each node of the OpenStack deployment is given by the PowerManager class. It contacts the Kwapi web service of the hardware provider. Kwapi is a framework designed for acquiring energy consumption metrics. It allows to get the Watt per second consumption on each provided node.
The LogsManager class converts the CPU usage data given by CeilometerManager and the power consumption data given by PowerManager into log files. This file contains the results of the experimentations and are used for graph generations.
4.2.2 Execution Scheduling
Figure 11 shows the execution routine of the system we implemented. For simplicity sake, the diagram has been simplified but all the main steps have been kept.
When the program starts, it asks the user to give the path to the workflow description file and then the execution mode. The file is written in YAML and describes step by step the workflow that will be executed. An example of this file is available in Appendix B. The possible values of the execution modes are −1, 0 and +1 respectively for energy efficient, normal and performance run. Then the user is asked to add a new workflow or start the execution. Thus she is able to add as many workflow as she wants.
For each workflow that has been configured previously a thread is created. It allows the execu-tion of all workflows in parallel. For now we will consider that the user gave only one workflow at the beginning. It simplifies the diagram and no important information is lost because the execution steps are the same for each workflow.
When the workflow and the execution mode have been received, the program commands the creation of the master instance which will be used by FRIEDA. Then it selects the best suitable flavor for the first job of the workflow according to the chosen execution mode. Depending on if the first job is a single task or if it has many tasks to run in parallel, the program creates as many instances as there are tasks (nb instances variable in the workflow description file). These instances are called the worker instances. The hosts selection for the instances creation follows the rules defined in Section 3.2.2.
While creating the instances, the program runs in parallel the creation of the YAML file needed by FRIEDA. The created file is based on the content of the description file given at the beginning. Then the program waits for the instances to be ready. It uses the callback mechanism presented in Section 4.1.4.
When all instances are ready, the run of FRIEDA starts. The command takes in parameters the YAML file previously created, the master instance id and the id of all worker instances. FRIEDA automatically load balance the job execution over all the workers.
Just after the termination of the execution of the first job, the program prepares the instances for the second job of the workflow. It is important to notice that the instances of the first job are still alive at this step. The reason is because the post-installation of the second job needs to send (through scp) the output files from the instance of the first job. When the file transfers are terminated, the cleaning routine is executed. Firstly, it saves the CPU utilization data of each instance of the first job by calling the CeilometerManager object. Secondly, it deletes the instances that are not used anymore. Finally, it checks each physical host to see if it exists any host emptied of VMs. If it appears to have unused running hosts, they are turned off.
The system is now ready to start the execution of the second job of the workflow. These first steps are repeated until the last job of the workflow.
At the end of the workflow execution, the master instance used by FRIEDA is deleted and the unused hosts are turned off. Next, the program calls the PowerManager to get the power consumption data. Finally, the log files are generated. There is a log file containing the CPU utilization of each instance that happened during the workflow execution and a log file for the power consumption in watt per second for each physical host. These files have been used for the graphical exploitation of the experimentations.
5
Experimentations
We want to evaluate the impact of the execution mode, energy-efficient, normal or performance, on the general power consumption and the execution time of the application. The goal of this experimentation is to quantify the gain or loss in energy consumption and execution time in energy-efficient mode and in performance mode compared to a normal execution. The experimentation presented here is a preliminary work because of time constraints. The experiment has been run only once and could be improved as shown in the Section 6.3.2. Better results should be available for the oral presentation.
5.1 Experimental Platform
To perform the experiments, we deployed OpenStack in a platform important enough in resources to run the Cloud architecture and also the instances for the experimentations. In order to have data that shows the energy consumption improvement, it was important for us to have access to fine-grained Watt-meters.
The platform we chose to use is Grid’5000. This is a French platform for experimenting dis-tributed systems [5]. The testbed has about 1000 nodes all equipped with a 10GB Internet connec-tion, representing a total of 8000 cores. The nodes are distributed in different clusters spread over 10 sites in France and Luxembourg. We selected the Taurus cluster in the Lyon site. This cluster has a total of 16 nodes equipped with fine-grained Watt-meters updated every second. Each node of the Taurus cluster has 12 cores, 32GB of memory and 598GB of disk space.
On Grid’5000 we make reservations for a specific number of nodes for a specific amount of time. When the reservation is done, the provided nodes are emptied. Thus we need to install an Operating System on each node and then our Cloud system. When the reservation deadline comes, all provided nodes are cleaned of everything that was installed on them. Because it is not possible to keep the reservation for an infinite amount of time, the reservation and the installations had to be done everyday.
The deployment of OpenStack on Grid’5000 consists in installing and configuring all the Open-Stack components over many nodes. The task is complex and takes time, thus we needed to automate it. The Capistrano tool [3] is a Ruby program that simplifies the deployment of one or many applications over one or many servers at once. Capistrano supports Puppet [9] which is a configuration management tool. By giving the correct Puppet recipe, it allowed me to deploy OpenStack and also my other tools in about half an hour. The base of the deployment script was already ready to use, written by Matthieu Simonin. I gave him a couple of contributions during the internship in order to improve the VLAN support and ease the configuration [Appendix C].
5.2 Power On Simulation on the Hosts
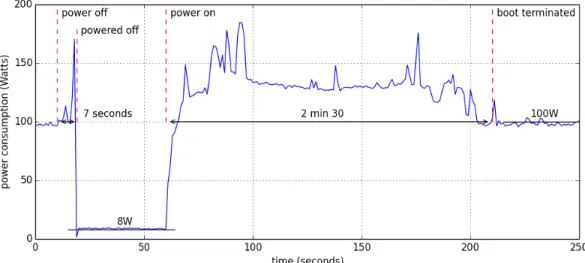
As explained in Section 4.1.5, we simulate the switching on and off of the hosts. In order to have real graphs of the power consumption of each host, we needed to integrate into the graphs the real power consumption values of a booting host. Grid’5000 provides a website to get power consumption values of a specific host. We selected a host of the Taurus cluster to do this preliminary experiment. Figure 12 shows the power consumption of a node in the Taurus cluster. At time 60
the power on command is sent. It takes 2 minutes and 30 seconds to turn on and consumes on average 130W. At time 10 the power off command is sent. It takes 7 seconds to turn off and thus the electrical consumption is insignificant. Due to the low impact of a switching off host on the power consumption, we decided to only keep the values of the power on of a host. These values are injected into the graph when a host is supposed to turn on. The injected values of a swithcing on host can be seen in Figure 16 at time 270. We also integrated the power consumption value of a turned off host. This value is not zero because of the consumption remaining on the power supply of the cluster. In the Taurus cluster, this value is 8W on average. In the graphs, each host that is turned off has its power consumption value forced to 8W.
Figure 12: Power consumption during power on and off of a Taurus node
5.3 Montage Workflow
Figure 13: Montage workflow
Our contribution focuses on data-intensive workflows. This is why we chose the Montage workflow [7] for the evaluation. It is a well-known data-intensive scientific workflow that takes space coordinates and a size as input parameters and generates an image of this space area. It uses the coordinates and the size to ask a server hosting spatial images to send the ones that match with the space area defined in parameters. The size is expressed in terms of degrees. It is an angular measurement where 1 degree represents 1/360 of a circle. The greater the angle, the
greater the number of images to download from the server. The workflow input size according to the degree value is presented in Table 1.
The Montage workflow is generally executed in a single run on one instance. Because we have access to all the commands of the Montage
![Figure 1: System architecture of the system presented in the paper [25]](https://thumb-eu.123doks.com/thumbv2/123doknet/14425265.706806/13.918.151.737.171.367/figure-architecture-presented-paper.webp)