HAL Id: tel-01264528
https://tel.archives-ouvertes.fr/tel-01264528
Submitted on 29 Jan 2016
HAL is a multi-disciplinary open access archive for the deposit and dissemination of sci-entific research documents, whether they are pub-lished or not. The documents may come from teaching and research institutions in France or abroad, or from public or private research centers.
L’archive ouverte pluridisciplinaire HAL, est destinée au dépôt et à la diffusion de documents scientifiques de niveau recherche, publiés ou non, émanant des établissements d’enseignement et de recherche français ou étrangers, des laboratoires publics ou privés.
Lung Cancer Risk : a Multidimensional Analysis in the
ICARE Study
Francesca Mattei
To cite this version:
Francesca Mattei. Role of Occupational Exposure to Organic Solvents in Lung Cancer Risk : a Multidimensional Analysis in the ICARE Study. Santé publique et épidémiologie. Université Paris Saclay (COmUE), 2015. English. �NNT : 2015SACLS061�. �tel-01264528�
NNT : 2015SACLS061
T
HESE DE DOCTORAT
DE
L’U
NIVERSITE
P
ARIS
-S
ACLAY
PREPAREE A
L
’U
NIVERSITE
P
ARIS
-
SUD
EDSP Santé publique
E
COLED
OCTORALE N° 570
Santé publique - épidémiologie
ParMadame Francesca Mattei
Role of occupational exposure to organic solvents in lung cancer risk:
A multidimensional analysis in the ICARE Study
Thèse présentée et soutenue à Villejuif, le 02 novembre 2015:
Composition du Jury :Madame Meyer Laurence PU-PH, Faculté de médecine Paris Sud X Président
Madame CordierSylvaine DRE, INSERM U1085 Rapporteur
Monsieur Chadeau-Hyam Marc Lecturer, Imperial College of London Rapporteur
Monsieur Elbaz Alexis DR2, INSERM U1018 Examinateur
Madame Leffondré Karen MCU, INSERM U897 Examinateur
5 Context: The principal risk factor for lung cancer is by far tobacco smoke, however occupational exposures deserve a special interest because they are the 2nd main etiology of this cancer. Little information is currently available on the relationship between lung cancer risk and occupational exposure to solvents that are widely used in several industries. Certain jobs such as painters, who are particularly exposed to solvents, are known to be at increased risk of lung cancer, but the causative agent is still unknown or unproven.
Objectives: The aim of the present work was the evaluation of the role of occupational exposure to different organic solvents on lung cancer risk. Initially we studied the effect of occupational exposure to chlorinated solvents; then the analysis integrated exposure to two other solvent families, namely fuels and petroleum solvents and oxygenated solvents, always taking into account the main risk factors for lung cancer, including cigarette smoking and occupational exposure to asbestos.
Population and methods: This work was based on a large population-based case-control study, ICARE. Detailed data on the lifelong occupation was collected. A total of 2,926 cases of lung cancer (2,276 men and 650 women) and 3,555 controls (2,780 men and 775 women) were included. Exposure to solvents was assessed by job exposure matrices, developed separately for each substance by industrial hygienists. In addition, exposure to certain solvents was directly reported by subjects in the questionnaire. First we followed a classical statistical regression analysis approach to investigate the role of chlorinated solvents. In the analysis that included three families of solvents, we followed a multidimensional complex methodological approach. Bayesian profile regression method enabled us to overcome traditional analysis limits due to high multicollinearity between solvents.
Results and conclusions: The analysis focused on chlorinated solvents suggested an association between lung cancer and occupational exposure to perchloroethylene (PCE), especially in women. While, no association with lung cancer risk could be demonstrated in the second analysis, incorporating the three families of solvents (chlorinated, petroleum and oxygenated). However, as we had increased the specificity of exposure definition, PCE was not included in the studied solvents anymore, preventing us from confirming or denying the association suggested above. Although solvents were not associated with lung cancer, we identified two groups of subjects whose risk of lung cancer was higher than the average. In particular, one of these groups included a high concentration of painters, however our analysis does not advocate the role of solvents to explain this excess. Despite the lack of association between solvent exposure and risk of lung cancer, the Bayesian approach allowed us to analyze the effect of joint exposure to a relatively large number of substances, which is a fairly common situation in occupational exposures. Thanks to this innovative method, our intention is now to look at the role of joint exposure to substances recognized as carcinogenic for the lung such as asbestos, silica dust and diesel engine exhaust, that are frequently found for instance in construction industry.
6 Contexte: Bien que le tabagisme soit de loin le facteur de risque majeur de cancer de poumon, les expositions professionnelles, qui représentent la 2eme étiologie majeure de ces cancers, méritent un intérêt particulier. Peu d’information existe actuellement sur le risque de cancer du poumon associé aux expositions professionnelles aux solvants. Ces substances sont largement utilisées dans différentes industries et certaines professions comme les peintres par exemple, particulièrement exposés aux solvants, sont reconnues à risque de cancer du poumon, sans identification de l’agent cancérogène en cause.
Objectifs : L’objectif de mon travail de thèse est l’évaluation du rôle de l’exposition à différents solvants organiques (groupés en solvants chlorés, carburants et solvants pétroliers, solvants oxygénés) sur le risque du cancer du poumon. Dans un premier temps nous avons étudié l’effet de l’exposition professionnelle aux solvants chlorés; ensuite l’analyse a intégré l’exposition aux deux autres familles de solvants, toujours en tenant en compte des principaux facteurs de risque de cancer du poumon, y compris le tabac et l’exposition professionnelle à l’amiante.
Population et méthode: Ce travail est basé sur les données d’une large étude de type cas-témoins en population générale, ICARE. Des données détaillées sur l’activité professionnelle vie entière ont été recueillis. Au total, 2,926 cas de cancer de poumon (2,276 hommes et 650 femmes) et 3,555 témoins (2,780 hommes et 775 femmes) ont été inclus. L’exposition aux solvants a été évaluée par des matrices emplois-expositions, élaborés séparément par chaque substance par des hygiénistes industriels. En outre, l’exposition à certains solvants était directement déclarée par les sujets dans le questionnaire. Nous avons d’abord suivi une approche d’analyse statistique classique par régression afin d’étudier le rôle des solvants chlorés. Lors de l’analyse qui intégrait les trois familles des solvants, nous avons suivi une approche méthodologique complexe multidimensionnelle. La méthode bayésienne profil regression nous a permis de contourner les limites de l’analyse classique, dues à la forte multicollinéarité qui existe entre les solvants.
Résultats et conclusions: L’analyse focalisée sur les solvants chlorés a suggéré une association entre le cancer du poumon et l’exposition professionnelle au perchloroethylene (PCE), en particulier chez les femmes. En revanche, aucune association avec le risque de cancer du poumon n’a pu être mise en évidence par la seconde analyse intégrant les trois familles de solvants (chlorés, pétroliers et oxygénés). Cependant, parce que nous avons augmenté la spécificité de la définition de l’exposition le PCE n’était pas inclus dans les solvants étudiés, nous empêchant de confirmer ou infirmer l’association mise en évidence précédemment. Bien que les solvants ne soient pas associés au cancer du poumon, nous avons identifié deux groupes de sujets avec un risque de cancer du poumon supérieur à la moyenne. L’un de ces groupes incluait notamment une forte concentration de peintres. Notre analyse ne plaide pas en faveur du rôle des solvants pour expliquer cet excès. Malgré l’absence d’association entre l’exposition aux solvants et le risque de cancer du poumon l’approche Bayésienne utilisée nous a permis d’analyser l’exposition conjointe à un nombre relativement important de substances, ce qui est une situation assez courante en matière d’expositions professionnelles. Notre souhait est maintenant grâce à cette nouvelle méthodologie de nous pencher sur l’étude du rôle des expositions conjointes de substances reconnues cancérigènes pour le poumon comme l’amiante, la poussière de silice et les gaz d'échappement du moteur diesel, toutes trois retrouvés très fréquemment dans l’industrie de la construction par exemple.
7
Publications
Articles related to the thesis
Mattei F, Guida F, Matrat M, Cenée S, Cyr D, Sanchez M, Radoi L, Menvielle G, Jellouli F, Carton M, Bara S, Marrer E, Luce D, Stücker I. Exposure to chlorinated solvents and lung cancer: results of the ICARE study. Occup Environ Med. 2014 Oct; 71(10):681-9.
Mattei F, Liverani S, Guida F, Matrat M, Cenée S, Menvielle G, Sanchez M, Pilorget C, Lapôtre-Ledoux B, Luce D, Richardson S and Stücker I. A multidimensional analysis of the effect of occupational exposure to organic solvents on lung cancer risk: the ICARE study. Submitted to Occup Environ Med (July 2015).
Articles related to ICARE study
Sanikini H, Radoï L, Menvielle G, Guida F, Mattei F, Cénée S, Cyr D, Sanchez M, Velten M, Carton M, Schmaus A, Luce D, Stücker I. Coffee consumption and risk of lung cancer: the ICARE study. Eur J Epidemiol. 2015 Jan;30(1):81-5.
Presentation
Mattei F, Guida F, Sanchez M, Cenée S, Févotte J, Luce D, Stücker I. Occupational exposure to chlorinated solvents and lung cancer: results from the ICARE study. International Epidemiology in Occupational Health Conference (EPICOH 2014), 24-27 June 2014, Chicago, USA.
8
Remerciements ... 3
Abstract ... 5
Résumé ... 6
Scientific production stemming from this thesis work ... 7
Index ... 8
List of tables ... 13
List of figures ... 16
List of acronyms ... 18
BACKGROUND AND AIMS ... 21
1 Epidemiology of lung cancer ... 23
1.1 Incidence and mortality worldwide ... 23
1.2 Incidence and mortality in France ... 26
1.3 Histology ... 28
2 Non-occupational risk factors of lung cancer ... 29
2.1 Tobacco smoking ... 29
2.1.1 Active smoke ... 29
2.1.2 Secondhand smoke ... 30
2.2 Familiarity and genetic susceptibility ... 30
2.3 Previous respiratory diseases ... 32
2.4 Radon ... 32
2.5 Air pollution ... 33
2.6 Socio-professional categories... 33
2.7 Environmental exposure to asbestos ... 33
3 Occupational risk factors for lung cancer ... 35
3.1 Known or suspected risk factors ... 35
3.2 Attributable risk fraction ... 38
9
3.3.1.2 Fuels and petroleum-based solvents ... 43
3.3.1.3 Oxygenated solvents ... 45
3.3.2 Occupational exposure to organic solvents and cancer ... 47
3.3.2.1 Chlorinated solvents ... 47
3.3.2.2 Fuels and petroleum-based solvents ... 47
3.3.2.3 Oxygenated solvents ... 48
3.3.3 Occupational exposure to organic solvents and lung cancer ... 48
3.3.3.1 Chlorinated solvents ... 48
3.3.3.2 Petroleum-based solvents ... 52
3.3.3.3 Oxygenated solvents ... 54
4 Occupational cancer epidemiology ... 55
4.1 Population-based versus industry - based studies ... 55
4.2 Retrospective assessment of occupational exposure in general population 56 4.2.1 Use of jobs’ title ... 57
4.2.2 Subjects’ report in questionnaires ... 57
4.2.3 Experts evaluation ... 58
4.2.4 Job Exposure Matrices ... 60
4.2.5 Environmental measures, biomarkers of exposure ... 62
5 Thesis objectives ... 63
STUDY POPULATION AND METHODS ... 65
6 STUDY DESIGN ... 67
7 Enrollment of cases and controls ... 69
7.1 Selection of cases ... 69 7.2 Selection of controls ... 70 8 Data collection ... 72 8.1 Socio-demographic data ... 72 8.2 Smoking history ... 72 8.3 Occupational history ... 72
10
9 Jobs and activity sectors coding ... 74
10 Assessment of occupational exposure ... 76
10.1 Job Exposure Matrices ... 76
10.1.1 The MATGENE job exposure matrices ... 76
10.1.2 Job exposure matrices of chlorinated solvents ... 77
10.1.3 Job exposure matrices of carburant and petroleum-based solvents... 77
10.1.4 Job exposure matrices of oxygenated solvents ... 77
10.2 Subjects’ report in questionnaires ... 79
11 Analyses ... 80
11.1 Analyses plan ... 80
11.2 Definition of variables used in the analyses ... 81
11.2.1 Adjustment variables ... 81
11.2.2 Exposure variables... 83
11.2.2.1 Job Exposure Matrices ... 83
11.2.2.2 Self-reported exposure ... 84
11.3 Statistical methods ... 85
11.3.1 Study of the association between chlorinated solvents and lung cancer . 85 11.3.2 Study of the association between organic solvents and lung cancer ... 87
11.3.2.1 Traditional approach: Stepwise logistic regression ... 87
11.3.2.2 Bayesian approach: Profile regression ... 87
12 Statistical power of the study ... 92
RESULTS ... 93
13 Characteristics of cases and controls ... 95
13.1 Stratification variables: age and département ... 95
13.2 Education level, socio-economic status and lifelong smoking history . 95 13.3 Cancer histology ... 99
13.4 Occupational history ... 99
14 Overview of the occupational exposure to organic solvents ... 102
11
15.1.1 Observed prevalence of exposure in ICARE population ... 104
15.1.2 Risk of lung cancer associated with the exposure to single solvents .... 105
15.1.3 Exposure to combinations of solvents ... 108
15.1.3.1 Exposure to TCE exclusively ... 109
15.1.3.2 Combinations of exposure to different chlorinated solvents ... 112
15.1.4 Sensitivity analysis ... 114
15.1.5 Analyses for histological subtypes ... 115
15.2 Exposure assessment through self-reported questionnaires ... 118
15.3 Jobs potentially exposed ... 120
16 Multidimensional analysis of occupational exposure to organic solvents and lung cancer ... 123
16.1 Evaluation of correlation among substances ... 128
16.2 Traditional approach: logistic regression results ... 129
16.3 A Bayesian approach: profile regression models ... 132
16.3.1 Profile regression for exposure to solvents and asbestos ... 133
16.3.2 Profile regression for exposure to solvents, asbestos and smoking history 138 16.3.2.1 Adjustment for socio-economic status ... 145
16.3.3 Profile regression for exposure to solvents, asbestos and smoking history in never and light smokers group ... 148
16.3.3.1 Adjustment for socio-economic status ... 153
16.3.4 Clusters and jobs... 154
16.3.5 Pseudo profiles ... 155
16.4 Analysis of self-reported exposure... 157
DISCUSSIONS ... 159 17 Study population ... 161 17.1 Cases selection ... 161 17.2 Controls selection ... 163 18 Subject exposure ... 165 18.1 Data collection ... 165
12
18.3 Occupational exposure assessment ... 166
19 Confounders ... 168
19.1 Tobacco smoking ... 168
19.2 Number of job-periods held ... 169
19.3 Socio-economic status ... 169
19.4 Occupational exposure to asbestos... 174
19.5 Genetic susceptibility factors ... 174
20 Statistical power ... 175
21 Risk of lung cancer and occupational exposure to organic solvents... 176
21.1 Occupational exposure to chlorinated solvents ... 176
21.1.1 Interpretation of main results ... 176
21.1.2 Multiple tests comparison... 178
21.1.3 Comparison with published literature ... 178
21.2 Occupational exposure to organic solvents ... 180
21.2.1 Traditional approach versus Bayesian profile regression models ... 180
21.2.2 Interpretation of main results ... 181
21.2.3 Comparison of results and literature... 184
21.2.4 Strength and limits of Bayesian approach ... 185
PROSPECTS AND CONCLUSIONS ... 187
Prospects ... 189
Conclusions ... 190
REFERENCES ... 193
13
Table 1. List of occupations known to be associated with lung carcinogens (list A). ... 36
Table 2. List of occupations suspected to be associated with lung carcinogens (list B). ... 37
Table 3. Distribution of solvent use, France 2004. ... 40
Table 4. Main chlorinated solvents... 41
Table 5. Description of selected chlorinated solvents. ... 42
Table 6. Description of selected fuels and petroleum-based solvents. ... 44
Table 7. Oxygenated solvent families. ... 45
Table 8. Description of selected oxygenated solvents. ... 46
Table 9. Distribution of the active population by socio-economic status and economic activity, in whole France and in the geographical area covered by the ICARE study. ... 68
Table 10. Categories of exposure indexes for all substances of interest. ... 78
Table 11. Dimensions of exposure to asbestos and weights used to calculate CEI. ... 84
Table 12. Distribution of subjects who replied to the complete or reduced questionnaire, separately for case-control status, and for men and women... 86
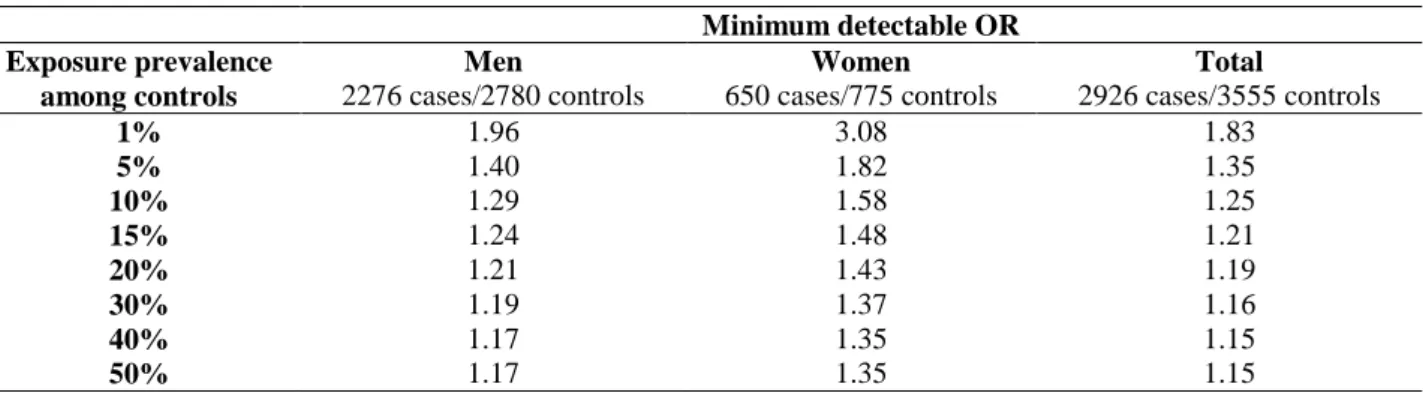
Table 13. Statistical power of the study according to exposure prevalence among controls. .. 92
Table 14. Comparison of cases and controls according to stratification variables, separately for men and women. ... 96
Table 15. Comparison of cases and controls according to education level, socio-economic status and cigarette smoking habits, separately for men and women. ... 97
Table 16. Comparison of cases and controls of cigarette smoking-related dimensions by CSI quartiles, separately for men and women (mean and standard deviation). ... 98
Table 17. Cases histology, separately for men and women. ... 99
Table 18. Comparison of cases and controls according to occupational history, separately for men and women. ... 100
Table 19. Comparison of cases and controls according to occupational history as reported in the reduced version of the questionnaire, separately for men and women (n=316)... 101
Table 20. Association between lung cancer and exposure to five chlorinated solvents, separately for men and women. ... 106
14 Table 23. Trichloroethylene cumulative exposure index for different exposure combinations, separately for men and women. ... 111 Table 24. Association between lung cancer and exposure to different combinations of chlorinated solvents, separately for men and women... 113 Table 25. Number of subjects for different lag periods according to solvent exposure, separately for men and women. ... 114 Table 26. Association between lung cancer and exposure to at least one chlorinated solvent, trichloroethylene and perchloroethylene, by histological type, men. ... 116 Table 27. Association between lung cancer and exposure to at least one chlorinated solvent, trichloroethylene and perchloroethylene, by histological type, women. ... 117 Table 28. Association between lung cancer and self-reported exposure to trichloroethylene and perchloroethylene, separately for men and women. ... 119 Table 29. Distribution of men according to the different definitions of exposure to organic solvents (n=5040). ... 124 Table 30. Distribution of women according to different definitions of exposure to organic solvents (n=1379). ... 125 Table 31. Distribution of cases and controls ever exposed to organic solvents, according to the cut-off-based definition of exposure, separately for men and women. ... 127 Table 32. Association between lung cancer and exposure to organic solvents, men. ... 130 Table 33. Association between lung cancer and exposure to organic solvents, women. ... 131 Table 34. Summary of cluster profiles obtained assuming cigarettes smoking as fixed effect, men. ... 134 Table 35. Summary of cluster profiles obtained assuming cigarettes smoking as covariate, men. ... 139 Table 36. Summary of cluster profiles obtained assuming cigarettes smoking as covariate, women. ... 143 Table 37. Comparison of cluster logORs adjusted and not adjusted for socio-economic status, men (model with cigarettes smoking as covariate). ... 146 Table 38. Comparison of cluster logORs adjusted and not adjusted for socio-economic status, women (model with cigarettes smoking as covariate). ... 147
15 Table 40. Comparison of cases and controls according to age at interview, occupational history and socio-economic status in never and light smoker, men (n=1913). ... 149 Table 41. Summary of cluster profiles obtained assuming cigarettes smoking as covariate in never and light smoker subpopulation, men. ... 151 Table 42. Comparison of clusters logORs estimates adjusted and not adjusted for socio-economic status in never and light smokers, men (model with cigarettes smoking as covariate). ... 153 Table 43. Pseudo-profiles definition. ... 155 Table 44. Association between lung cancer and self-reported exposure to selected solvents, separately for men and women. ... 158 Table 45. Distribution of controls in ICARE study and population living in the départements (2006) according to socio-economic status, separately for men and women. ... 164 Table 46. Statistical power of the study according to lifelong prevalence estimated in ICARE data among controls. ... 175
16
Figure 1. Estimated lung cancer incidence worldwide in 2012, men. ... 24
Figure 2. Estimated lung cancer mortality worldwide in 2012, men. ... 24
Figure 3. Estimated lung cancer incidence worldwide in 2012, women. ... 25
Figure 4. Estimated lung cancer mortality worldwide in 2012, women. ... 25
Figure 5. World-standardized incidence and mortality rate for 100,000 person-years in France, separately for men and women, 1980-2012. ... 26
Figure 6. World-standardized incidence rate for 100,000 person-years in French region, separately for men and women, 2008-2010. ... 27
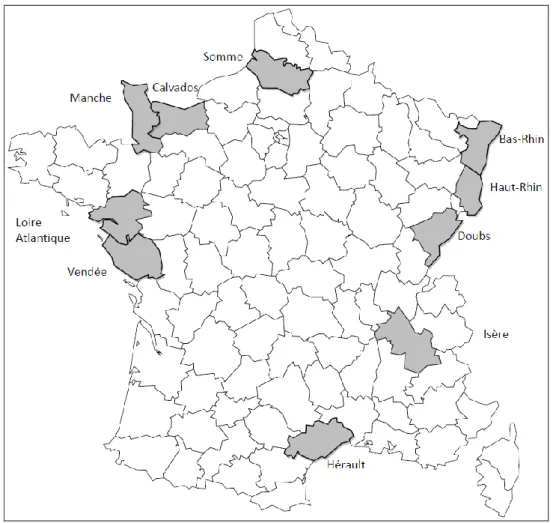
Figure 7. Geographical area covered by the ICARE study (10 départements). ... 67
Figure 8. Estimated prevalence of lifelong exposure to organic solvents among controls, separately for men and women. ... 103
Figure 9. Distribution of the most common occupations with exposure to trichloroethylene, separately for men and women. ... 121
Figure 10. Distribution of the most common occupations with exposure to perchloroethylene, separately for men and women. ... 122
Figure 11. Image plot for Spearman’s correlation coefficients calculated among selected substances’ CEI, separately for men and women. ... 128
Figure 12. Log odd ratios of clusters relative to the non-exposed cluster, men (model with cigarettes smoking as fixed effect). ... 137
Figure 13. Log odds ratios of clusters relative to the non-exposed cluster, men (model with cigarettes smoking as covariate)... 141
Figure 14. Log odds ratios of clusters relative to the non-exposed cluster, women (model with cigarettes smoking as covariate)... 144
Figure 15a. Log odds ratios of clusters relative to the non-exposed cluster, not adjusted for socio-economic status, men (model with cigarettes smoking as covariate). ... 146
Figure 15b. Log odds ratios of clusters relative to the non-exposed cluster, adjusted for socio-economic status, men (model with cigarettes smoking as covariate). ... 146
Figure 16a. Log odds ratios of clusters relative to the non-exposed cluster, not adjusted for socio-economic status, women (model with cigarettes smoking as covariate). ... 147
Figure 16b. Log odds ratios of clusters relative to the non-exposed cluster, adjusted for socio-economic status, women (model with cigarettes smoking as covariate). ... 147
17 Figure 18a. Log odds ratios of clusters relative to the non-exposed cluster, not adjusted for socio-economic status in never and light smokers, men (model with cigarettes smoking as covariate). ... 153 Figure 18b. Log odds ratios of clusters relative to the non-exposed cluster, adjusted for socio-economic status in never and light smokers, men (model with cigarettes smoking as covariate). ... 153 Figure 19. Distribution of the three most common occupations in the clusters with statistically significant log odd ratios, men. ... 154 Figure 20. Density estimates of predicted log odds ratio for different combinations of CEI of white spirits and benzene, men. ... 156 Figure 21. Practical rules to decide on whether adjustment for socio-economic status in occupational cancer studies is appropriate. ... 171
18
Alc Alcohol
AIC Akaike's information criterion
Asb Asbestos
BZ Benzene
CEI Cumulative exposure index
CF Chloroform
CI Confidence interval
CI* Credible interval
cig/day Cigarettes per day
COPD Chronic obstructive pulmonary disease
CSI Comprehensive smoking index
CT Carbon tetrachloride
DCM Methylene chloride
Et2O Diethyl ether
FRANCIM French network of cancer registries
GL Gasoline
Glycol Ethylene glycol
ICARE Investigation of occupational and environmental causes of respiratory cancers IARC International Agency for Research on Cancer
ILO International Labour Organization
INSEE French National Institute of Statistics and Economical Studies ISCO International Standard Classification of Occupation
ISIC International Standard Industrial Classification of All Economic Activities InVS French Institute for Public Health Surveillance
JEM Job exposure matrices
KDF Kerosene/diesel oil/fuel oils
KetEst Ketones/esters
LogOR Log odds ratio
MCMC Markov Chain Monte Carlo
mg/m3-y Milligram per cubic meter-years
NACE Statistical Classification of Economic Activities in the European Community
NAF French Nomenclature of Activities
OR Odds ratio
P P-value
PAM Partitioning around medoids
PCE Perchloroethylene
19
PY Person-years
Rho di Spearman
S Similarity matrix
SBPs Special petroleum products and other aliphatics
SD Standard deviation
SES Socio-economic status
T Time of interview (if controls) or of diagnosis (if cases)
TCE Trichloroethylene
TSC Time since cessation
THF Tetrahydrofuran
UADT Organs of upper-aerodigestive tract
WS White spirits and other aromatics
23
Epidemiology of lung cancer
1.1 Incidence and mortality worldwide
Cancer is a leading cause of death worldwide, with 14 million new cases per year and 8.2 million deaths in 2012 [WHO, 2014].
Lung cancer is the most frequently occurring cancer, with 1.8 million cases, 12.9% of the world’s total cancer incidence [WHO, 2014], and the most common cause of cancer death, with 1.6 million deaths, 19.4% of the world’s total [Ferlay, 2013].
In men, lung cancer is by far the most common cancer, both in terms of incidence, with more than 1.2 million of new cases in 2012 (GLOBOCAN 2012) and an estimated age-standardized incidence rate (world population) of 34.2 per 100,000 person-years (PY), and in terms of mortality, with one million of deaths. Its geographic distribution showed marked regional variation (Figure 1): it tended to be most common in developed countries, in particular in North America and in some Eastern and Central European countries, and less common in developing countries, particularly in Africa and Southern Asia.
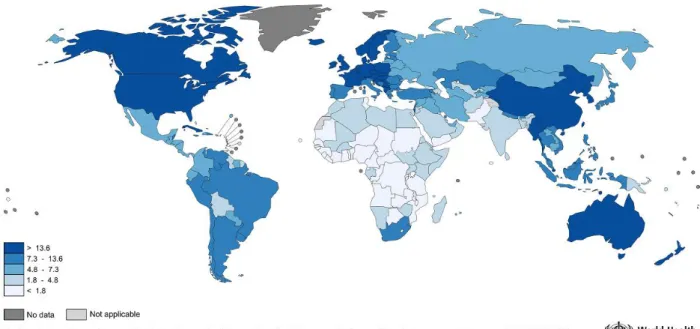
In women, more than 580,000 new cases of lung cancer were reported all over the world in 2012. With an estimated age-standardized incidence rate (world population) of 13.6 per 100,000 PY, lung cancer was the 4th most common cancer, after breast, colorectal and cervix uteri cancers, but ranked 2nd as cause of death, with around 490,000 of deaths, because of the high case fatality. The geographic pattern was somewhat different as compared to men (Figure 3), chiefly reflecting different historical patterns of tobacco smoking. Thus, the highest incidence rates were observed in North America, North West Europe (U.K., Iceland, Denmark), Australia, New Zealand and China.
Because of lung cancer high fatality and the relatively low variability in survival in different world regions, mortality geographical patterns closely follow incidence (Figure 2 and Figure 4).
24 Figure 1. Estimated lung cancer incidence worldwide in 2012, men.
Source: GLOBOCAN 2012 (IARC), Section of Cancer Surveillance (18/8/2015).
Figure 2. Estimated lung cancer mortality worldwide in 2012, men.
25 Figure 3. Estimated lung cancer incidence worldwide in 2012, women.
Source: GLOBOCAN 2012 (IARC), Section of Cancer Surveillance (18/8/2015).
Figure 4. Estimated lung cancer mortality worldwide in 2012, women.
26
1.2 Incidence and mortality in France
In France, lung cancer is the 3rd most common cancer in term of incidence for the entire population (2nd for men and 3rd for women). In 2012, the estimated age-standardized incidence rates were 52.0 per 100,000 PY for men and 20.2 per 100,000 PY for women [Ferlay, 2013].
The estimated age-standardized mortality rates were 39.9 per 100,000 PY for men and 12.9 per 100,000 PY for women, and reflected the disease severity: lung cancer was the 1st cause of cancer death for men and the 2nd for women.
In contrast to women, men lung cancer incidence has been rather stable in the last decades (Figure 5). Men average annual world-standardized incidence rate was + 0.1% in 1980 - 2012, whereas it was + 5.3% for women. This gender difference has been even stronger in 2005-2012: among women, the number of new cases increased from 7,111 to 11,284, rising around 59% with an average annual rate of + 5.4%. As regards men, on the other hand, a downward trend was observed, with 25,337 new cases in 2005 and 28,211 in 2012, a 11% growth in 7 years but a - 0.3% average annual rate [Binder-Foucard, 2013]. This difference was mainly due to divergent changes in smoking habits: tobacco consumption, the main risk factor for lung cancer, declined among men while increasing among women. Therefore, it has been estimated that women have not yet reached their peak of incidence, contrary to men.
Figure 5. World-standardized incidence and mortality rate for 100,000 person-years in France, separately for men and women, 1980-2012.
Men Women W o rl d s ta n d ar d iz ed r at es (l o g -sca le ) W o rl d s ta n d ar d iz ed r at es (l o g -sca le )
Source: Institut de veille sanitaire [Binder-Foucard, 2013].
Estimated incidence, men
Estimated mortality, men
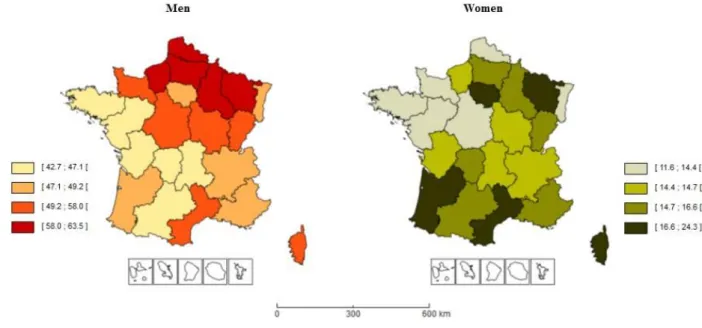
27 Lung cancer geographic distribution in France shows marked regional variation, for both men and women (Figure 6). Between 2008 and 2010, men world-standardized incidence rate ranged from 42.7 to 63.5/100,000 PY, while it was 11.6 - 24.3 for women [INCa, 2008 - 2010]. A North-South gradient was evident for men, whereas for women the highest incidence was in large urban agglomerations. In particular, men highest rates were found in Nord Pas de Calais, Lorraine, Haute Normandie, Picardie, Champagne Ardennes, while the lowest rates were in Limousin, Pays de la Loire, Midi Pyrénées. This geographical distribution could be explained with socio-economic and socio-cultural arguments: the North-East of France is characterized by the highest presence of industries, including those entailing exposures that are associated with lung cancer risk (i.e. coal and iron mines, steel industry, car manufacturing), and by a strong tobacco consumption.
For women, the regions with the highest incidence rates were Corse, Languedoc Roussillon, Ile de France and Aquitaine, and those at lowest incidence were Nord Pas de Calais, Pays de la Loire and Bretagne. Except for Corse, these differences paralleled the changes in tobacco consumption, which typically increased first in urban areas.
Figure 6. World-standardized incidence rate for 100,000 person-years in French region, separately for men and women, 2008-2010.
28
1.3 Histology
Lung cancer is the uncontrolled growth of abnormal cells in one or both lungs. It can start in the cells lining the bronchi and parts of the lung, such as bronchioles or alveoli.
There are two main lung cancer histologies, according to malignant cell size and appearance: small cell lung cancer and non-small cell lung cancer.
About 10% to 15% of all lung cancers are small cell lung cancer, named after the size of the cancer cells when seen under a microscope. This histology is characterized by rapid growth and aggressive natural course, and, the overall survival at 5 years is 5% to 10%, despite high response rates to both chemotherapy and radiotherapy [Johnson, 1990; Lassen, 1995]. The primary and most important intervention to decrease mortality is undoubtedly smoking prevention [Cuffe, 2011], as small cell lung cancer is very rare in never smokers [ACS, 2014].
About 85% to 90% of lung cancers belong to the non-small cell histology. They can be classified in three main subtypes, according to cell size and shape: squamous cell (epidermoid) carcinoma (about 25-30%), adenocarcinoma (about 40%), and large cell carcinoma (about 10-15%). They are grouped together because they share similar treatment approaches and prognosis [ACS, 2014]. General indications for treatment vary according to the stage: surgery for early stages, chemotherapy with concurrent radiation for some locally advanced cancers, and palliative chemotherapy for metastatic disease. Non-small cell lung cancer has a severe prognosis, carrying a 5-year survival rate of 15%, better than small cell lung cancer [Molina, 2008].
Lung cancer histological distribution differs by gender. According to an epidemiological study carried out in general hospitals in France in 2000 [Blanchon, 2002], squamous cell carcinoma was the most frequent histological type among men (43%), followed by adenocarcinoma (27%) and small cell lung cancer (17%). Among women, the main type was adenocarcinoma, representing the 45% of diagnosed tumors. Squamous cell carcinoma was diagnosed in 23% of cases and small cell lung cancer was in the same proportion as for men.
These gender differences are probably due to differential exposure to risk factors between men and women, at least partly. In particular, tobacco smoking increases the risk of all major histological types of lung cancer, but the histological types most related to tobacco consumption are squamous cell carcinoma and small cell lung cancer, with attributable risk not far from 90% (64% for adenocarcinoma) [Jedrychowski, 1992]. This can partially explain the higher prevalence of adenocarcinoma among women, who tend to smoke less than men (among lung cancer patients, never-smokers are 32% of women versus 2.5% of men [Blanchon, 2002]). As regards occupational
29 exposures, the hypothesis that some of them may have more specific associations with particular histologic types remains controversial [Vena, 1985; Paris, 2010]. In particular, factors such as arsenic in copper smelters [Wicks, 1981], chemicals in synthesis plants [Waxweiler, 1981], radon and silicosis [Taeger, 2006] and mineral dust [Jedrychowski, 1992] have been suspected to be more specifically associated with adenocarcinoma, although these findings were not conclusive.
The occupational exposure the most studied in this regard has been asbestos. Old studies reported associations with lung cancer histology , and some of them showed increased risk of adenocarcinoma [Hueper, 1966; Raffn, 1993; Karjalainen, 1994; Mollo, 1995; De Stefani, 2005]. Nonetheless, more recent studies have not found any relationship between asbestos exposure and adenocarcinoma [Brodkin, 1997; Lee, 1998; Mollo, 2002; Paris, 2010]. In a recent pooled analysis with more than 11,500 lung cancer cases, including the ICARE subjects, a positive association emerged with squamous cell carcinoma rather than adenocarcinoma (unpublished). These discrepancies in the literature may be explained by the decreasing level of asbestos exposure over time [Kauffer, 2007] and the increasing frequency of adenocarcinoma according to changes in smoking behavior [Thun, 2001]. As a consequence, it is difficult to establish definitely if a differential association by histology exists really.
Non-occupational risk factors of lung cancer
Carcinogenesis is a multifactorial process, where the interaction among hereditary, genetic, and environmental factors leads to uncontrolled cell growth.
Because of its physiological function, lung is particularly exposed to air, hence to several pollutants possibly present in the environment, which penetrate into the organism by inhalation.
In this section we describe in detail the main non-occupational risk factors of lung cancer, including tobacco smoking, that is by far the most important and accounts for approximately 90% and 60% of the lung cancer risk, respectively for men for women in Europe [Simonato, 2001]. However, there are also other causes, and some of them act in concert with smoking to synergistically increase the risk. Lung cancer is more affected by occupational exposure than any other cancer type, and we will devote a specific chapter to its occupational etiology.
1.4 Tobacco smoking
1.4.1 Active smoke
Tobacco has been widely used all over the world for centuries. The present lung cancer pandemic followed the introduction of manufactured cigarettes with addictive properties, which
30 resulted in a new pattern of sustained exposure of the lung to inhaled carcinogens [HHS, 1989]. Tobacco smoking contains over 2,500 different chemicals, including around 60 that have been identified as carcinogens or possibly carcinogens.
The carcinogenic effect of tobacco smoking has been demonstrated in the 1950s [IARC, 2004]. Lung cancer relative risk is about 8-15 fold for smokers compared to never-smokers among men, and 2-10 fold among women [Adami, 2002]. This risk reflects the contribution of several dimensions in smoking habit: average consumption, duration, time since cessation, age at starting smoking, type of tobacco and inhalation. According to Doll and Peto evaluations [Doll, 1978], the most important dimension that affects lung cancer risk in smokers was the duration of regular smoking, although risk also increased with the amount of cigarettes smoked. In particular, they found that a tripling of the number of cigarettes smoked per day tripled the risk, whereas a tripling of smoking duration increased the risk 100-fold. The effect of smoking cessation has been evaluated by a large number of analytical studies showing a significant lung cancer risk reduction, and the magnitude of the reduction increased with time since cessation. However, former smokers’ risk remains elevated compared with never-smokers [IARC, 2004].
1.4.2 Secondhand smoke
Secondhand tobacco smoking comprises the smoke released from the burning tip of a cigarette (or pipe or cigar) and the smoke exhaled by the smoker. It is also referred as environmental tobacco smoke, passive smoking or involuntary smoking. Since 2004, it has been classified as known human carcinogen by the International Agency for Research on Cancer (IARC) [IARC, 2004]. The U.S. Surgeon General estimated that living with a smoker increases a nonsmoker’s chance of developing lung cancer by 20 to 30 percent [HHS, 2006]. There is sufficient evidence to infer a causal relationship between secondhand smoke exposure and lung cancer among lifetime nonsmokers, regardless of location of exposure (house, workplace, or other sources) [IARC, 2012].
1.5 Familiarity and genetic susceptibility
Although lung cancer causes are almost exclusively environmental, it is likely that substantial individual variation in susceptibility to respiratory carcinogens exists. Indeed, only a small proportion of smokers (fewer than 20%) develop lung cancer [Brennan, 2006].
A recent meta-analysis showed that individuals with a first-degree relative with lung cancer had a 1.51-fold increase in risk of lung cancer compared to individuals without such a family history, after adjustment for smoking and other potential confounders [Cote, 2012]. Moreover, family history of lung cancer has been associated with lung cancer also among never smoking individuals
31 [Matakidou, 2005; Lissowska, 2010; Cote, 2012]. This suggests that factors such as genetic susceptibility may contribute to increased risk of lung cancer.
Genetic susceptibility has been studied since the early ’90, and the gene-candidate approach was followed at first. Afterwards, this approach has been criticized because of non-replication of results and limited ability to include all possible causative genes and polymorphisms. Some enzymes involved in the metabolism of tobacco smoke constituents have been investigated thoroughly. For example, the polymorphisms of CYP1A1, GSTM1 and GSTT1 genes were the object of several studies aimed at assessing if subjects carrying variant alleles had higher lung cancer risk. The cytochrome P450 enzymes (CYP) play a central role in the metabolism of many xenobiotics and endogenous compounds including food additives, industrial solvents and pollutants, sometimes converting them to reactive metabolites [Lieber, 1997]. In particular, CYP2E1 plays a role in the metabolism and bio-activation of many solvents that are present in tobacco smoke, notably benzene, styrene, vinyl chloride and trichloroethylene, but also N-dimethylnitrosamines, [Chen, 2012]. Several epidemiological studies reported the association of CYP2E1 RsaI polymorphism (the most investigated) with lung cancer risk, but a recent meta-analysis indicated a negative association among Asians, and none in Caucasians [Ye, 2015]. Research in genetic susceptibility has been developed widely over the last thirty years, but results are generally considered somehow disappointing. Till now, several genes have been found to be associated with a modest increase in the risk of cancer and no evidence emerged for gene-environment interactions, in particular for lung cancer [Vineis, 2009].
32
1.6 Previous respiratory diseases
Increased lung cancer susceptibility may result from underlying lung diseases, e.g. those that obstruct airflow, such as chronic obstructive pulmonary disease (COPD), and fibrotic disorders that restrict lung capacity, such as pneumoconiosis [Cotran RS, 1994]. Nevertheless, their association with lung cancer is a complex topic. For example, cigarette smoking is the principal cause of both COPD [HHS, 1984] and lung cancer, consequently inadequate control for smoking could result in spurious findings. However, one case-control study looked at the prevalence of COPD in newly diagnosed lung cancer patients, matched for age, sex, and smoking history with the control subjects, and it found that the prevalence of COPD in cases (50%) was six-fold greater than in the control group (8%) [Young, 2009].
In addition, the link between emphysema and lung cancer has been shown in several studies, and small associations emerged with other lung diseases, such as asthma, tuberculosis, and pneumonia [Littman, 2004; Brenner, 2011]. Furthermore, a pooled analysis conducted by the International Lung Cancer Consortium (ILCCO) on more than 100,000 subjects showed that previous lung diseases influence lung cancer risk independently of tobacco use [Brenner, 2012].
1.7 Radon
Radon is a chemically inert, naturally occurring radioactive gas, present in the environment. It is produced from the radioactive decay of uranium which is found in rocks and soil. It escapes easily into the air and tends to concentrate in enclosed spaces, such as underground mines and houses. It is present in particular in volcanic areas or in regions rich in granite and uranium (such as Massif-Central, Bretagne, Vosges and Corse).
Radon has been classified by IARC as a cause of lung cancer since 1988 [IARC, 1988], and has been indicated as the second leading cause of lung cancer, after cigarette smoking, by the U.S. Environmental Protection Agency [Pawel, 2004]. A synergistic effect between radon and smoking has also been recognized [Barros-Dios, 2002].
A pooled analysis of European studies on residential radon exposure and lung cancer resulted in a RR of1.08 (95% CI: 1.03–1.16) for a 100 Bq/m3 increase [Darby, 2005]. In France, Catelinois et al. examined the exposure-response relations derived from cohorts of miners and from joint analyses of residential case-control studies, and suggested that 2.2% to 12.4% of lung cancer deaths may be attributable to indoor radon [Catelinois, 2006].
33
1.8 Air pollution
The effect of air pollution on lung cancer risk is an important issue because large proportions of the population are concerned globally.
Air pollution consists mainly of gases (sulfur dioxide - SO2, Nitrogen dioxide - NO2, Nitrogen oxides - NOx, Ozone - O3), as well as fine particles (PM2.5), which are largely emitted by vehicles fitted with diesel engines. However, the constituent of air pollution vary by site and over time depending on the pollution sources. Consequently, problems in epidemiologic investigations of air pollution in association with lung cancer arise from the difficulty of estimating the exposure, and precise estimations of associations measures remains uncertain [IARC, 2013]. In an attempt to overcome these difficulties, a meta-analysis was conducted recently on 21 cohort studies: the risk of lung cancer resulted positively associated with long-term exposure to PM2.5 (7.23%/10 μg/m increase), NO2
(13.17%/10 parts per billion increase), NOx (0.81%/10 ppb increase) and SO2 (14.76%/10 ppb
increase), although the RR magnitude was relatively small [Yang, 2015].
In addition, several other studies, mostly conducted on cohorts, found that air pollution (transportation-related or industry-related) actually was a risk factor for lung cancer, although a minor one when compared to tobacco smoking [INSERM, 2008; Demetriou, 2012]. IARC classified outdoor air pollution as a Group 1 carcinogen [IARC, 2015].
1.9 Socio-professional categories
Several studies have reported higher lung cancerincidence and mortality in individuals with lower socio-economic status, in particular in North America and in Europe [Mao, 2001; Mackenbach, 2004]. However, socio-economic status cannot be considered as a risk factor by itself, and its role in lung cancer development is still widely debated. Other factors certainly underlie social inequalities, such as strong tobacco consumption first of all, but also high level of occupational exposures or unhealthy diet [Menvielle, 2009; Rajer, 2014].
1.10 Environmental exposure to asbestos
Several sources of exposure to asbestos for members of the general public still exist, even in the countries where it has been banned. Just to mention some of them, friable asbestos may be released from older building materials and insulation, from brake linings, during demolition of older buildings or during poorly contained asbestos removal operations. Asbestos exposure may occur simply because of living near asbestos-containing waste sites or asbestos-related industries, or using asbestos-contaminated vermiculite or talc containing asbestiform fibers. “Bystander exposure” can
34 even take place by contact with asbestos workers or their clothes. Non-occupational exposure to asbestos may explain about 20% of the mesotheliomas in industrialized countries, but it is difficult to estimate the proportion of attributable lung cancers [Goldberg, 2009].
35
Occupational risk factors for lung cancer
The principal risk factor for lung cancer is by far tobacco smoking, however also the workplace may provide an environment where the risk of carcinogenic exposure is present. Many substances are well recognized occupational carcinogens, such as asbestos, silica, nickel, chromium VI [Siemiatycki, 2004].
Inhalation is an easy route of entry into the body for many carcinogenic agents occurring in the workplace, and lung is the target organ that has been linked to occupational carcinogens most often [Doll, 1981].
In the following paragraphs, we will firstly give an overview about agents determined by the International Agency for Research on Cancer (IARC) to be definite (Group 1), probable (Group 2A) or possible (Group 2B) lung carcinogens, and the corresponding weight in cancer developing, estimated through the attributable risk fraction, reported in literature. A description of occupational risk factors of interest for our study is provided.
Secondly, we will describe organic solvents, grouped into three main categories: chlorinated solvents; fuels and petroleum-based solvents; oxygenated solvents.
1.11 Known or suspected risk factors
Among the agents classified by the IARC as human carcinogens in Group 1, Group 2A and Group 2B, 45 are associated with increased lung cancer risk. Some of them are specific substances, while others represent groups with an excess of risk whose causative agent is still unknown or unproven. The most important occupational risk factors for lung cancer are asbestos, diesel engine exhaust, and several metals, i.e. chromium, nickel, beryllium, cadmium, arsenic and crystalline silica dust. An increased risk of lung cancer in association with occupational exposure to radon and its progeny among underground miners is also well established [BEIR, 1999].
In the early 1980s, two lists of industrial activities and occupations known (list A, Table 1) or suspected (list B, Table 2) to be associated with lung carcinogens were developed [Simonato, 1983] and repeatedly updated [Boffetta, 1995; Ahrens, 1998; Mirabelli, 2001; Consonni, 2010], in order to easily take into account the burden of occupational exposures in lung cancer studies. The starting point was the IARC evaluation of carcinogenic risks. These lists are easy to apply because it is only needed the knowledge of the lifelong occupational history of the subjects, an information which is regularly collected in epidemiological studies and can be considered as reliable. The lists have been translated into international codes of jobs and activity sectors (International Standard Classification of Occupations, ISCO, and International Standard Industrial Classification of All Economic
36 Activities, ISIC) [Ahrens, 1998]. To facilitate the comparability with our data, ISIC codes have been recoded into French Nomenclature of Activities codes (NAF) [Guida, 2012].
Table 1. List of occupations known to be associated with lung carcinogens (list A).
Industry Job / Process NAF 2000 ISCO 1968
Agriculture Vineyard workers using arsenical
insecticides (before 1970)
011*, 012*, 013* 623.30
Mining and quarrying Arsenic/uranium/iron ore/asbestos/
granite mining, talc mining/milling 103*, 12*, 13*, 141*, 142*, 143*, 145* 038.10/90, 700.20, 711** (excluding 71140), 712.20/30/40/50/60/90, 973.45 Ceramic and refractory brick Ceramic and pottery workers 262*, 263*, 264*
or any industry
blue-collar or 892**, 893.50/60/90,
899.30/40/50/60 Asbestos production Insulated material production 172J,175E, 175G,
247Z, 265*, 266*, 267*, 268* or any industry 741.90, 751**, 752** 754.15/20/25/70/,75/90, 755** 756.70 or 943.30
Granite production Cutting, polishing etc, of granite stones 172J, 175E, 175G, 247Z, 265*, 266*, 267*, 268* 820.20/30/40/50/90 Metals
(iron and steel basic industries)
Iron and steel founding 271**, 272**, 273**, 275A, 275C
724**, 725**
Metals
(nonferrous, basic industries: smelting, alloying, refining, rolling, drawing, costing) Copper/zinc/cadmium/aluminum/ nickel/ chromate/beryllium 274, 275E, 275G, 281*, 282*, 283*, 284*, 285A or any industry blue-collar worker or 72440/ 50/90
Any industry Pickling operations - 729.40
Any industry Chromium plating - 728**,729.40
Any industry Electroplating (cadmium) - 728.20/90, 729.40
Any industry Brazing - 872.45
Shipbuilding, motor vehicle, railroad equipment
manufacturing
Shipyard/dockyard, motor vehicle, railroad manufacture workers
351**, 352** or any industry
blue-collar worker or 841.25/30, 871.30
Gas Coke plant and gas production
workers
231*, 232*, 1G,402* or any industry
74**, (excluding 745**) or 7492**
Construction Insulators and pipe coverers - 956**
Roofers - 953.20/30/40/90
Asphalt workers - 953.40,974.50/60
Other Painters (construction) - 931**
Painters (automotive industry, and
other users) - 939**
ISCO, International Standard Classification of Occupations; NAF, French Nomenclature of Activities. * All 4-digit codes within that code were considered.
37 Table 2. List of occupations suspected to be associated with lung carcinogens (list B).
Industry Job / Process NAF 2000 ISCO 1968
Food industry Butcher and meat worker 151*, 152*
or any industry
blue-collar or 45130 or 773**
Leather Tanner and processors 191* or any industry blue-collar or 761**
Wood and wood products Carpenters, joiners Any industry 81**, 954**
Printing Rotogravure/machine-room
workers, printing pressmen, binders, and other jobs
221*, 222* 921.10, 922**,
926.30/50
Rubber Various occupations in rubber
manufacture 241N, 251* or any industry blue-collar or 9012**, 9013**, 901.40, 901.90, 902** Glass workers Glass workers (art glass, container
and pressed ware)
261* or any industry blue-collar or 891**, 893.20/30/40, 894.40, 899.20/70/90 Motor vehicle
manufacturing and repair
Machine-tool operators 34*, 502*, 504* 831**, 832.20/30, 833**,
834**, 839.60
Mechanics 34*, 502*, 504* or 34* 843** or 849.85
Welders and flame-cutters 34*, 502*, 504* 872** not 872.45
Transport Railroad workers - 983**, 984.40
Bus and truck drivers - 985.40 to 985.60
Operator of excavating machines - 974.20 to 974.45, 974.55,
974.70, 974.90
Other Launderers, dry-cleaners and
pressers
-
560**
ISCO, International Standard Classification of Occupations; NAF, French Nomenclature of Activities. * All 4-digit codes within that code were considered.
38
1.12 Attributable risk fraction
In 1980s, Doll estimated that 10-15% of lung cancer cases among men and 5% among women were of occupational etiology in USA [Doll, 1981]. Imbernon reported an attributable fraction to occupational exposures varying from 13% and 30% for men, in industrialized countries [Imbernon, 2003]. In 2004, the burden of lung cancer due to past occupational exposure in UK was estimated to be 16.5% among men and 4.5% among women, for established carcinogens (Group 1 in IARC classification); and 21.6% and 5.5% respectively for carcinogens of IARC groups 1, 2A and 2B together [Rushton, 2008]. In France, Boffetta et al. estimated that 12.5% of men lung cancer cases could be attributed to known occupational risk factors, and the estimate among women was around 6.5% [Boffetta, 2010].
It is important to consider that, by definition, attributable fractions are calculated on acknowledged occupational risk factors only. This probably leads to underestimate the role of occupational exposure in lung cancer development. This underestimation concerns especially women, whose overall attributable fractions are lower than men’s. Typically, women are not much affected by the occupational exposures that are known to be lung carcinogens. In addition, very few studies have been carried out yet with the aim of investigating occupational exposures at risk of lung cancer in women-dominated jobs or activity sectors.
In conclusion, although an important part of lung cancer cases is certainly due to occupational exposures, the exact proportion is difficult to estimate because the attributable risk fractions in literature vary greatly in time and space: ranges from 0 to 40% have been shown in 32 studies conducted within the last 30 years [De Matteis, 2008]. In addition, given the multifactorial etiology of lung cancer, synergistic interactions among risk factors may have substantial consequences for lung cancer risk. As a consequence, an interesting question could be the relative contribution of these factors to the overall burden of lung cancer.
39
1.13 Organic solvents
1.13.1 Chemistry and exposure conditions
A solvent can be defined as a substance that dissolves another substance. The dissolving ability depends on chemical groups that make up the solvent molecule. These groups can impart hydrophilic (i.e. capable of dissolving in water) or lipophilic (i.e. capable of dissolving in lipids) or amphiphilic (i.e. capable of dissolving in both water and lipids) properties. Solvents can be broadly classified as either aqueous (water-based) or organic (hydrocarbon-based) and within each classification, further classifications are necessary to account for differences in structure and physical properties. In this work, the attention is focused on organic solvents, given their widespread industrial use.
Organic solvents are largely used to dissolve and disperse fats, oils, waxes, pigments, varnishes, rubber and many other substances. They are used in almost all manufacturing process in a wide variety of application, thus practically all branches of modern industry uses solvents, as in the case of cleaning industry (e.g. dry cleaners and floor cleaning), plastic industry, metallurgical industry (e.g. surface treatment and degreasing of metal), food and pharmaceutical industry (e.g. extraction of oils), agriculture (in pesticide products), building sectors (e.g. use of paints and glues), besides obviously chemical industry. This results in millions of workers exposed to organic solvents, which are absorbed by the human body by dermal route or inhalation. In 1994, one third of French employed population was exposed to chemical substances, mostly belonging to the solvents family [Heran-Le Roy, 1997]. Besides occupational exposure, indeed many of the products used in everyday living contain solvents. For example, they represent important components of many beauty and cosmetic products, such as nail polish and nail polish remover, and they are also present in several household products, to clean and dissolve dirt. According to the French National Institute of Research and Security (Institut National de Recherche et de Sécurité, INRS), organic solvents in industry can be classified into eight principal groups according to their chemical similarities: (i) aromatic hydrocarbons, (ii) petroleum solvents, (iii) alcohols, (iv) esters, (v) ketones, (vi) ethers, (vii) glycol ethers, (viii) halogenated hydrocarbons. Another group contains all other solvents that are not included in any of the group above.
40 In our study, we focused on 15 solvents, for which job exposure matrices were available, as they have been developed by the French Institute for Public Health Surveillance (Institut de Veille Sanitaire, InVS). The solvents are grouped in three large categories:
- Chlorinated solvents: trichloroethylene (TCE), perchloroethylene (PCE), methylene chloride (DCM), chloroform (CF) and carbon tetrachloride (CT);
- Fuels and petroleum-based solvents, including benzene (BZ), mineral spirits (white spirits) and other light aromatic fractions (WS), gasoline (GL), kerosene/diesel oil/fuel oils (KDF) and special-boiling-point spirits and other aliphatic petroleum-based solvents (SBPs);
- Oxygenated solvents: alcohol (Alc), ketone/esters (KetEst), diethyl ether (Et2O), ethylene
glycol (Glycol) and tetrahydrofuran (THF).
In Table 3 the distribution of solvent use in France in 2004 is shown for each category. Details about solvents definition and characteristics are provided in the following paragraphs.
Table 3. Distribution of solvent use, France 2004.
Chlorinated solvents Fuels and petroleum-based solvents Oxygenated solvents
Overall solvent consumption (100% = 548,000 tons)
< 5% 41% 52%
Consumption according to solvent categories
46% Methylene chloride 62% Non-aromatic solvents 45% Alcohol
38% Perchloroethylene 38% Aromatic solvents 20% Ester
15% Trichloroethylene 20% Ketone
1% Chlorobenzene 8% Glycol ether
7% Other ethers
41 1.13.1.1 Chlorinated solvents
Chlorinated solvents are hydrocarbons containing chlorine atoms in their molecular structure and belong to halogenated hydrocarbons family.
The main chlorinated solvents are described in the Table 4: Table 4. Main chlorinated solvents.
Denomination Common name Formula
CHLORINATED METHANES
Chloromethane Methyl chloride CH3Cl
Dichloromethane Methylene chloride (DCM) CH2Cl2
Trichloromethane Chloroform (CF) CHCl3
Tetrachloromethane Carbon tetrachloride (CT) CCl4
CHLORINATED ETHANES
1,1,1- Trichloroethane T111,methylchloroform CH3-CCl3
CHLORINATED ETHENES
Trichloroethylene Trichloroethylene (TCE) CHCl=CCl2
Tetrachloroethylene Perchloroethylene (PCE) CCl2=CCl2
Solvents of interest are highlighted in bold.
Source: InVS, Éléments techniques sur l’exposition professionnelle à cinq solvants chlorés, 2009.
They are the most commonly used in chemical industry for feedstock uses. Generally speaking, their wide use in many industrial and commercial applications is due to their excellent ability to dissolve oils, their fast evaporation rates and their chemical stability (they are not flammable). Therefore, they are particularly used as cleaning products and degreasers for textiles and metals.
Most chlorinated solvents are toxic and irritant. Acute effects could concern depression of the central nervous system, damage to lung, heart, kidney or liver, and also skin irritations. Chronic effects appear as damage to the nervous system whose symptoms are headache, memory disorders, asthenia. Some solvents are also considered carcinogens. However, the health effects depend on the specific type of solvent.
In Table 5, for each of the five chlorinated solvents selected by the InVS for the evaluation of occupational exposure we give a brief description according to their widespread use, their regulations and their toxicity.
42
Chlorinated solvents Use Regulation Cancer site IARC classification
Trichloroethylene TCE
- industries for metal and textile degreasing
- for cleaning and removing paint, adhesives, glue, plastic or rubber
Since ‘70s its use has been reduced, because suspected to be carcinogen
- convincing evidence for renal-cell carcinoma - less consistent evidence for liver cancer and
non-Hodgkin’s lymphoma (NHL) - increased incidence of lung cancer only in
studies on animals
Group 1 (2012)
Perchloroethylene PCE
- dry-cleaning sector
- for metal degreasing, and removing paint, adhesives, glue, plastic or rubber
In France, PCE production reached its maximum in the late ‘80s and then
declined
- consistent patterns across studies for bladder
cancer
- some positive associations with cervical, kidney,
esophageal cancer, and NHL
Group 2A (2012)
Methylene chloride DCM
- in plastic and rubber production ('40s) - as anaesthetic and liquid refrigerant ('40s)
- in chemical and pharmaceutical industries (‘70s -‘80s)
- in food industry (‘70s -‘80s) - in textile industry (‘70s -‘80s) - in cellulose ester industry
(cinematographic and photographic films) (‘70s - ‘80s)
- as metal degreaser in the airline and electronic industry (‘70s - ‘80s)
Not available - liver and biliary tract cancers (suggested excess) - leukemia (suggested excess)
Group 2B (1999) Group 2A (in prep.)
Chloroform CF
- as anaesthetic (until the ‘60s)
- as extraction agent in the chemical and pharmaceutical industries
- in the synthesis of Freon (refrigerant gas)
Not available - kidney and liver tumors (studies on animals) Group 2B (1999)
Carbon tetrachloride CT - in rubber industry ('50s) - in textile industry ('50s) - in pharmaceutical industry ('50s) - as a component of pesticides ('50s) - as metal degreaser ('50s)
- in chemistry and biology sectors ('90s) - in dry-cleaning ('90s)
Its use has been strongly regulated over
43 1.13.1.2 Fuels and petroleum-based solvents
Fuels and petroleum-based solvents category covers those fuels and organic solvents that are produced by crude oil refining. They correspond to petroleum fractions obtained by petroleum distillation, and they are made up of hydrocarbons. Petroleum-based solvents are generally defined and differentiated by certain physical properties and by chemical composition. However, some of these properties are interrelated and they may be measured differently in different industries or geographic regions. As a consequence, the same name may be used for solvents that are not identical, and different classification systems or names may be more common in one industry or geographic region than another. 'White spirits', for example, is a common term in Europe but is seldom used in the USA.
Petroleum solvents can be divided into two classes: (i) aromatic solvents, composed of one or more benzene rings (benzene, toluene, xylenes) with an excellent solvating power; and (ii) non-aromatic solvents, composed of linear (aliphatic) or cyclic hydrocarbon with a lower solvating power. Most of these substances are mainly used as fuels, as solvents and diluent (e.g. for paints and glue) or as degreasing agents (e.g. for metal tools). They have in common acute and chronic toxic effects, which consist essentially of skin, mucous membranes and central nervous system damages. However, generally petroleum solvents are mixtures, whose health effects are often difficult to determine precisely, because they vary according to the specific composition.
In Table 6 we present a brief description of each of the five categories of petroleum products selected by the InVS, according to their composition (aromatic hydrocarbons content), main use (as solvent or as fuel), and toxicity.