HAL Id: hal-01293233
https://hal.archives-ouvertes.fr/hal-01293233
Preprint submitted on 25 Mar 2016HAL is a multi-disciplinary open access archive for the deposit and dissemination of sci-entific research documents, whether they are pub-lished or not. The documents may come from teaching and research institutions in France or abroad, or from public or private research centers.
L’archive ouverte pluridisciplinaire HAL, est destinée au dépôt et à la diffusion de documents scientifiques de niveau recherche, publiés ou non, émanant des établissements d’enseignement et de recherche français ou étrangers, des laboratoires publics ou privés.
Weighting deprivations using subjective well-being: An
application to the Multidimensional Child Poverty Index
in Vietnam
Dat Vu Hoang, Laure Pasquier-Doumer
To cite this version:
Dat Vu Hoang, Laure Pasquier-Doumer. Weighting deprivations using subjective well-being: An application to the Multidimensional Child Poverty Index in Vietnam. 2016. �hal-01293233�
UMR 225 IRD - Paris-Dauphine
1
D
OCUMENT DE
T
RAVAIL
DT/2016-01
Weighting deprivations using
subjective well-being: An
application to the Multidimensional
Child Poverty Index in Vietnam
VU HOANG Dat
2
Weighting deprivations using subjective well-being: An application to
the Multidimensional Child Poverty Index in Vietnam
1Vu Hoang Dat
2Centre for Analysis and Forecasting, VASS, Hanoi
PSL, Université Paris Dauphine, LEDa, 75016 Paris
Laure Pasquier-Doumer
IRD, UMR DIAL, 75010 Paris
PSL, Université Paris Dauphine, LEDa, 75016 Paris
Abstract
Although multidimensional approach to study child poverty has received growing attention, weights of different dimensions in constructing single aggregation indices have not been properly investigated. Using Young Lives data, this study attempts to fill this gap by examining a weight estimation method which takes into account the children’s perspectives. This approach consists of computing analytical weights from estimated parameters of a subjective well-being regression model, where children’s subjective well-being is explained by their achievement in dimensions included in multidimensional poverty indices. By doing so, weights reflect value judgments of children on what is a good life and are not based on a normative approach. Estimation results indicate that revealed preferences of children change overtime and across sub-groups of children. More importantly, this paper demonstrates that children do not give the same value to all dimensions, contrary to what the most common approach to calculate weights is supposing. Children then attach more importance to deprivations such as shelter, water and sanitation deprivations, which impact immediately their well-being than to deprivations which may affect negatively their well-being in the long-term, with the exception of education for some groups of children.
Key words: multidimensional poverty index, weights, children poverty, subjective well-being, Vietnam Résumé
L’approche multidimensionnelle pour étudier la pauvreté des enfants a reçu une attention croissante. Pourtant, la question de comment pondérer les différentes dimensions de la pauvreté dans la construction d’un indicateur synthétique de pauvreté reste encore largement sous-étudiée. A partir des données Young Lives, cette étude s’attache à combler cette lacune en examinant une méthode d'estimation des poids qui prend en compte les perceptions des enfants. Cette approche consiste à calculer le poids à partir des paramètres estimés d'un modèle expliquant le bien-être subjectif des enfants par leur réalisation dans les différentes dimensions de la pauvreté incluse dans l’indice synthétique. Les poids ainsi obtenus reflètent les valeurs des enfants sur ce qu’ils considèrent bien vivre, sans apporter de jugement normatif comme le fait l’approche donnant la même valeur à toutes les dimensions qui est actuellement suivie au Vietnam. Les résultats indiquent que les préférences révélées des enfants varient au cours du temps et entre sous-groupes d'enfants. Surtout, cette étude démontre que les enfants ne donnent pas la même valeur à toutes les dimensions. Ils attachent plus d'importance à des privations qui ont un impact immédiatement leur bien-être telles que celles relatives aux conditions d’habitat, à l’accès à l’eau, à l’assainissement qu’aux privations qui impactent leur bien-être à plus long-terme, à l'exception de l'éducation pour certains groupes d'enfants.
Mots-clefs: indice de pauvreté multidimensionnelle, pondération, pauvreté des enfants, bien-être subjectif, Vietnam
JEL Code: I32, C43, D63
1
The authors thank Nguyen Thang and Pham Minh Thai for their fruitful contribution to the draft version of this paper, and the Young Lives team and an anonymous referee for valuable comments on earlier versions of this paper. This paper has received funding from the Young Lives Project (http://www.younglives.org.uk), and from the NOPOOR project (http://www.nopoor.eu) under the FP7 of the European Commission. Young Lives is funded by UK aid from the Department for International Development (DFID) and co-funded from 2010 to 2014 by the Netherlands Ministry of Foreign Affairs.
2
3 Introduction
Poverty is a multifaceted phenomenon. It is now widely acknowledged in the academic literature as well as in the policy debate. The shift of emphasis from a single dimension to a multidimensional approach has arisen from limitations of the monetary approach to poverty. Indeed, this approach excludes all dimensions of people’s well-being that could not be purchased in the market. More generally, it does not take into account the freedom and the opportunity of people to achieve functioning combinations, as developed in the Amartya Sen’s seminal capability approach. Monetary approach is even more limited for child poverty, as children’s entitlement over household resources is extremely marginal, and because income measurement does not consider intra household allocation (Trani, Biggeri, and Mauro 2013).
Multidimensional approach of poverty has raised considerable challenges in the measurement of these dimensions and on the best way to render them indicators that would be easily usable by policymakers. Condensing multiple dimensions into a single index offers the advantage of summarizing the complexity of the problem in a simple way. However, the pertinence of a single composite index is still a debatable issue. One of the main criticisms towards this kind of multidimensional measure is related to the way to assign relative weights to each dimension, which indicates the trade-offs between the dimensions of well-being (Ravallion 2011). Indeed, weights are often defined arbitrarily, reflecting particular value judgments on what is a “good life”, although it is very likely that individuals in a society disagree on the most appropriate weights assigned to various dimensions of their well-being.
Most studies on the topic employ equal weight attached to all dimensions. Beside the advantage of simplicity, the equal weight approach relies on the recognition that all dimensions are equally important with regards to human rights. Regarding child poverty, UNICEF’s reports on child poverty adopted a position in which all the rights in the United Nations Convention on the Rights of the Child (UNCRC) were regarded as of equal importance. However, equal weight approach relies on two strong assumptions that have been highly criticized in the literature. First, it assumes the universality of children rights, as formally expressed in UNCRC. Yet, “the development and best interests of children are likely to be defined differently in different places and contexts”, as argued by Camfield, Streuli, and Woodhead (2009, p.77). Second, the children perspective is ignored in this approach. Many authors have advocated for a child-focus perspective (Jones and Sumner 2011). In this perspective, children are viewed as social actors and they should be allowed to take a role in defining what counts toward child well-being (Ben-Arieh 2005).
To overcome the first criticism of normative approaches, some authors rely on data-driven approaches, which depend only on the distribution of deprivations, and not on a particular value
4 judgment on the trade-offs between deprivations (Decancq and Lugo 2013, Ayala et al. 2011). For instance, the frequency-based weight approach supposes that individuals attach a higher importance to the deprivations that are the less widely shared in the society. However, it makes an implicit assumption that when a deprivation is alleviated in the society, the weight of this deprivation will change, even if individuals do not change their value judgment on the trade-offs. Consequently, both the data-driven and normative approaches fail to take into account the individual subjective views (or preferences) on what constitutes a “good life”, as different groups may have different sets of value (Castilla 2012; Alem, Köhlin and Stage 2014; Schokkaert, Van Ootegemn and Verhofstadt 2011). In particular, children’s view on their well-being presumably differs from that of adults (Bhatnagar and Gupta 2011).
Other authors introduce the preferences of the people on the trade-offs between poverty dimensions by weighting the dimensions according to the answer of people on what they regard necessary in order to have a decent standard of leaving (Bossert, Chakravarty and D’Ambrosio 2013). As for child poverty, the only one study, to our best knowledge, that integrates the children perspectives while measuring an index of multidimensional children poverty follows this approach. Fernandes, Mendes, and Teixeira (2013) set the weights by considering the degree of importance the child gives to each dimension of deprivation in Portugal. They asked children to order several items by their importance, and for each child, the weights are computed to reflect this ordering, following a procedure similar to that adopted by De Kruijk and Rutten (2007) for the adult poverty index of the Maldives. The index of well-being then combines objective items with children’s subjective perceptions about them. However, this approach requires specific data collection, which is costly and may not be suitable for regular national living standards measurement survey as numerous questions are needed.
In this paper, we propose another approach that allows the acknowledgement of children’s perspectives and is less data-intensive. This approach that relies on emerging measures on subjective well-being. As Schokkaert (2007), we consider that “if one accepts that the opinions of the people concerned should play some role in the evaluation of the trade-offs between different dimensions of well-being, the information about what makes people feel ‘more satisfied with their life as a whole’ seems relevant within the capability approach” (p.415). Indeed, a recent and promising literature use the measure on self-reported life satisfaction to identify which are the preferences for each dimension. Acknowledging heterogeneity in preferences, Fleurbaey, Schokkaert, and Decancq (2009) use the estimation of the self-reported satisfaction level to identify the preferences of individuals on the different dimensions of deprivations in the measure of welfare in terms of equivalent incomes. They rely on longitudinal data collected in Russia. Schokkaert, Van Ootegemn, and Verhofstadt (2011) compute an index of job quality where the weights of different dimensions of job are based on the
5 importance of each dimension in the explanation of job satisfaction. This literature is based on the assumption that people are able to provide an accurate measure of psychological feelings of well-being. According to the growing literature on happiness, self-reported satisfaction is a reliable measure of the subjective well-being, as far as some idiosyncratic individual factors are controlled for. As “adaptation, expectations and relative deprivation” (Schokkaert, Van Ootegemn, and Verhofstadt, 2011) (p.687) also determine the satisfaction, we have to remove effects of these factors from the association. In other words, the subjective well-being is also determined by “a frame of reference” or aspirations of each individual (Fleurbaey, Schokkaert and Decancq 2009). Since these factors are “personal responsibility”, we have to remove their effects to have a cleaned picture of the link between the subjective well-being and deprivation dimensions.
One may argue that the subjective well-being could be used as an aggregate measure of poverty. However, this measure suffers from a couple of shortcomings. Firstly, since the heterogeneity in preferences as well as individual aspirations also determines the overall satisfaction as discussed above, the use of the subjective well-being as an aggregate measure of poverty can be biased because the measure may not correctly reflect deprivation status of respondents. In addition, these factors may change overtime that make the aggregate measure of poverty purely based on the subjective well-being are hard to be comparable across time. Lastly, the subjective well-well-being does not have information on the relative importance of each dimension in the overall measures. Hence, there is little information for the detail policy design and monitoring.
Therefore, this paper proposes a new methodology for weighting the various deprivation dimensions in a single-composite index that is based on the measure of children subjective well-being. The methodology relies on linking measured outcomes of different dimensions of children’s life and their subjective evaluation of their well-being. Individuals would have different outcomes in the selected dimensions, and their views on the overall well-being implicitly reveal judgments they attach to these dimensions. Hence, the association between the subjective evaluations and the outcomes/achievements would provide a set of weights reflecting children’s assessments on the relative importance of the dimensions. This approach is known as the “hedonic” approach, classified as a hybrid approach by Decancq and Lugo (2013), as compared to data-driven and normative approaches. More precisely, the weights are derived from the estimated parameters of a subjective well-being regression model, where children’s subjective well-being is explained by their achievement in each dimension. Since preferences may not be homogenous across children, the estimations take into account differences in preferences of different groups of children. This methodology overcomes the normative aspect of the rights-based approach with equal weight which dominates the literature on child poverty, and allows the acknowledgement of children’s perspectives,
6 which are generally overlooked in child poverty analysis.
This methodology is applied to the Multidimensional Child Poverty Index in the context of Vietnam. In Vietnam, the multidimensional approach to poverty measurement and analysis has received a growing recognition among researchers, policy makers and practitioners, thanks to a number of initiatives introduced in recent years. Among such initiatives, an influential study on multidimensional child poverty in Vietnam was conducted by UNICEF in 2006 in collaboration with the Social Assistance Department of the Ministry of Labor, Invalids and Social Affairs (MOLISA), General Statistical Office (GSO) and several line ministries. They highlighted that the monetary and the multidimensional approaches produced substantially different results with regard to the identification of poor children. Using data from the Vietnam Household Living Standard Survey 2006, the report found that 12 per cent of children were poor by both monetary and multidimensional measures, as opposed to 30 and 23 per cent identified as poor under the multidimensional and single monetary approaches respectively (MOLISA et al., 2008). As a result of these initiatives, indicators of multidimensional child poverty have been adopted by the General Statistical Office (GSO), and the multidimensional approach to studying poverty started to get institutionalized. Notably, the MOLISA, which is mandated by the Government to coordinate poverty reduction policies and programs in Vietnam, has recently proposed a comprehensive project on reforming poverty reduction approach in the country where multidimensional approach is expected to be employed in the national poverty alleviation program for the 2016-2020 period. However, commentators from both the policy making and research community in Vietnam raised a concern about the use of equal weight across dimensions - the weight setting method being applied to all studies on multidimensional poverty in Vietnam so far.
By taking advantages of data availability of Young Lives surveys, this paper aims to contribute to the academic and national debates on the measurement of multidimensional poverty, by integrating the setting of value by each child on different dimensions of the life in the weighting scheme. It is organized as follows. Section 2 develops the conceptual background and the empirical strategy, by discussing firstly the meaning of weights in the Multidimensional Poverty Index (MPI), by detailing formula to derive them, and by presenting the empirical models. Section 3 introduces the dataset, the definition of the dimensions of poverty, and provides descriptive statistics. Section 4 presents the estimation results and the weights calculation. It compares the poverty head count estimated with the equal weight and weights estimated from our approach as well. Section 5 draws conclusions.
7 2. Conceptual background
In this section, we present how we use subjective well-being to reveal children’s judgments on achievements in different dimensions of their life and how we derive weights from this association in the MPI (Alkire and Foster 2011) calculation. The proposed method in the current study can be employed to estimate weights in any indices which are based on the linear combination of dimensions. However, we apply it to the Alkire and Foster index as an illustration because of its popularity3, but to be as close as possible to the national debate in Vietnam. Indeed, this index is being proposed to estimate multidimensional poverty figures for the Vietnam’s national poverty reduction program for the 2016-2020 period. We first recall Alkire and Foster’s MPI and investigate meanings of weights in this index. Formula for calculating weights from an empirical equation that expresses the association between the subjective well-being and achievements in different dimensions of people’s life will subsequently be presented.
2.1. Alkire and Foster’s Multidimensional Poverty Index
Let , denote achievement and deprivation status of individual i in dimension j respectively, and is the deprivation cut-off of the dimension.
We have = where is the weight for the dimension j, and a dummy that takes the value 1 if < , and 0 otherwise. As noted in Alkire and Santos (2010), weights are nested that means ∑ = , where d is the number of dimensions.
Deprivation counts c of individual i is just the sum of with:
= ∑ = ∑ (1)
k is a second cut-off which is called as poverty cut-off (Alkire and Foster 2011) for identifying the multidimensional poverty status, as the identification function with:
=0 if < and =1 if ≥ . (2)
The mean of across households/individuals is then the multidimensional poverty headcount ratio, H. However, this measure does not have the desired property of monotonicity. Thus, Alkire and Foster introduced an index called the Adjusted Headcount Ratio, . When dimensions, indicators and weights are specified, is called the Multidimensional Poverty Index (MPI). is defined as the sum of the deprivations experienced by the poor divided by the total number of dimensions of the whole sample which is calculated as the total number of people times the number of dimensions. Put it differently, MPI can be expressed as the product of two computable components: the poverty
3
8 head count ratio (H) and the Intensity of Poverty (A). A is the weighted average proportions of deprivations a poor person suffers.
With the linear expression in (1), the nature of weights is the capacity of substitution across dimensions and the Marginal Rate of Substitution (MRS) between dimension j and dimension s is
.
2.2. Empirical model and deriving weights
To formulate the association between the subjective well-being and the achievements of dimensions, we employ the form of Fleurbaey, Schokkaert and Decancq (2009), which is applied to estimate “equivalent income” based on achievements of individual taken in account differences in their preferences. Specifically, the subjective well-being is explained by achievements of different dimensions and characteristics of respondents.
= + ∑ + ∑ ∑ + ∑ + (3)
where , and are reported subjective well-being, achievement of dimension j and characteristics q of respondent i respectively. , , and are estimated coefficients, and is the residual term.
The second component of the right-hand side of equation (3) is a vector of achievements and its estimated coefficients reveal judgments of a group of individuals who act as the based group. The third component reflects interactions between personal characteristics and achievements which capture differences in judgments across sub-groups of the population with different characteristics. Although the model allows differences in preferences, it assumes that individuals with the same observable characteristics have identical preferences as noted in Fleurbaey, Schokkaert, and Decancq (2009). In the fourth component, personal characteristics are separately included in the model as proxy measures for aspiration levels or “the frame of reference”. More precisely, some individual’s characteristics may be associated with expensive tastes, in which a higher level of aspiration may dampen an individual’s satisfaction, or on the contrary could be associated with limitation of aspiration through an adaptive process to the objective circumstances (Elster 1985). As discussed in the introduction, the effect of these factors has to be removed from the association between deprivation and individual’s satisfaction.
We now turn to an important question, which is how to derive weights from equation (3). In this equation, it is assumed that MRSs across dimensions reveal opinions of respondents on the “trade-off” between dimensions. Therefore, MRSs across dimensions in equation (3) are estimations of MRSs in equation (1). Given the ordinal nature of the subjective well-being question and answer,
9 equation (3) is often estimated with an ordered logit model. In Appendix I, it is demonstrated that the MRS between dimensions and is:
= ∑
∑ (4)
With the nested condition as noted above, we have weight of dimension j as:
w = ∑
∑ ∑ ∑ (5)
Equation (3) allows for differences in revealed judgments across sub-groups of respondents with certain characteristics (such as gender or ethnicity). Therefore, weights defined by the equation (5) do not depend on the subjective well-being as well as achievements across dimensions but they vary with personal characteristics C of respondents.
It should be noted that weights in Alkire and Foster (2011) Multidimensional Poverty Index is based on an assumption of substitutability between dimensions. Furthermore, the framework here suffers from two limitations. Firstly, there is possible existence of unobserved heterogeneity in judgments as well as aspirations. Secondly, dimensions are correlated that results in large standard errors and difficulties in extracting individual effects of dimensions (Decancq and Lugo 2013). To address the first limitation, we include educational aspirations as a proxy for unobservable overall aspirations. Furthermore, we explore the feasibility of fixed effect models.
3. Data, definition of dimensions and descriptive analysis
3.1. The Data
Data is sourced from Young Lives surveys in Vietnam. Young Lives is a longitudinal study of 12,000 children in three countries of Ethiopia, Peru, Vietnam and Andhra Pradesh state of India4, led by the Department of International Development at the University of Oxford. Since 2002, 1,000 children born in 1994-1995 (the older cohort (OC)) and 2,000 children born in 2000-2001 (the younger cohort (YC)) have been tracked over time in each country. To date, four survey rounds, R1, R2, R3 and R4 have been conducted to collect information on children and their families as well as their community in 2002, 2006, 2009 and 2013 respectively.
In Vietnam, the sample covers five purposively selected provinces in four regions and it is equally allocated across provinces in both cohorts. Principally, communes are selected as sentinel sites with a
4
10 random sample of 50 and 100 children in the older and younger cohorts respectively.5 In this paper, we focus on the older cohort, which comprises children aged 11-12 (R2) and 14-15 (R3) for a pragmatic reason: information on subjective well-being is available for the older cohort in two rounds (R2 and R3), and available only in one round (R3) for the younger cohort. Consequently, it is not possible to conduct panel analysis for the younger cohort.
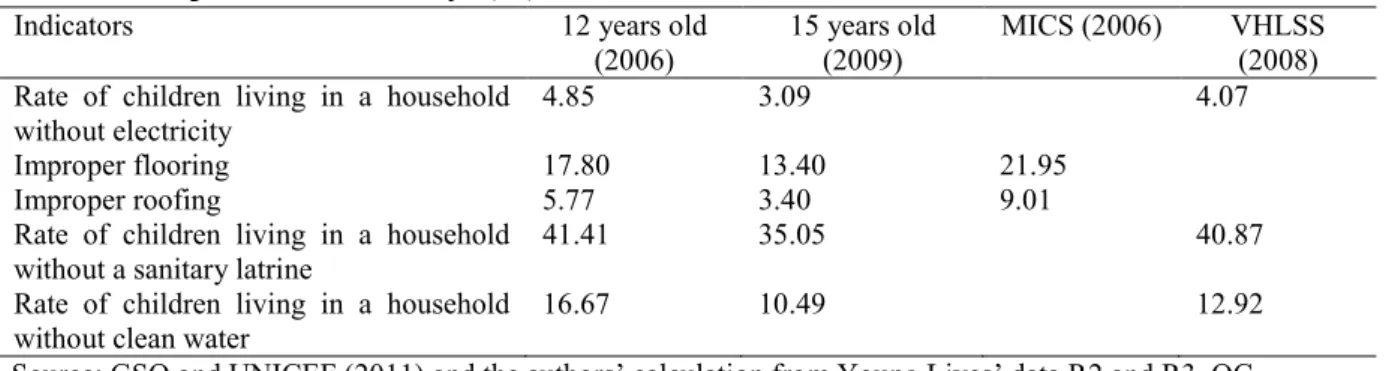
As the Young Lives sample is not nationally representative, a frequent question raised is how the Young Lives data reflects (or alternatively, deviates from) the national picture. Table 1 presents rates of deprivation across selected indicators calculated from Young Lives data and Vietnam Household Living Standard Survey 2008 (VHLSS2008) as well as Multiple Indicator Cluster Survey 2006 (MICS 2006), both are nationally representative surveys. Rates of deprivation of electricity, water and sanitations are only slightly different from those calculated from VHLSS 2008. Therefore, the Young Lives data get along well with the nationally representative data in these indicators. However, differences in the rates of improper flooring and roofing from nationally representative samples are more pronounced, especially the roofing one. Therefore, Young Lives data is capable of reflecting the national diversity in a number of aspects, but not all.
[Table 1 here]
3.2. Dimensions of multidimensional poverty indices
A crucial step in constructing MPI is to select the informational basis for constructing multidimensional poverty indices. Scholars may take as inputs capability, i.e. opportunity for people to realize their desirable life. Another approach is to define the poverty status based on functionings, i.e. achievements in different aspects of people’s life. For each approach, a set of dimensions and measurement indicators are consequently defined. However, for the case of children, the capability approach has a critical disadvantage that children do not fully control their capability. Put differently, realization of capability into outcomes are affected by their environments such as family or community (MOLISA, UM, and UNICEF, 2008). Therefore, we adapt the choice of dimensions in the report of MOLISA, UM and UNICEF for children in Vietnam which is based on the functioning approach. This work has been regarded as one of the most comprehensive multidimensional child poverty studies in Vietnam, and we want to ensure the comparability with it where possible.
The MOLISA, UM and UNICEF report defines several steps in selection of dimensions. In the first step, a list of domains/dimensions was constructed from the concept of child poverty which is in turn based on the 1989 United Nations Convention of the Rights of the Child and the basic needs concept
5
11 used in Vietnam, the status quo of literature and general consensuses such as Millennium Development Goals. Next, participatory processes with involvements of various stakeholders of the society were used to include views and opinions of stakeholders and key-informants of the society. The final step is to assess data availability. With these steps, it is safe to say that the domains and indicators are based on a sound theoretical framework as well as “a fair representation of child poverty in Vietnam” (MOLISA, UM, and UNICEF, 2008).
At the final state, the list of dimensions in the report includes seven dimensions (education poverty, health poverty, shelter poverty, water and sanitation poverty, child work, leisure poverty, social inclusion and protection poverty) and their corresponding measurement indicators. However, when the list is applied to the data set used in this paper, some adjustments should be made. Firstly, the health indicators in the aforementioned list are only applicable for children aged 2-4 years old. However, nutrition data is available in our data source and it is used as a substitution for the health indicators. Secondly, information of leisure poverty measured by indicators in the list (having toys, having at least one book) is not available in our data source. One may look at playing time as an alternative measure of the leisure dimension. However, it does not properly reflect the leisure status of children because of a frequently counter situation that children in poor households may report higher playing time as a consequence of their inappropriate time for studying. Therefore, this dimension is excluded. Furthermore, social protection is measured by status of household head but information of identifying household heads is not available in R3 of Young Lives survey and this dimension is also excluded in our study. Consequently, dimensions as well as their measured indicators included in this study are listed in Table 2.
[Table 2 here]
As depicted in Table 2, some dimensions, such as shelter or water and sanitation include more than one indicator. Therefore, one has to aggregate deprivations in indicators into deprivations in dimensions. In the current paper, we also follow the method of aggregation in the report of MOLISA, UM and UNICEF (2008) that children are regarded as deprived in a dimension if they are deprived in one or more indicator(s) of the dimension. For example, a child is considered as deprived in the shelter dimension if he or she lives in a house without electricity or either improper flooring or roofing.
12 3.3. Descriptive analysis
Before embarking on the estimation exercise and derivation of weights, it is worthwhile to analyze variances of the subjective well-being and shortfalls of children on different dimensions. This kind of analysis provides useful information for model specifications and the formulation of estimation strategies.
For the subjective well-being, the corresponding question asked in various rounds of Young Lives survey follows the common ladder form “There are nine steps on this ladder. Suppose we say that the ninth step, at the very top, represents the best possible life for you and the bottom represents the worst possible life for you. Where on the ladder do you feel you personally stand at the present time?”. Hence, the answer provides ordered data and therefore the higher steps ticked by the respondent, the higher subjective well-being of the respondent is. Distribution of answers of children to the subjective well-being question by older cohorts is presented in Figure 1. For children at age of 12 and 15 years old, the subjective well-being variable roughly follows a normal distribution.
[Figure 1 here]
Turning to variances of dimensions, Table 3 presents the deprivation rates related to each dimension and to their transitions across the two rounds, as well as the level of satisfaction associated with each transition. The five dimensions can be divided into two groups; the first group includes education, health and work, which are measured at the child level; the second group of shelter and water and sanitation are measured at the household level. Consequently, behaviors vary across the two groups. Except the health dimension for which we cannot make a priori prediction of changes overtime, the two remaining dimensions of the former group are expected to increase with ages of children. Meanwhile, the second group normally improves overtime, especially for the case of Viet Nam. As depicted in Table 3, changes in deprivations of different dimensions are generally in line with the predictions. Prevalence of deprivations of the first dimension group increases across the two rounds, by approximately 9 and 4 percentage points for the dimensions of education and child work respectively. Meanwhile, shortfalls of the shelter and water and sanitation dimensions have declined by almost 5 and 9 percentage points respectively.
[Table 3 here]
With regard to transitions, the two groups of dimensions also have different transition patterns. For the group of dimensions measured at the household level, moving into deprivation is limited, with only 2.2 and 4.3 percent of households/children falling into deprivations in the dimensions of shelter
13 and water and sanitation respectively. In contrast, there is only one direction of falling into deprivation for the education dimension due to its definition. Meanwhile, variances in both directions are observed for two other dimensions measured at the child level.
Table 3 also reports the across-two-round changes in the subjective well-being of specific deprivation transition groups for each dimension, together with its proportion. The pattern of these changes is somewhat in line with expectations for the dimensions of education, water and sanitation and child work as moving out or falling into deprivations result in higher or lower improvements in the subjective well-being as compared to staying in deprivation or non-deprivation. However, for the health and shelter dimensions, increases in the subjective well-being of children who fall into poverty are higher than of those who stay free of deprivations, even if the differences are statistically insignificant. This may indicate changes in preferences of children overtime.
In short, the patterns of changes in deprivations of dimensions vary: improvements are observed for dimensions measured at the household level and increases in deprivations are found for dimensions measured at the children level. Furthermore, three dimensions of education, shelter and water and sanitation mainly change in only one direction. Meanwhile, the subjective well-being assessments are unusual for some sub-groups of children who experience specific transitions: falling into deprivations of health or shelter resulted in larger increases in the subjective well-being as compared to staying in the non-deprivation status.
4. Estimation results
The estimation strategy relies on sectional analysis as well as on panel analysis. In the cross-sectional analysis, we estimate equation (3) with ordered logit models using data collected in R2 and R3. To control for heterogeneity in the “frame of reference” as discussed in Section 2.2, characteristics of the children which are likely to shape their “frame of reference” are introduced in the model, including gender, living areas (urban versus rural), ethnicity and religion. The educational aspiration of the children as a proxy for the overall aspiration is also included in the model.6 However, unobserved characteristics may affect the level of the subjective well-being and their omission could lead to an endogeneity bias in the estimation of the coefficients , . To address this issue, a fixed effect model is also estimated as an effort of wiping out the bias generated by unobserved time-invariant characteristics. However, fixed effects models raise other concerns, which shall be detailed in section 4.2.
6
To construct children’s educational aspirations the question "Imagine you had no constraints and could stay at school as long as you liked,
what level of formal education would you like to complete?" in R2 and the question "What level of formal education would you like to complete?" in R3 have been used. The education aspiration is converted into three levels of completing lower secondary, upper
14 4.1. Cross-sectional estimation
We aim to derive weights as general as possible. This advocates for aggregating the two rounds together. However, it makes sense only if the preferences of the children do not change overtime, or in other words, only if judgments of the based group captured by the second component in equation (3) and differences in judgments across sub-groups captured by the interactions between deprivations and individual characteristics as the third component in equation (3) are the same overtime. For this reason, we firstly do estimations for the two age-groups separately.
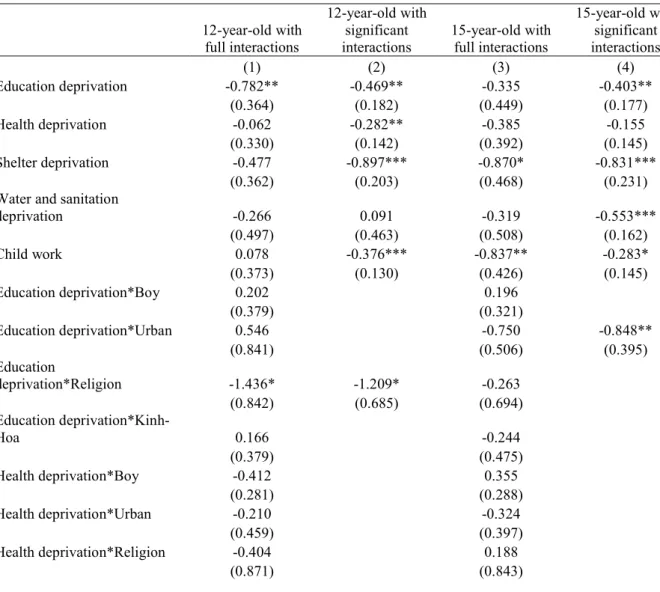
Exclusion test has been conducted for the interaction variables and only significant interaction variables are kept at the final stage of estimation. Results of the estimation of equation (3) with full interactions and the model after dropping insignificant interactions are given in Table 4.7 Statistics of the log likelihood ratio test and critical values for rejecting hypothesis of exclusions are provided at the bottom of the columns. All statistics values are smaller than the critical values so exclusions of insignificant interaction variables do not cause econometrical problems.
[Table 4 here]
At glance, results of the two groups are significantly different. There are two significant interaction variables for the 12-year-old group, which are education deprivation with the dummy for having a religion, and water/sanitation deprivation with the dummy for ethnic minority belonging. For the 15-year-old group, the interaction variable between education deprivation and the living areas is significant. From this result, we can draw the conclusion that preferences vary across groups and are not stable over time as discussed in Section 3.3.The significant interaction variables indicate that we have four different preferences for sub-groups in terms of religion and ethnicity and two different preferences for sub-groups in term of living areas for the 12-year-old and 15-year-old groups respectively. Consequently, the test for combination is not necessary and we should estimate the models as well as the weights for each age group separately.
4.2. Panel estimation
To overcome a potential endogeneity bias in the estimation of parameters in equation (3) that is due to unobserved time-invariant characteristics, we rely on fixed effect models as well. However, it should be noted that fixed effect models with discrete dependent variables suffer from the problem of incidental parameters. A number of estimation procedures have been proposed to overcome the
7
To save space, we only present in Table 4 information on coefficients for the dimensions and their interactions, which are of our main interest - , the rest of the estimation results (i.e. estimated coefficients for control variables) are provided in Appendix II.
15 problem for the ordered logit model (Dickerson, Hole, and Munford, 2011). The current paper uses the procedure suggested by Baetschmann, Staub, and Winkelmann (2011, 2013) as it can work effectively in the case of small number of observations in specific values of the dependent variable. However, this method is inefficient compared to other methods of minimum distance or generalized methods of moments (Baetschmann, Staub, and Winkelmann, 2013).
Another limitation of applying fixed effect models to our case is that changing patterns of some predictor variables vary greatly across children but have limited variations over time for each child. Specifically, except the dimension of child work, all dimensions have less than 20% of children who have changed their deprivation status across two rounds. Furthermore, for three out of five dimensions, changes mainly happened only in one direction as noted in Section 3.3. As fixed effect models only exploit the within-individual differences, they are very likely to be imprecise and to have large standard errors (Allison 2009). This inefficiency does not only lead to large standard errors but also to unreliable estimates that might be far away from the true relationship (Plümper and Troeger, 2007).
Appendix III shows the results of the fixed effect estimation. As expected, standard errors are very large. In particular, for the education deprivation, estimates become not significant, even if the education deprivation plays a crucial role in the subjective well-being assessment, according to the cross-section analysis. As highlighted by Allison (2009), a trade-off between bias and efficiency has to be found. Given these problems with the fixed effect results and because the deprivation status varies greatly across children, while exhibiting little variation over time for each child, we decide to derive weights from results of the cross-sectional estimation. In addition, one may suspect that bias due to omitted variable may be small because the introduction of the variable of educational aspirations should capture the effect of most of unobserved traits of the children that can affect the subjective well-being assessment.
4.3. Estimated weights
Columns (2) and (4) of Table 4 present final estimation results of the associations between the subjective well-being and achievements of dimensions for 12-year-old and 15-year-old children respectively. These results shall be employed to derive weights via equation (5).
We can observe that almost all estimated coefficients are statistically significant at conventional levels. In Column (2), only the coefficient for the water and sanitation deprivation is statistically insignificant. Because the ethnic minority belonging is the base group, the insignificance of this variable can be attributed to the small number of children from ethnic minority group who are living
16 in household with improved water and sanitation (only 15 observations). It is more difficult to explain the insignificance of coefficient for the health dimension in the estimation results for 15-year-old children. Possibly, children have adapted their long term health status as captured by the stunting indicator and they may not give important judgments to this status when they grow up.
Inserting the estimated coefficients of the Columns (2) and (4) into equation (5), we can derive weights for different groups of children as presented in Table 5. Because there are two significant interaction variables – education deprivation with religion; water/sanitation deprivation with ethnicity- in the estimation results for 12-year-old children, we have different sets of weights for four sub-groups of children defined by the religion status and the ethnicity belonging. However, there are only 7 ethnic minority children belonging to a religion. Thus, weight for this sub-group of children does not make sense. Weights are then calculated for three sub-groups at age 12. In the same vein, a very small number of children are living in household with improved water and sanitation among 12-year-old ethnic minority children. Hence, weights are calculated for this group by including only four dimensions out of five i.e. by excluding the dimension of water and sanitation. Meanwhile, two sub-groups of 15-year-old children in term of living areas secure enough number of observations to derive weights.
For the 12-year-old ethnic minority children, the shelter deprivation receives the highest weight followed by the educational dimension, the child work, and then the health deprivation as shown in column (A) of Table 5. For the 12-year-old Kinh-Hoa children who do not belong to a religion, which constitutes the largest group, the dimension of water and sanitation is introduced and it has the highest weight, even if the weight associated with shelter deprivation is very close (column (B) of Table 5). The order of the remaining dimensions is the same that observed for 12-year-old ethnic minority children (education, child work, and then health deprivation). However, belonging to a religion changes the preferences for education for the 12-year-old Kinh-Hoa children. These children value much more education, which is reflected by the highest weight given to education deprivation compared to the third highest weight for their counterpart not belonging to any religion. Water and sanitation deprivation is the second most important dimension, followed once again by shelter deprivation, and then child work and health deprivation. However, the weak number of observations for this group of children casts a shadow of doubt over the robustness of these results.
[Table 5 here]
Two sets of weights for 15-year-old children have been estimated separately according to the rural or urban living areas (presented in Columns (D) and (E) of Table 5 respectively). The 15-year-old children living in the rural areas do not have the same preference for water and sanitation deprivation and for shelter deprivation than the 12-year-old Kinh-Hoa children without religion (the main
sub-17 group of children aged 12). They give the first position to the water and sanitation dimension, and the second one for the shelter dimension, whilst the former group values the shelter dimension the most, and then the water and sanitation dimension. Meanwhile, orders of remaining dimensions are the same (education, child work and lastly health dimensions).
The key difference between 15-year-old children living in the urban areas and their counterparts in the rural areas is the weights on the education dimension. Children living in urban areas give an extremely high weight to the education and keep relative orders of other dimensions as the same as those of their counterparts in the rural areas. Higher education requirements of employments, upper educational aspirations of other household members and peer effects in the urban areas are potential explanations for this result. In addition, preference for education is higher for these children than for the largest group of children aged 12 (Kinh-Hoa without religion). It may indicate that the children become more aware of the importance of education to reach their life goals as they grow up.
But the salient result of Table 5 is undoubtedly that using equal weight for all dimensions does not reflect the preferences of the children. First, children give much less importance to the health deprivation and the fact of working than do the rights-based approach with equal weight. Indeed, the weights we obtained for these two dimensions are less than one whatever the age and other characteristics of children. The fact that working does not affect much the children evaluation of their well-being may be interpreted in the following way. From the children perspective, negative aspects of working can be compensated by the positive ones: working can enhance their self-esteem while contributing to the family support, but also their self-reliance, or their self-confidence by testing their capacity to ensure productive adult life. As far as health deprivation is concerned, we have to recall that the health deprivation indicator is based on the stunting status of the child. This status reflects long term health trajectory of the child. Consequently, children may adapt their preferences to their long term health status, especially if it is shared by their peers.
In order to test the robustness of the result saying that the estimated weights for health and work dimensions are less than one, we estimate the models (2) and (4) where one of the dimensions are excluded, and this for the two main groups of children (groups (B) and (D) of Table 5). Coefficient of health (resp. work) dimension did not change significantly when work (resp. health) dimension is removed from the models and the corresponding weight remained less than one. The same holds true when shelter or water and sanitation dimensions are excluded.
Second, children over-evaluate shelter deprivation compared to the equal weight approach. Shelter symbolizes their relative socio-economic status in the community and its deprivation may be a source of stigma. The same appears for water and sanitation with the exception of urban 15-year-old
18 children.8 These results are robust to the change of specification of models (2) and (4). For the 12-year-old Kinh-Hoa children who does not belong to a religion and for the 15-12-year-old rural children, coefficient is stable and estimated weight for shelter deprivation (resp. water and sanitation) remains higher than one when water and sanitation dimension (resp. shelter deprivation) is excluded from models (2) and (4).
Results are less clear for education deprivation, as it depends on the group of children under consideration: compared to the rights-based approach, ethnic minority children or Kinh-Hoa children belonging to a religion over-value education when they are 12 years-old, as do urban 15 years children; on the contrary, Kinh-Hoa children not belonging to a religion aged 12 and rural 15-year-old children under-value education in their preferences.
Another result is that the frequency-based weight approach, described in Section 1, does not throw back the judgments of the children. Comparing the weights of Table 5 with Appendix IV which provides deprivation rates for sub-groups of both ages, we can observe that highest prevalence of shortfalls or deprivation is not systematically associated with lowest weights, as suggested by this approach. The negative correlation between prevalence of deprivations and weights does not hold for health deprivation and for water and sanitation deprivation. For health dimension, a relatively low prevalence of deprivation is associated with weak preferences of children, and not with high weight as expected by the frequency-based weight approach.9 Water and sanitation deprivation is one of the most severe (except in urban areas) but the importance given by the children to this deprivation is also one of the highest, especially for the 12-year-old children. By contrast, the negative relationship between prevalence of deprivation and weight is observed for child work dimension and shelter dimension: children attach a high importance to shelter deprivations, which is one of the less widely shared in the sample, and they give little importance to child work, which has a relatively high prevalence. Here again, it is difficult to raise conclusion from the results on education deprivation, as the inverse relationship is observed for the 12-year-old ethnic minority children and somehow for the 15-year-old children living in the rural areas but not for the other sub-groups. Hence, the inverse link between people’s judgments and frequency of deprivation may exist but there are also other factors that influence people’s valuations.
To sum up, preferences of the children are neither reflected by equal weight approach nor by frequency-based approach. Equal weight approach over-evaluates the importance of child work and health deprivation compared to children judgments, and under-evaluate shelter deprivation and water
8
The lower weight for urban 15 year-old children may be explained by the very few cases of water and sanitation deprivations (around 5% of these children are deprived in this dimension as shown by Appendix IV).
9
Health dimension is ranked second or third according to prevalence of deprivation in a declining scale, and is ranked fourth or fifth according to the level of weight.
19 and sanitation deprivation. Frequency-based approach would give too much importance to health deprivation and not enough importance to water and sanitation deprivation as regards to children preferences.
4.4. Estimates of multidimensional child poverty measurements
In order to compare further the methodology proposed in this paper that reflects the preferences of the children with the rights-based approach with equal weight, we estimate the Alkire and Foster Multidimensional Poverty Index and its components, with equal weights and with the sets of weights estimated in the previous section. We conduct this estimation for 12-year-old Kinh-Hoa children who do not belong to a religion and for 15-year-old children living in the rural and urban areas, as there constitute the three biggest groups. We also employ two deprivations as the poverty cut-off for defining poverty, the same as it was defined in MOLISA, UM and UNICEF (2008). Results are presented in Table 6.
[Table 6 here]
In general, poverty head count rates with subjective well-being derived weights are higher than under the equal weight assumption in all three groups, especially for the 15-year-old children living in the urban areas, and for the 12-year-old Kinh-Hoa children who do not belong to a religion but to a lesser extent. The difference for 12-year-old Kinh-Hoa children who do not belong to a religion is driven by the dimension of water and sanitation. This dimension is most prevalently deprived but also has the largest weight in the sub-group, and consequently it raises the prevalence of deprivations in general. More specifically, 146 out of 153 children whose status changes from non-poor to poor when the subjective well-being derived weights are used are deprived in the dimension of water and sanitation. This dimension and to a lesser extent, the dimension of shelter drive the differences in the poverty head count for the group of 15-year-old children living in the rural areas as well. Meanwhile, education dimension with its very high weight is the unique factor underlining the increase in MPI of the 15-year-old children living in the urban areas when the subjective well-being derived weights are applied. Therefore, when equal weight approach is applied, prevalence of poor children is understated mainly because of highest weights given by the children to the water and sanitation deprivation and to a lesser extent to the shelter. High preferences for education play also a key role in understating poverty but only for urban children aged 15.
20 5. Conclusion
The current paper aims at deriving a new and justifiable set of weights for dimensions in multidimensional poverty indices for children in Vietnam, by adopting a child-focus perspective, which reflects particular value judgments of children on what is a “good life”. The theoretical arguments exhibit that the association between the subjective well-being of the children and achievements of dimensions included in the multidimensional poverty indices can reveal children’s judgements on these dimensions. Weights can be subsequently derived from this association. Five dimensions of education, health, shelter, water and sanitation, and child work are included in the analysis. The selection of these dimensions follows the 2008 MOLISA, UM and UNICEF report.
To estimate the association between the subjective well-being of the children and their deprivation status in these five dimensions, we rely on both cross-sectional and panel analysis. However, limited variances of predictors for each child, and one-way changes of the deprivation status overtime increase the standard errors of estimates in the panel model with fixed effect. This is the reason for poor performance of the panel model. Consequently, cross-sectional ordered logit models are used to derive weights. In order to limit potential bias in the estimation due to unobserved heterogeneity across children, educational aspirations have been included in the estimation model as a proxy for the overall aspiration.
A first result is that children judgment about what is a “good life” changes overtime but also across different sub-groups of children. Preferences depend on the age, the religion, the ethnic belonging or the living area. At age 12, religion is the main divide in the way of ordering preferences. At age 15, differences in preferences are driven by the living areas, urban versus rural. Thus, the equal-weight implicit assumption of universality of judgment proves to be a very strong assumption. However, translating this result into policy implication can be hazardous, as it could be practically and ethically difficult to set different criteria for defining poverty across sub-groups of children.
More importantly, this paper demonstrates that the derived weights are not equal across dimensions, as far as children perspective is taken into account. Hence, using equal weight for all dimensions does not reflect the judgment of the children. Children give much less importance to the long term health deprivation, measured by the incidence of stunting, and to child work than do the rights-based approach with equal weight. By contrast, they overvalue shelter deprivation and water and sanitation deprivation, compared to the equal weight approach. Children then attach more importance to deprivations which impact immediately their well-being than to deprivations which may affect negatively their well-being in the long-term. An exception is education which is highly valued by
21 older urban children in particular.
As a consequence, the head count poverty rates for children that are calculated on the basis of the subjective well-being derived weights are larger than the ones derived on the assumption of equal weights. This result is mostly driven by the relatively high weights that children give to the dimension of water and sanitation and its high prevalence and a very high weight of the education dimension in the case of 15-year-old children living in urban areas. Therefore, using equal weight in the calculation of the Multidimensional Poverty Index leads to understate the incidence of child poverty, as compared to the children’s judgments-based approach. Policy makers need then to question the implicit assumption of the normative approach they have adopted in the way to calculate the poverty rate for children in Vietnam, as it will exclude from the poverty reduction policy children who would be poor if their own perspective is taken into account.
22
References
Alkire, S., Foster, J., (2011a). “Understandings and Misunderstandings of Multidimensional Poverty Measurement”. OPHI Working Paper No. 43, Oxford Poverty & Human Development Initiative, Oxford Department of International Development, Queen Elizabeth House (QEH), University of Oxford.
Alkire, S. and Foster, J. (2011b).“Counting and Multidimensional Poverty Measurement”, .Journal of Public
Economics, vol. 95, pp 476–487.
Alkire, S., Santos, M. E., (2010). “Acute Multidimensional Poverty: A New Index for Developing Countries”. OPHI Working Paper No. 38, Oxford Poverty & Human Development Initiative, Oxford Department of International Development, Queen Elizabeth House (QEH), University of Oxford.
Allison, P.D., (2009). “Fixed Effects Regression Models”. SAGE Series: Quantitative applications in the Social Sciences, vol.160.
Alem, Y., Köhlin, G., Stage, J. (2014). “The persistence of Subjective Poverty in Urban Ethiopia”, World
Development, 56:51-61.
Ayala, L., Jurado, A., Pérez-Mayo, J., (2011). Income Poverty and Multidimensional Deprivation: Lessons from Cross-regional Analysis”, Review of Income and Wealth, 57(1):40-60.
Baetschmann, G., Staub, K.E., Winkelmann, R., (2011). “Consistent Estimation of the Fixed Effects Ordered Logit Model”, IZA Discussion Paper 5443.
Baetschmann, G., Staub, K. E., Winkelmann, R., (2011). Consistent Estimation of the Fixed Effects Ordered Logit Model- with an application to the effect of unemployment on life satisfaction”, mimeo, University of Zurich.
Ben-Arieh, A., (2005). “Where are the children? Children’s role in measuring and monitoring their well-being”.
Social Indicators Research, 74, pp.573-596.
Bhatnagar, T., Gupta, M., (2011). “Exploring the Determinants of Subjective Well-Being: A Study of Children in India”. Department of Humanities & Social Sciences, Indian Institute of Technology, Bombay, India. Bossert, W., Chakravarty, S.R., D’Ambrosio, C., (2013). “Multidimensional Poverty and Material Deprivation with Discrete Data”, Review of Income and Wealth, 59(1):29-43.
Camfield, L., Streuli, N., Woodhead, M., (2009). “What's the Use of 'Well-Being' in Contexts of Child Poverty?
Approaches to Research, Monitoring and Children's Participation”. International Journal of Children's Rights,
17, pp.65-109.
Castilla, C., (2012). “Subjective well-being and reference – dependence: Insight from Mexico”. Journal of
Economic Inequality, 10(2), pp.219-238.
De Kruijk, H., Rutten, M., (2007). “Weighting dimensions of poverty based on people’spriorities: constructing a composite poverty index for the Maldives”. Q-Squared Working Paper, Paper 35. University of Toronto, Centre
23
for International Studies.
Decancq, K., Lugo, M. A., (2013). “Weights in Multidimensional Indices of Well-Being: an Overview”.
Econometric Reviews, vol. 32(1), pp. 7-34.
Dickerson, A., Hole, A. R., Munford, L., (2011). “A review of estimators for the fixed-effects ordered logit model”, United Kingdom Stata Users' Group Meetings, Stata Users Group.
Elster, J. (1985). Sour Grapes: studies in the subversion of rationality. Cambridge: Cambridge University Press. Fleurbaey, M., Schokkaert, E., Decancq, K., (2009). “What good is happiness?”, Université Catholique de Louvain, Center for Operations Research and Econometrics (CORE), Discussion Paper 2009/17.
Fernandes, L., Mendes, A., Teixeira, A., (2012). “A Weighted Multidimensional Index of Child Well-Being Which Incorporates Children’s Individual Perceptions”. Social Indicators Research, October 2012.
Fernandes, L., Mendes, A., Teixeira, A., (2013). “Assessing child well-being through a new multidimensional child-based weighting scheme index: an empirical estimation for Portugal”. The Journal of Socio-Economics, 45:155-174.
GSO. Result of the Vietnam Household Living Standards Surveys 2008, 2010. Statistical Publishing House. GSO and UNICEF Vietnam, (2011). Report on multidimensional child poverty in Vietnam. Vietnam. Jones, N. A., Sumner, A., (2011). “Child poverty, evidence and policy”, Policy Press: University of Bristol. Ministry of Labor, Invalids and Social Affairs (MOLISA), University of Maastricht (UM) and UNICEF Vietnam, (2008). Children in Vietnam – Who and Where are the Poor? The Development and Application of a
Multidimensional Approach to Child Poverty. Vietnam.
Plümper,T., and Troeger, V. E. (2007). “Efficient Estimation of Time-Invariant and Rarely Changing Variables in Finite Sample Panel Analyses with Unit Fixed Effects, Political Analysis, 15:124-139.
Ravallion, M. (2011). “On multidimensional indices of poverty”, Journal of Economic Inequality, 9(2): 235-248.
United Nations Development Programme (UNDP), (2011). Social Services for Human Development: Viet Nam
Human Development Report 2011. Hanoi, Vietnam.
Schokkaert, E., (2007). “Capabilities and Satisfaction with Life”, Journal of Human Development, 8(3):415-30. Schokkaert, E., Van Ootegemn L., Verhofstadt, E., (2011). “Preferences and Subjective Satisfaction: Measuring Well-being on the Job for Policy Evaluation”, CESifo Economic Studies, 57(4):683-714.
Trani, J.F., Biggeri, M. Mauro, V., (2013). “The Multidimensionality of Child Poverty: Evidence from Afghanistan”, Social Indicators Research, 112(2):391-416.
24 Table 1. Deprivation rates of selected indicators from Young Lives surveys and other national
representative surveys (%)
Indicators 12 years old (2006)
15 years old (2009)
MICS (2006) VHLSS (2008) Rate of children living in a household
without electricity
4.85 3.09 4.07 Improper flooring 17.80 13.40 21.95
Improper roofing 5.77 3.40 9.01 Rate of children living in a household
without a sanitary latrine
41.41 35.05 40.87 Rate of children living in a household
without clean water
16.67 10.49 12.92 Source: GSO and UNICEF (2011) and the authors’ calculation from Young Lives’ data R2 and R3, OC.
Table 1. Dimensions and indicators
Dimensions Indicators Deprivation cut-offs/Notes 1 Education
Children not strictly following the normal education progress in terms of age
The normal education progress is defined as children enrolled at school at age of six and complete a grade per year
Children not strictly following the normal education progress in terms of age (or not completing the lower secondary school if already left school)
See the note above
2 Health
Stunting Z-score is smaller than -2 and no flag 3 Shelter
Children living in a dwelling without electricity
Self-statement Children living in dwelling without
proper flooring
Natural/improper floor includes materials as earth, simple bamboo, palm, and other materials
Children living in dwelling without proper roofing
Natural roof includes thatch, straw, palm leaf, bamboo tree-trunk, wood and other materials 4 Water and
Sanitation
Children living in a dwelling without a hygienic sanitation facility or without a sanitation facility
Hygienic sanitation includes flush toilet, suitable and double vault compose latrine. Toilets directly over water, other facilities or no toilet are considered unhygienic.
Children not drinking safe drinking water
Drinking safe water sources include private tap water from inside and outside the house, deep drill wells, hand-dug and reinforced wells, hand-dug, non-reinforced and covered wells, protected springs, rain water and bought water.
Unsafe drinking water includes unprotected springs, small water tank, water tank, rivers, lakes and ponds and others
5 Child work
Children that have worked for an employer or in household production
Child work includes having worked for wage/salary, household production or trading or business for the household regardless of the number of hours or days worked in 12 months before the survey.
25
Source: Adapted from Table 3 and Annex 1 in MOLISA, UM and UNICEF (2008)
Table 2. Incidences of deprivations and related level of satisfaction
Dimension Round 2 (%) Round 3 (%) PP (%) Change PN (%) Change NP (%) Change NN (%) Change Education deprivation 17.0 26.6 17.1 0.8 0 9.5 -0.24 73.3 0.52 Nutrition deprivation 29.5 23.7 17.5 0.57 12.5 0.85 6.1 0.64 63.9 0.42 Shelter deprivation 19.6 14.7 12.6 0.36 7.3 1.09 2.2 1.16 77.9 0.48 Water and sanitation deprivation 45.7 36.9 32.5 0.58 13.8 0.87 4.6 -0.02 49.4 0.43 Child work 33.7 38.2 20 0.56 14.1 0.88 18.2 0.4 47.7 0.42 PP: deprived in both rounds; PN: deprived in round 2, non-deprived in round 3; NP: non-deprived in round 2, deprived in round 3; NN: non-deprived in both rounds; Change: absolute changes in the subjective well-being across rounds with the 9-step-ladder measure.
4 children with the abnormal change in the education deprivation status (from deprived to non-deprived) are dropped from the sample.
Source: the authors’ calculation from Young Lives data, R2 and R3, OC.
Table 3. Estimation results of the coefficient of the dimensions with the cross-sectional models
12-year-old with full interactions 12-year-old with significant interactions 15-year-old with full interactions 15-year-old with significant interactions (1) (2) (3) (4) Education deprivation -0.782** -0.469** -0.335 -0.403** (0.364) (0.182) (0.449) (0.177) Health deprivation -0.062 -0.282** -0.385 -0.155 (0.330) (0.142) (0.392) (0.145) Shelter deprivation -0.477 -0.897*** -0.870* -0.831*** (0.362) (0.203) (0.468) (0.231) Water and sanitation
deprivation -0.266 0.091 -0.319 -0.553*** (0.497) (0.463) (0.508) (0.162) Child work 0.078 -0.376*** -0.837** -0.283* (0.373) (0.130) (0.426) (0.145) Education deprivation*Boy 0.202 0.196 (0.379) (0.321) Education deprivation*Urban 0.546 -0.750 -0.848** (0.841) (0.506) (0.395) Education deprivation*Religion -1.436* -1.209* -0.263 (0.842) (0.685) (0.694) Education deprivation*Kinh-Hoa 0.166 -0.244 (0.379) (0.475) Health deprivation*Boy -0.412 0.355 (0.281) (0.288) Health deprivation*Urban -0.210 -0.324 (0.459) (0.397) Health deprivation*Religion -0.404 0.188 (0.871) (0.843)
26 Health deprivation*Kinh-Hoa 0.018 0.107 (0.346) (0.390) Shelter deprivation*Boy -0.127 -0.092 (0.338) (0.418) Shelter deprivation*Kinh-Hoa -0.526 0.085 (0.405) (0.491) Water and sanitation
deprivation*Boy 0.265 -0.094 (0.287) (0.293) Water and sanitation
deprivation*Religion -0.098 -0.409 (0.862) (0.672) Water and sanitation
deprivation*Kinh-Hoa -0.853* -1.093** -0.203 (0.504) (0.489) (0.516) Child work*Boy -0.359 0.009 (0.248) (0.279) Child work*Urban -0.426 -0.173 (0.375) (0.587) Child work*Religion 0.788 0.401 (0.817) (0.626) Child work*Kinh-Hoa -0.304 0.606 (0.375) (0.428) Observations 967 967 930 930 Log pseudo likelihood -1708.311 -1714.309 -1645.374 -1648.4
Pseudo R2 0.070 0.067 0.049 0.0467 Wald chi2 271.47 252.98 180.79 172.48 Prob> chi2 0 0 0 0 Values of log likelihood ratio
statistics 11.996 6.051 Number of interactions
dropped 15 16
Critical values 24.996 26.296 Robust standard errors in parentheses
*** p<0.01, ** p<0.05, * p<0.1
Three interactions of shelter and urban and religion and water and sanitation and urban which have 10 or less than are excluded.