HAL Id: lirmm-00743886
https://hal-lirmm.ccsd.cnrs.fr/lirmm-00743886
Submitted on 21 Oct 2012
HAL is a multi-disciplinary open access
archive for the deposit and dissemination of
sci-entific research documents, whether they are
pub-lished or not. The documents may come from
teaching and research institutions in France or
abroad, or from public or private research centers.
L’archive ouverte pluridisciplinaire HAL, est
destinée au dépôt et à la diffusion de documents
scientifiques de niveau recherche, publiés ou non,
émanant des établissements d’enseignement et de
recherche français ou étrangers, des laboratoires
publics ou privés.
the Evolution of Business Class Models
Abdoulkader Osman Guédi, André Miralles, Bastien Amar, Clémentine
Nebut, Marianne Huchard, Thérèse Libourel Rouge
To cite this version:
Abdoulkader Osman Guédi, André Miralles, Bastien Amar, Clémentine Nebut, Marianne Huchard, et
al.. How Relational Concept Analysis Can Help to Observe the Evolution of Business Class Models.
9th International Conference on Concept Lattices and Applications (CLA), Oct 2012, Fuengirola,
Málaga, Spain. pp.139-150. �lirmm-00743886�
Observe the Evolution of Business Class Models
A. Osman Guédi1,2,3, A. Miralles2,3, B. Amar2
,
C. Nebut3
, M. Huchard3
, and T. Libourel4
1
Université de Djibouti, Avenue Georges Clémenceau BP: 1904 Djibouti (REP)
2
Tetis/Irstea, Maison de la télédétection, 500 rue JF Breton 34093 Montpellier Cdx 5
3
LIRMM (CNRS et Univ. Montpellier), 161, rue Ada, F-34392 Montpellier Cdx 5
4
Espace Dev, Maison de la télédétection, 500 rue JF Breton 34093 Montpellier Cdx 5
Abstract. The development of information systems follows a long and complex process in which various actors are involved. We report an ex-periment in which we observe the evolution of the analysis model of an information system through 15 successive versions. We use indicators on the underlying concept lattices built by applying Relational Concept Analysis (RCA) to each version. RCA is an extension of FCA which groups entities based on characteristics they share, including links to other entities. It here helps in analyzing their evolution. From this expe-rience, we establish recommendations to monitor and verify the proper evolution of the analysis process.
Keywords: Relational Concept Analysis, Unified Modeling Language, UML, Evolution, Model analysis, Metric, Indicator
1
Introduction
In thematic domains, like environment and territories, the development of infor-mation systems often involves many actors and scientists with different (some-times opposed) viewpoints on a complex and heterogeneous knowledge. The analysis is often conducted during sessions with a different team each time, interspersed with consolidation meetings to cross-check and merge various view-points on business concepts or on subsets of UML (Unified Modeling Language) models. Methods and tools are thus welcome to accompany the evolution of systems.
To study the evolution of a system, classical model indicators can be used such as the number of elements of various kinds (classes, methods, etc). How-ever, those indicators do not reveal more complex evolutions such as the precision in the description of model elements, or the level of abstraction and factoring. We thus propose to base evolution analysis not only on classical indicators but also on indicators provided by the application of Formal and Relational Con-cept Analysis to the successive models. Indeed, Formal ConCon-cept Analysis [7] groups together similar business concepts, highlights and brings out new, more abstract, business concepts about which the scientists may not have thought,
c
Laszlo Szathmary, Uta Priss (Eds.): CLA 2012, pp. 139–150, 2012.
since the scientists are not necessarily interested in the overall model (experi-ence shows that scientists focus their analytical efforts on the parts of the model they are familiar with or that is needed for their research). Furthermore, FCA removes duplications in a systematic way, by creating new abstractions (within a robust process that leads to a unique solution). The result of the FCA process for a class model of an information system is the equivalent of a normal (non redundant) form. FCA has been used over years for this purpose [9] and is used in an iterative manner in Relational Concept Analysis (RCA [12]) to take into account the richness of the relations between classes, attributes, methods, etc. Because FCA produces a normal form, it offers a framework for comparing the successive versions of the model, disregarding the potential lack of factoring and of abstraction.
In this paper, we report such observation on the evolution of the class model of an information system through 15 successive model versions of the system. We observe a set of indicators, and establish recommendations to use those indicators to monitor and verify the proper evolution of the analysis process. The model under study, Pesticides, is described in Section 2. Section 3 explains how lattices on class models can be built thanks to RCA. In Section 4, we introduce indicators on the normal forms and we observe the evolution of those indicators on Pesticides. We position our work relatively to the literature in Section 5. Section 6 concludes the paper and gives perspectives of this work.
2
Case Study : the business model Pesticides
The project under study is called Environmental Information System for Pes-ticides (EIS-PesPes-ticides). It aims at defining an information system grouping to-gether the knowledge and the information produced by two teams: the first one (Transfer team), is specialized in the study of the transfer of pesticides to the rivers and the second one (Practice team) mainly works on the agricultural practices of farmers. UML is used to capitalize the knowledge of the themati-cians within an analysis model which will be transformed into the schema of the database. During this analysis phase, the adopted methodology consisted to archive the models after each major change. This section answers two questions: i) what was the Pesticides model "life" during the analysis phase? ii) what was the evolution of the numbers of model elements?
2.1 A brief history of the Pesticides model
We thus have 15 versions for the Pesticides model [16]. The V0 is the result of a first analysis of a set of documents and data from the Transfer Team. This V0 model is free of superclasses. The V1 version has been produced during the first analysis session with the Transfer team, where the composite design pattern has been used to organize the hydrographic entities but also those of the landscape. A model refactoring activity and a decomposition in three packages lead to the V3 : superclasses have been added and several associations have
been removed. During the next meeting, the model of agricultural activity was detailed, producing a strong increase of the number of classes and consequently the number of model elements (V4 model).
As the model on the activity of metrology was not correct, it was entirely reanalyzed in the V5 model. A copy of the corresponding package was made in order to avoid the loss of concepts, thus producing a strong increase of the model elements. The V6 model results from business concept refinement. To obtain V7, the project leader has removed the remaining concepts wrongly introduced copying the activity model of metrology, thus the model elements number has strongly decreased. The V8 model results from the assignment of a type to all the attributes, and the specification of all the features of the associations (name, cardinalities, name roles). In the V9 model, a pictogram-based language [17, 18] was introduced for spatiality (point, line and polygon) and temporality (time point and time period) notions, it has resulted in the deletion of attributes and their substitution by stereotypes. The next versions (V10 to V14) result from classical analysis : refactoring, errors corrections and specification of some non-detailed items.
2.2 Evolution of the numbers of Pesticides model elements
In this section, we analyze the quantity of the included model elements on
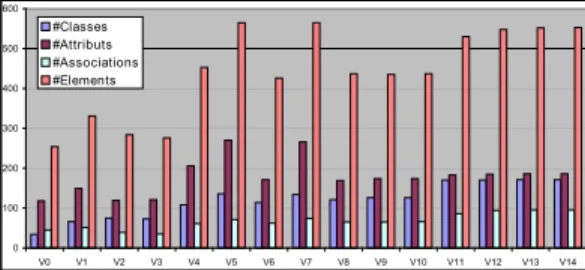
differ-ent versions of the Pesticides model. We study the number of classes (#Classes1
), attributes (#Attributes), associations (#Associations) and the total. Figure 1 shows those metrics for the 15 versions.
0 100 200 300 400 500 600 V0 V1 V2 V3 V4 V5 V6 V7 V8 V9 V10 V11 V12 V13 V14 #Classes #Attributs #Associations #Elements
Fig. 1.Evolution of the different model elements
#Classes: The number of classes globally increases (except in a few steps): from about 50 classes in V0 to more than 170 classes in V14. The increase from V0 to V3 is explained by the deepening of V0. New business concepts continue to be added up to V4, as the analysis progresses. At V5, classes are duplicated, explaining the large increase. The decreasing between V6 and V7 corresponds to the cleaning-up done by the project leader. Two stable plateaus are observed
1
from V8 to V10 and V11 to V14. The increase from V10 to V11 corresponds to a big design activity.
#Attributes: When the attribute number increases, this may indicate that business concepts are more precisely described. This is the case between V0 and V1. The introduction of superclasses (more general business concepts) in V2 may explain the decrease of the attribute number, because redundancies may have been removed. Large increase from V4 to V5 may be explained by the duplication of a package and decrease between V6 and V7 by the cleaning-up activity. From V10 to V11, a very slight increase indicates that actors have added some precision on the existing business concepts.
#Associations: This metric is an indicator of the relational description of the business concepts. A slight decrease is observed for the very first versions (V0 to V3) followed by a moderate growth in recent versions of the model. This reflects two work phases. In the first, the trainee model was completely restruc-tured, and the decrease may be explained by the introduction of superclasses. Associations may have been factored out on those superclasses. Then, new points of view brought by the different actors may explain the growth.
3
Relational Concept Analysis and model normalization
Like FCA [10], the RCA framework can be used to produce normal forms for UML models that eliminate redundant descriptions, add all the implicit special-ization relationships and highlight relevant abstractions. Such a normalspecial-ization can be seen as the transposition of the normalization step [4] used for the de-sign of relational databases. We illustrate these characteristics on the model of Figure 2 which contains attribute redundancies (e.g. Device Type) and associa-tions which deserve to be generalized (e.g. Groundwater Instrumentation and Rainfall Instrumentation). An FCA approach applied to such a UML model would, for example, describe the classes by their attributes names, the associa-tions by their roles names and attributes by their type name. The description is given in the form of binary tables called formal contexts. The result of FCA is a lattice of concepts: the entities taken into account in the formal context are grouped according to the properties they share. The discovered groups of entities sharing properties are called concepts. Concepts are formed by maxi-mal sets of entities (the extent of the concept) sharing maximaxi-mal sets of common properties (the intent of the concept). They are organized in a classification with a lattice structure. The obtained lattice enables to find higher level superclasses like Measuring Device which factorizes the attribute Device Type. But new discovered abstractions (e.g. on classes) cannot be exploited to discover other abstractions (e.g. on associations, etc.).
To go beyond, RCA extends FCA on a context family. This family, com-posed of formal contexts and relational contexts, is called Relational Context Family (RCF). RCA iterates on the RCF and builds several lattices, one for
each context representing a model entity2
, that are then used to normalize the UML model. The normal form for the Measuring station model is shown in Figure 3. As the relational contexts encode the relationships between the various entities, we use them in particular to formalize (through roles) the UML notion of association between classes. The iterative procedure of RCA first finds the class Measuring Device (given by the expert), then the role of type Measuring Device (Devices), and later the association Instrumentation (named by the expert) which generalizes the associations Groundwater Instrumentation and Rainfall Instrumentation. Due to the cardinality of the new association, the semantics of the model is changed. We should add an OCL constraint to allow only one instance of Rain Gauge and one instance of Piezometer. In this work, we use the lattices that are at the origin of these normal forms as a framework to better compare models and understand their evolution.
Station 0..1 Device Groundwater Instrumentation Measuring Station Rain Gauge
Administrative Institute : string Station Name : string
Tube High : real Device Number : integer Device Type : string Piezometer
Tube Diameter : real Device Number : integer Device Type : string
Station 1 0..1 Device 1 Instrumentation Rainfall
Fig. 2.Extract of the measuring station model
Station Instrumentation Devices 0..2 Measuring Device Rain Gauge Piezometer
Device Number : integer Device Type : string Measuring Station
Administrative Institute : string Station Name : string
Tube High : real Tube Diameter : real
1
Fig. 3.Refactored model of the Measuring station model (see Fig. 2)
4
Evolution through the indicators on the lattices
4.1 Studied RCA configurations
We denote RCA configuration the choice of the elements, the features and the relations that have to be taken into account to produce the normal form. We here consider two configurations C1 and C2 composed of relations between the main modeling elements including classes, attributes and associations. In UML,
navigability is a notion that applies to an association R ⊆ Csource×Ctarget. If R is
2
The contexts and lattices of this example are presented at the URL: http://www2. lirmm.fr/~huchard/Documents/Papiers/RCA_Pesticide_model_example.pdf
navigable from Csourceto Ctarget, this means that from an object of Csource, you
can reach (or query, or send a message to) an object of Ctarget. Furthermore, in
our current analysis we select only the roles that are named because they have a stronger semantics. In the two defined configurations, the formal contexts only describe the modeling elements with their names. To preserve inheritance relationships, classes are also described by the names of their superclasses.
The RCA configuration C1 comprises the following elements: classes, at-tributes, operations, associations and roles (described by their names). The
rela-tional contexts of the RCF are as follows: owns1⊆classes×attributes, owns2⊆
classes × operations, owns3⊆classes × roles, owns4⊆Associations × roles.
The RCA configuration C2 extends the previous one by adding a fifth relation
hasT ype5⊆roles × classes. This configuration leads to much more complex
lat-tices. After several experiments, we observed that the better informative results
are obtained at step 5, probably due to the structure of the UML meta-model3
. Our experiments on the complete process (beyond step 5) are very difficult to interpret. It would be interesting to study this point.
As support tools for our experiments, we developed an UML profile in
Ob-jecteering4
, that makes use of the framework eRCA (Eclipse Relational Concept
Analysis)5
for the lattice construction. We applied the two RCA configurations on the 15 versions of the model Pesticides.
4.2 Lattice indicators evolution
In this section, we follow the evolution of Pesticides with information extracted from lattices used as a normalization framework. For each considered kind of UML model elements, we computed the following indicators to evaluate the unicity of concepts within the model and the increase in new abstract concepts: 1. The ratio of Merged concepts: #Merge/#Model Elements. Merged concepts have a proper extent that contains more than one element. They merge several formal objects which have the same description. Note that proper extents contain elements not present in the extent of sub-concepts.
2. The ratio of the New concepts: #New/#Model Elements. New concepts are the concepts whose proper extent is empty. They correspond to the factorization of formal attributes and no formal object is described exactly by their formal attribute set.
We report only the analyses on classes attributes and associations because the number of operations is small and roles behave more or less like associations. The indicators have been computed on lattices at the end of each RCA step for the 15 versions. Visually, the lattices of each version become more complex and indicators help us to go into a detailed analysis.
3
To navigate from a class to another one via associations, five model elements are crossed: Class, EndAssociation, Association, EndAssociation and Class.
4
http://www.objecteering.com/
5
0% 2% 4% 6% 8% 10% 12% 14% 16% V0 V1 V2 V3 V4 V5 V6 V7 V8 V9 V10 V11 V12 V13 V14 Fig. 4.C1-C2: #Merge/#Classes Indicators on Classes
#Merge/#Classes: This indicator counts the number of Merged concepts in the class lattice and compares it to the class number in the model. These concepts group classes with same name and same description. This indicator has the same value in all the RCA steps in the two chosen configurations. In Figure 4, we observe two peaks in V5 and V6 while, for other versions, the indicator is low. Those peaks come from the existence of duplicated classes, e.g. in V5 we have three classes called Active ingredient that have the same attributes. Indeed, in V5 and V6, a package was duplicated during a working session. For versions V0, V1, V2, V9 and V10, we do not observe merged concepts: each class owns something that the others do not own. The more the ratio is high, the more we have identical classes. This ratio should alert the designer on the versions where it is high, especially if it does not decrease in the following versions. It is very different from the case where we add many classes.
#New/#Classes: This indicator counts the number of New concepts in the class lattice relatively to the class number in the model. The new concepts cor-respond to new class abstractions that would be needed to factorize the similar characteristics of the existing classes. The ratio differs for the two configurations and changes during the RCA steps. It reflects the missing factorizations rate. In the case of C1 (Fig. 5), we notice a progressive decrease although the class number increases. The evolution suggests that even if there are more and more classes, the abstraction level of the model improves. This is confirmed by the fact that the project leader regularly factorized attributes and associations on new added superclasses. The duplication done in V5-V6 degrades the abstrac-tion level: the ratio increases in these steps. This suggests that in the duplicated classes there were missing factorizations.
Analyzing Figure 6 (step 5), we notice peaks suggesting a lack of factoriza-tion in V4, V5, V6 and V13, V14. In V4, this is explained by the addifactoriza-tion of many classes that lack factorization (also visible in C1, but more evident here because of the inclusion of more information in the configuration). In V5 and V6, this is the effect of the package duplication. In V13, associations have been added, and the project leader a posteriori judges that they introduced missing class factorization. Reversely, a significant fall is observed between V1 and V2,
0% 10% 20% 30% 40% 50% 60% V0 V1 V2 V3 V4 V5 V6 V7 V8 V9 V10 V11 V12 V13 V14 Fig. 5.C1: #New/#Classes 52% 53% 54% 55% 56% 57% 58% 59% 60% 61% 62% 63% V0 V1 V2 V3 V4 V5 V6 V7 V8 V9 V10 V11 V12 V13 V14
Fig. 6. C2-step 5: #New Con-cepts/#Classes
due to the refactoring of many associations inserted in the first version by the trainee. When the model is improved on the factorization of classes (resp. asso-ciations), the ratio should decrease in C1 (resp. in C2-step5). When it increases, the designer should be warned and (s)he should consider looking at duplications in attributes and associations that (s)he should factorize in relevant superclasses. Indicators on Attributes
#Merge/#Attributes: This metric gives the ratio of Merged attribute con-cepts in the attribute lattice relatively to the attribute number (Fig. 7). These concepts group attributes with same name (in a model, this often corresponds to redundant attributes). A general decreasing tendency is observed, revealing less attribute redundancy and confirming that factorization has been improved. The ratio remains low. Peaks in V1 to V3 correspond to important additions of attributes with similar names. The peak at versions V5 and V6 corresponds to the mentioned package duplication. After V7, the attribute number slightly increases, but the ratio decreases, thus the attributes that are introduced do not introduce redundancy because either these are new properties or the designer improves the model by removing the repetition of property names.
0% 5% 10% 15% 20% 25% V0 V1 V2 V3 V4 V5 V6 V7 V8 V9V10V11V12V13V14 Fig. 7.C1-C2: Merge/Attributes 0,00% 0,50% 1,00% 1,50% 2,00% 2,50% 3,00% V0 V1 V2 V3 V4 V5 V6 V7 V8 V9 V10 V11 V12 V13 V14 Fig. 8.C1-C2: New/Attributes
#New/#Attributes: This ratio expresses the proportion of new attribute con-cepts relatively to the attributes (Fig. 8). With the chosen configurations (C1 and C2), there are no new concepts in the attribute lattice. However, attributes participate massively in the creation of new class and association abstractions. Indicators on Associations
#Merge/#Associations: This ratio gives the number of Merged association concepts relatively to the number of associations (Fig. 9). When decreasing ten-dencies are observed, the designer confirmed that the model was improved by association and role factorization. In V0 and V1 which not contain superclasses and V5 and V6 where a lot of associations are duplicated, the ratio of merged concepts is high because the factorization level is low.
0% 2% 4% 6% 8% 10% 12% 14% 16% 18% 20% V0 V1 V2 V3 V4 V5 V6 V7 V8 V9 V10 V11 V12 V13 V14 Fig. 9.C1-C2: #Merge/#Associations 0% 5% 10% 15% 20% 25% 30% V0 V1 V2 V3 V4 V5 V6 V7 V8 V9 V10 V11 V12 V13 V14 Fig. 10.C1: #New/#Associations 40% 42% 44% 46% 48% 50% 52% 54% V0 V1 V2 V3 V4 V5 V6 V7 V8 V9 V10 V11 V12 V13 V14 Fig. 11. C2-step 5: #New/#Associations
#New/#Associations: This ratio gives the number of New association con-cepts relatively to the number of associations. It expresses the potentially missing
abstractions of associations. For C1 (Fig. 10), the global tendency in versions V0-V9 is decreasing, suggesting that factorization improves. At the end, it slightly grows, and analyzing the models, we noticed that the added associations needed factorization. For C2 (Fig. 11), we notice that V1 lacks many class factorizations, and comparatively not so many association factorizations. Actually, V1 version is a rather chaotic transition from the trainee model to the current model. From V2 to V4, there are very few associations, and classes and associations behave differently. They do not much influence each other. After V7, classes and associ-ations have the same behavior, indicating a needed factorization growing at the end (V13 and V14).
4.3 Discussion
The evolution of the data encapsulation level is highlighted by the evolution of the number of classes. The evolution of attribute number might indicate the level of completion of the model. The relational aspect is shown by the evolution of the numbers of roles and associations. But these numbers of elements cannot indicate if we really completed the model or if we have introduced duplication and redundancies. This is where lattice-based indicators help. By comparing the results of indicators and the known "life" of the model, we can draw advice. The evolution of the number of merged concepts indicates if identical or badly described model elements have been introduced into a version. The evolution of new concept numbers gives a measure of the increasing of the abstraction level of the model or its degradation. The new class and association concepts also indicate the effort needed to reach a normalized model, by computing the number of abstractions necessary to factorize the entities.
5
Related Work
Several well known software metrics have been proposed for measuring the qual-ity of inheritance [3, 15]. For example, DIT [3] measures the length of a longest path from the root to a leaf of the inheritance tree; NRM [15] counts the number of overridden methods (not inherited, not specialized). High inheritance use and overriding correspond to an increasing complexity, but also to an improvement of the abstraction level and of the opportunity to reuse methods and attributes in subclasses. Empirical evaluations [2, 11] of these metrics assess if they can predict faults in software. Here, we are not interested in detecting faults but in following the construction of a class model covering a domain. Counting the main modeling elements gives indications about the degree of reification of the model and the degree of completion of the model. Indicators built using the lattices assess the degree of reification, but more deeply analyze the abstraction level of reified entities, their structuring and their description.
In [5], the proposed metrics measure the quality of factoring in inheritance hi-erarchies by reference to an ideally factorized hierarchy obtained by constructing a Galois subhierarchy on flattened class description. Here, we observe identified
categories of concepts in lattices (Merged and New concepts) because they are immediately understandable by the expert, who can exploit the resulting con-cepts to build new classes or associations in his/her model.
Software metrics are included in frameworks dedicated to software evolution analysis. In [14], an evolution matrix of classes is proposed. The size of classes (in LOC) is represented by a variable-size box representing the class in a specific version. Main evolution phases emerge (growth, stabilization, etc.) and specific behavior of classes (e. g. permanently large classes) are highlighted. Pingzer et al. [21] use Kiviat diagrams for visualizing metrics through several releases.
Other approaches use information on the releases [6], or on basic changes or code churns [20]. In [13], authors propose a meta-heuristic-based approach for determining an editing distance of minimal cost between two successive versions of a class model. This distance counts the design changes between the versions and is compared with traditional metrics for predicting defects. Here we want to understand evolution and identify its main phases. We use information on the model elements, and on the lattices to alert the designer on the lack of details or the lack of abstraction of the model. In the database domain, several approaches have been proposed for managing the evolution of object-oriented database schema [1, 19, 22]. They mainly define the operations used for schema evolution. An evolution combines a set of primitive evolution operations as well as global rules used for validating or invalidating the evolution. Here we propose a set of indicators for observing and understanding the evolution. We interpret results w.r.t. the known evolution history and we establish recommendations.
6
Conclusion and perspectives
In this paper, we presented an observation of the evolution of the business class model of an information system. Metrics on model elements and indicators on the lattices generated with RCA are systematically computed on the 15 versions of Pesticides model. The results of these metrics and indicators offer to the model designer a dashboard that can be used to monitor the process of analysis of its information system. Indicators based on RCA give a normalization framework for the monitoring, highlighting aspects of the evolution that are not captured by the model metrics. The observation of the evolution of the analysis process on 15 versions of the Pesticides model allowed recommendations to be extracted, that are confirmed by the story of the model.
As future work, we will implement traceability links to better monitor and understand the evolution of business concepts in the analysis process to help the designer. Beyond the evolution analysis, and following tracks of previous work, we would like to better control the new concepts that emerge from RCA to build a normalized UML model.
References
1. Banerjee, J., Kim, W., Kim, H.J., Korth, H.F.: Semantics and implementation of schema evolution in object-oriented databases. In: SIGMOD Conference. pp.
311–322. ACM Press (1987)
2. Briand, L.C., Morasca, S., Basili, V.: Property-based software engineering mea-surement. Transactions on Software Engineering 22(1), 68–86 (1996)
3. Chidamber, S.R., Kemerer, C.F.: A metrics suite for object oriented design. IEEE Transactions on Software Engineering 20(6), 476–493 (Jun 1994)
4. Codd, E.F.: A relational model for large shared data banks. In: Comm. of ACM 13(6) (1970)
5. Dao, M., Huchard, M., Libourel, T., Roume, C., Leblanc, H.: A new approach to factorization - introducing metrics. In: IEEE METRICS. pp. 227–236. IEEE Computer Society (2002)
6. Gall, H., Jazayeri, M., Riva, C.: Visualizing software release histories: The use of color and third dimension. In: ICSM. pp. 99–108 (1999)
7. Ganter, B., Wille, R.: Formal Concept Analysis, Mathematical Foundations. Sprin-ger-Verlag (1999)
8. Ganter, B., Stumme, G., Wille, R. (eds.): Formal Concept Analysis, Foundations and Applications, Lecture Notes in Computer Science, vol. 3626. Springer (2005) 9. Godin, R., Mili, H.: Building and maintaining analysis-level class hierarchies using
galois lattices. In: OOPSLA. pp. 394–410 (1993)
10. Godin, R., Valtchev, P.: Formal concept analysis-based class hierarchy design in object-oriented software development. In: Ganter et al. [8], pp. 304–323
11. Gyimóthy, T., Ferenc, R., Siket, I.: Empirical validation of object-oriented metrics on open source software for fault prediction. IEEE Trans. Software Eng. 31(10), 897–910 (2005)
12. Huchard, M., Hacene, M.R., Roume, C., Valtchev, P.: Relational concept discovery in structured datasets. Ann. Math. Artif. Intell. 49(1-4), 39–76 (2007)
13. Kpodjedo, S., Ricca, F., Galinier, P., Guéhéneuc, Y.G., Antoniol, G.: Design evo-lution metrics for defect prediction in object oriented systems. Empirical Software Engineering 16(1), 141–175 (2011)
14. Lanza, M., Ducasse, S.: Understanding software evolution using a combination of software visualization and software metrics. L’OBJET 8(1-2), 135–149 (2002) 15. Lorenz, M., Kidd, J.: Object-Oriented Software Metrics: A Practical Guide.
Prentice-Hall (1994)
16. Miralles, A., Pinet, F., Carluer, N., Vernier, F., Bimonte, S., Lauvernet, C., Gouy, V.: EIS Pesticides: an information system for data and knowledge capitalization and analysis. In: Euraqua-PEER Scientific Conference, 26/10/2011 - 28/10/2011. p. 1. Montpellier, FRA (2011)
17. Miralles, A., Libourel, T.: A new methodology to automate the transformation of gis models in an iterative development process. In: Advances in Modelling Agri-cultural Systems, vol. 25, pp. 19–36. Springer (2009)
18. Miralles, A., Pinet, F., Bédard, Y.: Describing spatio-temporal phenomena for environmental system development: An overview of today’s needs and solutions. International Journal of Agricultural and Environmental Information Systems 1(2), 64–84 (2010)
19. Monk, S., Sc, S.M.B.: A model for schema evolution in object-oriented database systems. (1993)
20. Nagappan, N., Ball, T.: Use of relative code churn measures to predict system defect density. In: ICSE. pp. 284–292. ACM (2005)
21. Pinzger, M., Gall, H., Fischer, M., Lanza, M.: Visualizing multiple evolution met-rics. In: SOFTVIS. pp. 67–75. ACM (2005)
22. Skarra, A.H., Zdonik, S.B.: The management of changing types in an object-oriented database. In: OOPSLA (1986)