HAL Id: halshs-00282391
https://halshs.archives-ouvertes.fr/halshs-00282391
Submitted on 29 May 2008HAL is a multi-disciplinary open access archive for the deposit and dissemination of sci-entific research documents, whether they are
pub-L’archive ouverte pluridisciplinaire HAL, est destinée au dépôt et à la diffusion de documents scientifiques de niveau recherche, publiés ou non,
Top management adoption of a locally driven
performance measurement and evaluation system: A
social network perspective.
Bertrand Masquefa
To cite this version:
Bertrand Masquefa. Top management adoption of a locally driven performance measurement and evaluation system: A social network perspective.. Management Accounting Research, Elsevier, 2008, 19, pp.182-207. �halshs-00282391�
Title: Top management adoption of a locally driven performance measurement and evaluation system: A social network perspective.
Author: Bertrand Masquefa1
Affiliation: University of Nice Sophia Antipolis, GREDEG–CNRS Institut d´Administration des Entreprises de Nice
Avenue Emile Henriot
06050 Nice Cedex
FRANCE
Address: Proofs should be sent to: Bertrand Masquefa IUT de NICE Département GEA
41 Boulevard Napoleón III 06206 NICE CEDEX 3 Telephone: (33) 497258234 Fax: (33) 497258329
E-mail address: Bertrand.MASQUEFA@unice.fr
Abstract: This paper traces the adoption process by top management of a performance evaluation system initiated by the financial controllers at the Research and Development site of leading multinational company. The research puts forward that the success of the change efforts depends on the nature of relationships among the organizational members involved in the process. Because performance measurement and evaluation systems have notoriety for being controversial, the notion of trust, operationalized through strong ties, emerged as pivotal to reduce uncertainty during the change process and facilitate the introduction of the performance evaluation system. The research also points out that the structural position of financial controllers within organizational networks is an important aspect in the success/failure of implementing such problematic control systems. Also, the social network analysis used in this paper has proved to be a useful methodology for studying the relational patterns that occurred during the change process.
Keywords: performance measurement and evaluation system; resistance to change; trust; social networks analysis.
1. Introduction
This article traces the adoption2 process by top management of a performance measurement and evaluation system initiated by the financial controllers at the Research and Development site of a leading multinational company. The aim of introducing the new system was to penetrate operational layers and gain more visibility and control over the software development cycle (e.g. Tuomela, 2005). Such endeavors threaten operational members, as they dissipate local islands of power and open up a new realm for financial controllers in operational units. These processes are often characterized as controversial3 (Vaivio, 2004) whereby local agents mobilize their power to jeopardize the implementation of such initiatives (Scapens and Roberts, 1993; Kasurinen, 2002). Conflict may arise between financial controllers and operational members/units and may become exacerbated when operational members perceive financial controllers in their narrow and traditional role, isolated from organizational realities. In these instances, the lack of an anchor point – personal ties – in operational units may affect the ability to introduce performance measurement and evaluation systems. Notwithstanding, as the role of financial controllers becomes deeper rooted in operational areas, they are more likely to develop strong relationships with their operational counterparts, allowing trust to emerge and facilitating change.
In an early study of seven firms in the electronics sector, Innes and Mitchell (1990) suggested that when management accountants work closely, as part of a team with other 1 Current/permanent address: IUT de NICE, Département GEA, 41 Boulevard Napoleón III, 06206 NICE
CEDEX 3, FRANCE.
2 Perera et al. (2003) argue that the diffusion of innovations (e.g. transfer pricing) occurs in a two-step process. The implementation process goes through a primary stage, top management adoption, followed by a secondary stage, the acceptance by organizational actors. Although the primary stage of “mandated” changes by top management seems trivial in nature (see Perera et al., 2003), the present study argues that the primary stage is rather tedious and unpredictable for “emergent” and “controversial” processes (see Burns and Vaivio, 2001). Following Perera et al. (2003) terminology, the research undertaken here is an account of the primary stage or “top management adoption” of the implementation process.
3
According to Sulaiman and Mitchell (2005, p. 433-434) the introduction of new management accounting techniques, such as a performance measurement and evaluation system, can be seen as problematic.
technical experts and line managers, the latter recognized and appreciated the management accountants’ contribution. The management accountants’ new role resulted in an improved relationship between management accountants and others (Innes and Mitchell 1990, p. 15). The authors also observed that in one of the electronic firms (Firm E), once dominated by engineers, management accountants became more constructive and actively participated in the introduction of one new technique to replace another. As a consequence, the structural position of management accountants moved away from being purely isolated to becoming more centrally located in the organizational network. Although not explicitly mentioned in their study, the increasing interactions resulted in a closer relationship between management accountants and technical experts that allowed trust to develop. In this case, management accountants became proactive and facilitated the introduction of a new performance evaluation technique. Quite different observations were found by Scapens and Roberts (1993) during the introduction of a control system. These authors emphasized that the complex web of social processes involved in the process of change inadvertently created conditions that defeated the content of the change. They found that mistrust between production unit managers and financial controllers created conditions for resistance to change and resulted in a contest of power that inevitably led to failure. They pointed out that the project team – financial controllers – lacked a detailed knowledge of the company’s operations and the network of contacts within operating units. The limited amount of interactions between operational managers and financial controllers created propitious ground for a hostile environment to develop and to compromise the implementation of the control system.
In a story of the successfull introduction of performance measurement and evaluation systems, Cobb et al. (1995) described the process of establishing greater accountability for divisional managers of a multinational bank. They found that continuing dialogue between managers and financial controllers and much greater informal contact between them were important features of the change process. During the process, the nature of the financial controllers’ activity evolved. At the beginning of the study, there was little interaction between the financial controllers and the managers of other areas of the division. However,
mix of financial and managerial tasks. Managers increasingly valued the contribution of the financial controllers. As a result, the structural position of the latter became more central within organizational networks and consequently the “boundary of management accounting expanded into the operational realm” (Cobb et al., 1995, p. 171).
In an account of failure to introduce a performance measurement and evaluation system, Kasurinen (2002) described how a project to introduce a balanced scorecard actually resulted in the implementation of a cockpit type of scorecard. The system implemented was not that intended because of the resistance to change between organizational members and more particularly the mistrust between engineers and managers. Kasurinen (2002) noted that “increasing visibility to divisional management and the fears that a ‘divisionally designed’ system would not meet the local needs of the case unit had an influence on the case project, … the ‘engineering culture’ tended to weaken the role of strategies and strengthen the role of diagnostic measurement in the case organization” (Kasurinen, 2002, p. 337).
In an empirical study, Emsley (2005) related the nature of management accountants’ activities and the likelihood of success of the introduction of management accounting systems, such as performance measurement and evaluation systems. He found that management accountants who work with operational members have greater success in introducing performance measurement and evaluation systems. The author noted that management accountants, with a business unit orientation, spend lengthy periods of time within operational units and have a greater mutual understanding of and empathy towards the information needs of operational managers. Through a high level of interactions, they learn from each other and develop closer relationships, thereby reducing the perceived uncertainty of business unit managers about the benefits of any innovations. As such, management accountants with a business unit orientation develop a trusted relationship with business unit managers, thus reducing resistance to the introduction process and facilitating the implementation of more radical accounting systems (Emsley, 2005, p. 163). The above studies suggest that the introduction of performance measurement and evaluation systems is an idiosyncratic process in which a myriad of interactions emerges among organizational actors, mainly financial controllers and others. The social context –
i.e. the nature of interpersonal ties – plays an important role in the introduction of performance measurement and evaluation systems. The present study claims that the success of financial controllers in implementing performance measurement and evaluation systems depends on the nature of the relationships among the organizational actors involved in the change process and that financial controllers’ reputation for conservatism is, to some extent, related to their position within operational networks. For instance, a controversial process may be perceived as less controversial when financial controllers develop and maintain strong interdependencies as their role becomes more constructive. Consequently, resistance to change can be reduced and performance measurement and evaluation systems are more likely to be introduced. Trust is a facilitating interface in such processes. On the other hand, when financial controllers are involved in a more traditionally oriented role – i.e. when they interact mainly among themselves in dense networks of strong ties (e.g. the finance division) – they remain isolated from the rest of the organization, resulting in a climate of mistrust with other organizational members/units. Therefore, the implementation of a performance measurement and evaluation system would more likely lead to failure or suboptimal solutions for financial controllers because the system implemented would clearly be inferior to the financial controllers´ expectation. This research also involves the concept of networks, which has been scarcely debated in the literature on the implementation of performance measurement and evaluation systems. However, it has recently gained importance in the literature on management accounting and inter-firm relations. The study draws on certain concepts developed at the inter-firm level and then relates them to the intra-firm level. Networks4 have arisen from the need to gain access to resources in addition to those provided internally to compete more successfully in a highly turbulent and competitive environment (Borgatti, 2003; Mouritsen et al., 2006). The basic feature of network coordination is interaction, in which units in the networks
4
Some of the concerns addressed at the inter-firm level also apply at the firm level. Coordination forms at the firm level can be thought of as a continuum, with hierarchies at one end of the spectrum and networks at the other. Networks within organizations share some of the same development characteristics as inter-firm networks. Networks have arisen out of the inadequacy of
interactively seek a suitable solution (Håkansson and Lind, 2004). Network coordination is more efficient when activities are dissimilar but closely complementary and need to be performed by two or more companies (Richardson, 1972; Williamson, 1975, 1985). Network coordination may involve the sharing of joint decision-making in areas such as strategic planning and new product/process development, and may entail joint investments in relation-specific assets. These relationships may encompass a great deal of uncertainty and risk for both parties owing to difficulties in gaining cooperation with partners with different objectives (Langfield-Smith and Smith, 2003).
One stream of research in management accounting has been the study of forms of control in organization networks. Appropriate governance structures include traditional management control systems (Ouchi, 1979, 1980), but also the increasing importance of trust as a new control mechanism (Van der Meer-Kooistra and Vosselman, 2000). However, the issue of trust remains a much-debated question. For some, trust is considered as a substitute for formal control mechanisms, while for others it is complementary. Tomkins (2001) and Seal et al. (2004) claim that accounting is beneficial in building trust, while Dekker (2004) and Van der Meer-Kooistra and Vosselman (2000) see control mechanisms as detrimental in specific uncertain situations and view trust as a substitute for control mechanisms. Nevertheless, trust has been shown to decrease the risk of inadequate behavior (Langfield-Smith and (Langfield-Smith, 2003; Tomkins, 2001), to avoid failure (Das and Teng, 2001; Speklé, 2001) and to reduce the level of opportunism (Granovetter, 1985; Van der Meer-Kooistra and Vosselman, 2000).
In inter-firms relations, trust develops through strong interdependencies that take time to build (Gulati 1995). Strong ties are time-consuming to develop and maintain (Granovetter, 1973, 1982), so that inter-organizational arrangements can be conceptualized as “loosely coupled organizations having a core of strong and weak ties” (Imai and Baba, 1989). Strong ties serve as a basis for social control mechanisms and weak ties transmit novel information (Rowley et al., 2000). Strong ties involve trust and the exchange of fine-grained information between partners. Weak ties are infrequent contacts that, because they are episodic, do not necessarily have affective content (Nelson, 1989). However, weak ties can reach a large number of people and traverse greater social distances than strong ties because
they are more likely to link members of different small groups and provide people with access to information and resources beyond those available in their own social circles.5 Therefore, weak ties propagate ideas, rumors, etc., faster than strong ties because they provide a link between cliques that greatly accelerates the penetration of ideas. On the other hand, strong ties tend to be concentrated within cliques, provide greater motivation to be of assistance and are more likely to be useful when there is insecurity (Granovetter, 1982). Therefore, it would be expected that weak and strong ties can play a complementary role. On one hand, weak ties, namely acquaintances, could constitute a preferred conduit to propagate performance measurement and evaluation systems to distant organizational locations when uncertainty is low,6 i.e. when operational members are in favor of introducing the system. However, since the implementation of a performance measurement and evaluation system may be controversial, it is likely to meet resistance to change. In such circumstances, advocates and detractors will mobilize their personal network of strong ties to implement or oppose the change. “Trust” can therefore be thought of as a facilitating interface during the introduction of problematic systems. Strong ties are more suitable for coping with the resulting uncertainty and overcoming resistance to change.
2. Case setting
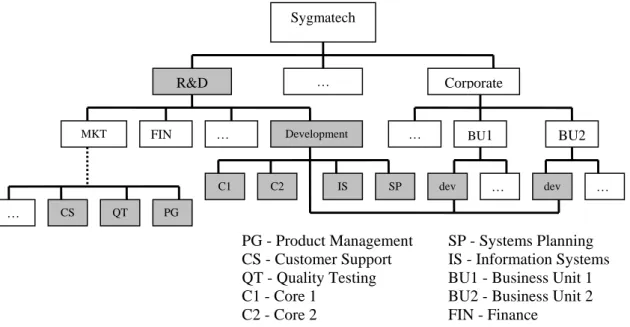
The study took place in the R&D site of Sygmatech (fictitious name), situated in the telecom valley of Southern France. It employed a staff of approximately 1600 mainly involved in two activities: developing new software and maintaining existing packages. The scope of the project involved the entire Development Function, composed of the Core 1, Core 2, Systems Planning and Information Systems development divisions, and also three marketing divisions that were closely related to development activities (Product
5
See Granovetter (1973) for a thorough development of this argument.
6
Lewis and Weigert (1985) noted that when actions are undertaken with complete certainty, there is no need or possibility for trust to develop.
Specifications, Quality Testing, Product Documentation) and the development divisions of two strategic business units7 (see Figure 1).
<Insert figure 1 here>
A long tradition of freedom in terms of controlling8 activities persisted at the R&D site. Directors and managers of the development divisions at the R&D site interfered with the activities of financial controllers, making business cases look good and giving themselves leeway in resource allocation. Budgets were largely used for ceremonial purposes and were not integrated into management practices.
Also, the effect of forthcoming industry deregulation coupled with a lack of financial control over R&D activities (i.e. limited visibility of R&D spending) meant that top executives were concerned about cost consciousness and business competitiveness. The efficiency and effectiveness of R&D activities became a priority, in particular the cost of developing new software. In fact, development divisions´ directors at the R&D site were unable to give precise cost figures because the information provided by the current system was static and vertical by nature9. Therefore, the objective of the Financial Controlling Manager (Controller 1) was to implement a performance measurement and evaluation
7
Product Specifications, Quality Testing and Product Documentation divisions worked in the upstream and downstream process of new product development. Most employees were development engineers and worked closely with development divisions. For simplicity, the three marketing divisions were considered as development divisions.
8
At the French site, financial controllers had a functional orientation with little legitimacy in the company. The financial controllers´ main activity was the budgeting process. The R&D site was divided into cost centers. Reports were prepared by the financial controllers, on such items as labor, software & hardware, travel expenses etc., and sent to the directors of the development divisions and to the Vice President of Development who was also General Manager of the French R&D site.
9
Systems Planning development engineers of the R&D site had recently implemented a system, adapted from the New Project Management approach (from the Project Management Institute), to manage new product development. One difficulty was that the New Project Management approach helped managing new projects in terms of phases (proposal, concept and planning, construction, acceptance, transition, etc.) but not in terms of managing the activities of the software development cycle process (i.e. requirement analysis, coding, testing, etc.). Moreover, the process activities overlapped various NPM phases.
system for the software development cycle. Such a process view would give better visibility to the process of developing new software.
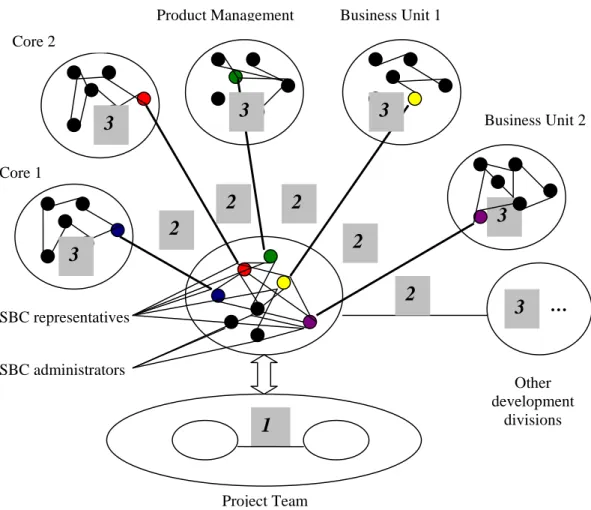
The change required significant modification of the current SBC system (Sygmatech Budget Control system), a legacy system that was designed in-house. The SBC representatives (table 1) were formal representatives from each development divisions of the French R&D site. They were responsible for the SBC system and authorized any changes to it.
<Insert table 1 here>
They formed a committee that met every six weeks at the SBC representatives meeting. The committee had three system administrators (Administrators 1, 2 and 3) who worked full time on developing, maintaining and updating the SBC system. SBC representatives were responsible for communicating any change in the SBC system within their development divisions (see figure 2).
<Insert figure 2 here>
SBC representatives acted as formal communication channels, or boundary-spanning individuals, between the SBC system and the development divisions of the French R&D site.
2.1. The grounding phase
Controller 1 initiated the primary stage, i.e., “top management adoption” of the implementation process by presenting the project to the Cost Study Manager from the Systems Planning Development division who had worked at the company for 12 years (see table 1). This lateral move, involving another senior manager with good knowledge of the company’s political landscape, provided Controller 1 with positive feedback on the project
[About the project proposal] “The idea is coherent…there is an actual need for it. I
recommend that you look for the support of Engineer 1 – a Manager of the Systems Planning Development division and Engineer 2, one of Engineer´s 1 subordinates. Both participated in implementing the New Project Management project… Don´t go and see the Executive Vice President of Development without their consent.” (Cost Study
Manager in a formal meeting with Controller 1 and the researcher)
The Cost Study Manager also warned Controller 1 of potential threats and obstacles involving people’s perceptions of and reactions to the project:
“From the company’s culture, you are running a risk of bumping into a window. It took five years to implement the SBC system.” (Cost Study Manager in a formal meeting
with Controller 1 and the researcher)
The difficulties of the implementation of the SBC system were recalled by several Sygmatech´s managers:
“The main reason it took so long to implement the SBC system was due to the laxness of the previous Senior Vice President of Development. He used to say “let´s give people time to adopt the system…They will end up using it.” (Administrator 1 in a SBC
representatives meeting)
“Initially, people thought that we wanted to know what they were doing…But when we explained to them that it was necessary for resource allocation, and to determine the amount of R&D expenses to capitalize to the balance sheet, they started to be more responsive.” (Product Management Manager in a feedback and support meeting)
Then, as suggested by the Cost Study Manager, Controller 1 presented the project to Engineer 1. Engineer 1 was concerned about the lack of accuracy in project reporting:
“Today, we have no visibility in the software development cycle. The reality is that we do not know how to measure it although we are all conscious that it is necessary. Top management has asked several times what the cost of it was and its contribution to the overall business model.” (Engineer 1 in a formal meeting with Engineer 2, Controller 1,
Controller 2 and the researcher)
Engineer 1 was interested in Controller’s 1 project and together they agreed to prepare a joint proposal. A coalition10 (or Project Team) was created comprising Controller 1, Engineer 1, Controller 2, Engineer 2 and the researcher. Engineer 1 and Engineer 2 became strong allies for Controller 1, Controller 2 and the researcher because they came from a development division of the R&D site and had ample experience of the technical aspects of the software development cycle. Subsequently, the Project Team prepared a proposal: the software development cycle control project. They, then, approached one of the SBC administrators (Administrator 2) from the Cost Study Department to learn about the process of implementing the new project in the SBC system. The Project Team knew Administrator 2 well, especially Controller 2 and Engineer 2 (a recently promoted SBC representative), because they both worked closely with her on different projects. Administrator 2 represented an entry point between the Project Team and the SBC representatives.
2.2. Dynamics at the SBC representatives meetings
When the project was presented for the first time to SBC representatives at the SBC representatives meeting, the Finance Director was the only director who supported the project. Controller 2 presented the project instead of Engineer 2 although Administrator 2 had warned:
10
Stevenson et al. (1985) defined a coalition as an interacting group of individuals, deliberately constructed, independent of the formal structure, lacking its own internal formal structure, and consisting of mutually perceived membership that is issue-oriented and focused on a goal or goals
“At the introduction meeting, as many of you as possible should come, especially Engineer 1 and Engineer 2…It is important that Engineer 1 introduces the change to the SBC representatives and SBC administrators.” (Administrator 2 in a formal
meeting with the Project Team)
Engineer 1 and Engineer 2 knew several SBC representatives well. They were the ones who had implemented the New Project Management phases in the SBC system. However, neither of them could attend the meeting. Controller 2 did not know any of the SBC representatives (except Management Accounting SBC representative) and knew he would be perceived as an intruder. Financial controllers at the French R&D site knew that they did not benefit from a favorable reputation among development divisions. As anticipated by Controller 2, his presentation of the proposal triggered differing reactions among SBC representatives. Several behavioral and technical issues were raised by SBC representatives from Product Management, Core 1, Business Unit 1 and Management Accounting. Cross-communication developed, tension built up and conflict arose between several SBC representatives. Some of the discomfort can be illustrated as follows:
“Such a change will be a nightmare. People find the system already very complicated… At Business Unit 1, many employees are contractors. They do not feel concerned about filling their time in the SBC system … and when they enter their time, many of them do it erroneously.” (Business Unit 1 SBC representative)
“People will cheat on the system.” (Product Management SBC representative).
Another source of concern was the secondary stage of the implementation process, namely the acceptance by organizational users.
“Step after step, you want to implement it gradually! I think it will be too difficult to do! I don’t think that people will respond to it favorably. It will create a lot of confusion.
They are already very confused…Acceptance by the user will be complicated.”
(Business Unit 1 SBC representative)
At the end of the meeting, the issue remained unsettled. Some SBC representatives were in favor of the change, while some others rejected it (Table 2).
<Insert table 2 here>
Controller 2 proposed conducting feedback and support meetings11 and preparing a formal communication and implementation plan for the following meeting. Before the second SBC representatives meeting, Engineer 1 had convinced the Systems Planning Director, his superior, of the suitability of the project. At the second SBC representatives meeting, SBC representatives began to realize that the proposal was a serious initiative.
2.3. Project Team - development division diffusion process
At the second SBC representatives meeting, SBC representatives from Core 1, Business Unit 2, and Product Management were impatient to see the proposal. The Core 1 SBC representative was identified as the first one to be involved in a feedback and support
11
Feedback and support meetings were formal meetings organized by the Project Team with SBC representatives. The sessions were conducted on an individual basis to create a space for discussion about the proposal. At first, they were a source of discord between Project Team members because Controller 1 wanted to include, in the feedback and support meetings, only influential actors from all the development divisions to obtain organizational support. He commented: “We should not involve all SBC representatives. Core 1 and Product Management SBC representatives could be the exception because they have influence within their development division.” He further explained: “SBC representatives work on technical aspects; if top management approves the project, they will have to execute what we want… We should not be too democratic because there are some people that see problems everywhere.” On the other hand, Controller 2, Engineer 2 and the researcher thought that if they bypassed the SBC representatives, it could create opposition among SBC representatives.
meeting, as he was very eager to look at the relevance of the proposal and communicate it to his team12:
“I have a team meeting in 2 weeks and if there is to be a change, I would like to explain it to my team.” (Core 1 SBC representative in a feedback and support meeting)
The feedback and support meeting with Core 1 SBC representative provided a constructive communication channel to discuss and improve the proposal. Two weeks after the feedback and support meeting, Core 1 SBC representative commented in an individual meeting with Controller 2 and the researcher:
“I wanted to see in which direction the change would go. Now, I see that the change makes sense.” (Core 1 SBC representative in a feedback and support meeting)
Similar individual feedback and support meetings were, then, conducted successively with SBC representatives from Business Unit 2, Product Management and Quality Testing. During the first feedback and support meetings with SBC representatives with Core 1, Business Unit 2, Product Management and Quality Testing, there was much give and take in order to build a coherent proposal and to reflect the views of all development divisions. They took part in the “top management adoption” process. They were managers and team leaders with formal authority within their development division and were directly connected to their development divisions´ directors. They facilitated the diffusion of the proposal to top management. To create a mass of supporters, the Project Team started feedback and support meetings with people who showed a positive attitude towards the change. The support received from Business Unit 2, Product Management, Quality testing, Core 1 strengthened the initiative before the meetings with SBC representatives who showed a negative or indifferent attitude towards the project. Business Unit 1, Management
12
Until the feedback and support meetings, the Project Team had agreed not to show or transmit any written document to anyone to avoid uncontrolled diffusion of the proposal. The Project Team wanted to obtain, first, some organizational support.
Accounting, and Core 2 reacted differently as they were invited by Controllers 1 and 2 to be participants in a feedback and support meeting.
In face of the negative attitude of the SBC representatives from Business Unit 1 towards the project, Controller 1 intended to present the initiative directly to Business Unit 1 Director, bypassing both Business Unit 1 SBC representative and Business Unit 1 Manager. However, to Controller’s 1 surprise, Business Unit 1 Director recommended Controller 1 to review the proposal directly with Business Unit 1 Manager. Also, Business Unit 1 Manager had been warned by her SBC representative about the negative aspects of the initiative. As Controllers 1 and 2 invited the manager of Business Unit 1 to a feedback and support meeting, she answered ironically:
“Absolutely!! I could write a book about it. I have so many ideas, issues about the SBC system.” (Part of an e-mail sent by Business Unit 1 Manager to the researcher in reply
to an invitation to a feedback and support meeting)
Although the proposal had reached Business Unit 1, the negative rumors had spread among Business Unit 1 hierarchical superiors. Therefore, Controllers 1 and 2 were expecting conflict in the feedback and support meeting with Business Unit 1 Manager.
Surprisingly, the Management Accounting SBC representative, who was the last to be consulted, did not view the change favorably. Her input was important because she is an SBC representative and because she has expertise in determining the amount of R&D expenses to capitalize -the new proposal was composed of many development activities, many of which could be capitalized to the balance sheet. She overtly disagreed with several activities in the new proposal, as they would no longer be capitalizable under IFRS 38. She commented to the researcher that she was surprised and did not understand why she had not been considered as part of the Project Team. However, Controller 1 did not share her point of view:
“Her input is important to determine the amount of R&D expenses to capitalize, but building a performance measurement and evaluation system is our business.”
(Controller 1 in a formal meeting with Controller 2 and the researcher)
This situation seemed to create resentment in her, and she looked to mobilize support from her hierarchical superior, the Management Accounting Manager.
Resistance was also shown by the Core 2 SBC representative. During the SBC representatives meetings, he always remained isolated and replied with apathy to issues related to his division. Controller 1 noted:
“This is what worries me. I have not heard good things about him, neither outside nor inside the Core 2 division." (Controller 1 in a formal meeting with Controller 2 and the
researcher)
The Project Team knew the project would not be implemented without the acceptance of Core 2, one of the oldest and largest development divisions. Its director had a lot of influence, as he is very close with the Executive Vice President of Development. In fact, Core 2 Director and the Executive Vice President of Development worked together before their appointment at Sygmatech. As Core 2 Director´s opposition could jeopardize the project, Controllers 1 and 2 knew they had to handle the situation with great care if they wanted the proposal to be accepted by top management.
Therefore, although the SBC representatives meeting allowed the Project Team to liaise with all development divisions, several SBC representatives were still resisting the change. The Project Team knew that it had to receive positive feedback from all SBC representatives for the “top management adoption” process to be successful.
2.4. Intra-development division diffusion process
The SBC representatives meetings and the feedback and support meetings provided the Project Team with communication channels to transmit the project to all development
divisions. For the Project Team, there was an unexpected source of organizational support in six13 of the nine development divisions; namely Core 1, Business Unit 2, Quality Testing, Product Management, Information Systems, and Customer Support. The six SBC representatives from those six development divisions introduced the project to a hierarchical superior in their development divisions and obtained organizational support from them. For instance, SBC representative from Core 1 proposed introducing the proposal himself within his development division:
“If you want, I can present the proposal to the Core 1 Director to see if he has any feedback before you present it to the Development Directors’ Meeting. It would be good if you had his point of view before the meeting.” (Core 1 SBC representative in a
meeting with Controller 2 and the researcher)
Similar initiatives were proposed by SBC representatives from Business Unit 2, Product Management, Quality Testing, Information Systems and Customer Support who introduced the project to their hierarchical superiors, namely their managers or directors, from whom they received positive feedback. In those six cases, the Project Team did not make any contact with any other development divisions´ employees other than the SBC representatives. The Project Team relied on the trust relationship that existed between SBC representatives and their hierarchical superiors to obtain organizational support for the project.
In the case of the SBC representatives who were resisting the initiative, namely Business Unit 1, Management Accounting and Core 2, the process was more unpredictable. In the cases of Business Unit 1 and Management Accounting, the Project Team had to face the SBC representatives´ hierarchical superiors and convince them that the change was positive, in spite of the negative arguments they had received from their SBC representatives. To convince the SBC representatives´ hierarchical superiors, the Project
13
Team looked for a Project Team member close to the SBC representatives´ hierarchical superior. For instance, in the case of Business Unit 1, as Controllers 1 and 2 were expecting a negative reaction from Business Unit 1 Manager, Engineers 1 and 2 conducted the feedback and support meeting with her, as they had known her for a long time - over ten years. After the feedback and support meeting, Controllers 1 and 2 were surprised that Business Unit 1 Manager had not actually shown any strong opposition. In fact, during the session, Engineers 1 and 2 carefully reviewed the proposal with her and made necessary changes.
The Management Accounting SBC representative looked for political support and security from her hierarchical superior. She explained to her manager (Management Accounting Manager) the capitalization issue and expressed her resentment about not having been consulted early on the proposal. Consequently, a formal meeting had to be organized between financial controllers and management accountants to settle the issue. In the case of Core 2, none of the Project Team members knew either Core 2 SBC representative or Core 2 SBC representative’s hierarchical superior well. Therefore, Controllers 1 and 2 asked the Core 2 SBC representative:
“Who would you recommend as the best persons to provide feedback about the project?”(Controller 2 in an informal conversation with Core 2 SBC representative)
He put forward the names of two Core 2 team leaders (Team Leaders 1 and 2). After several failed attempts to contact them, Controller 1 sent them a provocative e-mail message, copying their manager. Part of the message was:
“We have received the feedback from all the other groups. We are just waiting for the feedback from Core 2…We need to have it before the end of April because in May we are planning to review the proposal with the Executive Vice President of Development. It would be really unfortunate if Core 2 was the only division not to give any feedback.”
In the following days, Team Leaders 1 and 2 responded in a positive way and new modifications were added to the proposal.
Unexpected to the Project Team, many SBC representatives became allies in the process of gaining support in higher hierarchical levels of the organization. SBC representatives diffused the project from the Project Team to the development divisions and subsequently within the development divisions to obtain support for the proposal. SBC representatives had made “top management adoption” possible because of their ability to liaise with their respective development divisions (see figure 2). They had convinced their hierarchical superiors about the viability of the project and had obtained organizational support from them. For the SBC representatives who were resisting or indifferent to the proposal, an interactive process was used, involving either a search process for trusted relationships in order to obtain organizational support (cases of Business Unit 1 and Management Accounting) or a provocative e-mail to obtain a positive response to the project (case of Core 2).
2.5. Top Management Approval
Finally, Controller 1 and Engineer 1 presented the change to the Executive Vice President of Development who approved the initiative. Then, e-mails were sent to each development director, explaining the reasons for the change and the persons who had been involved in the process. E-mails were sent before the Development Directors’ Meeting so that the change could be discussed during the meeting. At the Development Directors´ Meeting, Controller 1 presented the proposed change. No development directors argued or complained about the proposal, and many of them were in favor. Afterwards, Controller 1 reported to the researcher that it had been more like an explanatory meeting. Controller 2 made extensive presentations to development unit managers and their teams. Internal communication went well in written form through mass media, the local Sygmatech journal
and the Sygmatech intranet. The change was put into production and was ready for January 200514.
3. Methods
The R&D unit of Sygmatech was considered a suitable setting for this study because of difficulties related to the introduction of performance measurement and evaluation systems in the R&D environment. In fact, antagonism existed between the engineers and the financial controllers at Sygmatech, and this created a propitious environment in which to study “the top management adoption” process and resistance to change. Although a case study involving a single firm is limited in terms of statistical generalizability, it offers opportunities for in-depth observation and analysis of complex research phenomena in a way that permits contextual generalizability (Lukka and Kasanen, 1995, cited in Granlund, 2001).
The case project began in August 2003, and the active part of the study finished in September 2004. Some follow-up visits and phone interviews were made by the researcher until March 2005, at which time the system was satisfactorily put in production and reports were prepared for the first quarter of 2005. During his stay at Sygmatech, the author spent five to seven hours on site each day, and was given an office with wide access to information and to the company’s intranet. During the first 3 months, the researcher prepared a finance and accounting training course for non-finance managers to inform them of the role and activity of the Controlling Department. This allowed the researcher to acquire knowledge of the company and provided opportunities to meet with influential persons from diverse organizational units. During the empirical phase of the study, the researcher was an active member of the Project Team and participated actively in most aspects of the project: preparing the project proposal, interviewing, discussing and coordinating with different organizational members, attending meetings, communicating follow-up information, and participating in feedback and support meetings. The involvement was close to that detailed by Eden and Huxham (1996, p. 526): “research
action results from an involvement by the researcher with members of an organization over a matter which is of genuine concern to them and in which there is an intent by the organization members to take action based on the intervention. These criticisms of the involvement by the researcher are countered by the argument that the involvement with practitioners over things which actually matter to them provides a richness of insight which cannot be gleaned in any other ways.” Data were collected from multiple sources, mixing qualitative and quantitative methods, including observations, semi-structured interviews, meetings, documentary analysis and classified data (Denzin, 1978; Scapens, 1990; Yin, 1984). The aim was to generate a rich source of field data with internal checks on their validity. The explanations that were developed were not simply “grounded in the data” in the sense of Glaser and Strauss (1967), but were grounded in action (Eden and Huxham, 1996).
The overall research process was highly iterative (Miles and Huberman, 1984). As the “top management adoption” process was traced through the people involved in it, two questions arose: “Are there any relationship patterns among individuals who became involved in the process?” and “How can those relationship patterns be described?”, for which the literature on management accounting change did not appear to provide satisfactory answers. The author then engaged in data collection, attempting to trace the “top management adoption” path of the project. The data collection was not influenced by an a priori theory of the implementation of performance measurement and evaluation systems. Thus, all pre-understanding was temporarily suppressed – theories were only considered as they emerged and not in advance of the research – to avoid closing off new and alternative ways of understanding the data (Eden and Huxham, 1996) and the imposition of an arbitrary “analytical framework” on the case (Scapens and Roberts, 1993). Analysis of the data started to reveal patterns in the process of diffusing the proposal, which prompted reference to the literature to seek concepts that might help to explain these patterns. By going back and forth between the data and the literature, a reiterative process took place. Arguments concerning the strength of ties seemed to point to a relevant conceptual framework to explain the phenomenon under study. The strength of ties was defined according to the
literature on social networks, and as several interaction patterns arose maps were created to display the elements and their interactions.
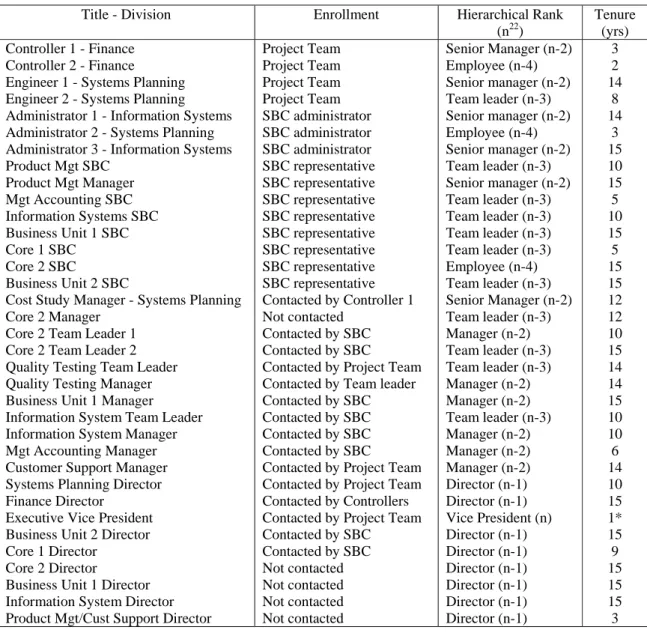
3.1. Measures
In addition to the qualitative data collected from the intervention, quantitative data were collected through questionnaires and directed interviews with all the 35 persons involved in the “top management adoption” process. A simple questionnaire (Table 3) was distributed to the Executive Vice President of Development (also General Manager of the French R&D site), to eight division directors (five development directors, two marketing directors and the finance director), ten senior managers, ten team leaders and six employees.
<Insert table 3 here>
An adjacency matrix (table 4), or sociomatrix was prepared from the responses to Q4 of the questionnaire. For each of the 34 other persons, respondents were asked to indicate on a scale of 4 (I trust him/her as a friend) to –1 (I prefer to avoid him/her) their response to the question “How do you qualify your relation with this person?” (Table 3).
<Insert table 4 here>
The scale -1 to +4 was used instead of the more common Likert scale that ranges from 1 to 5 to highlight and reflect the negative feeling -distrust/rejection- that one individual could feel for another one.
Individual responses were entered as rows in a 35×35 sociomatrix, in which rows and columns represent individuals and cells represent the “strength of ties” between pairs of individuals. For instance, number “3” in cell (1,2) indicates that the Product Management SBC representative (row 1) decided to answer “know well” (choice 3 to question 4) Core 1 SBC representative (column 2). Of the 35 questionnaires, 34 were completed. Respondent choices for the missing questionnaire (No. 35) were treated as 0.
The “strength of ties” network intends to portray the intensity of the relationship by determining the strength of the relationship between individuals involved in the “top management adoption” process. On one hand, a weak tie or acquaintance represents a relationship in which two organizational members are aware of each other and interact occasionally. There are arm’s length relationships with low affective transactional content and low emotional closeness. On the other hand, strong ties or friendship ties have affective undertones that have developed over time through frequent interactions. They involve trust and high emotional content. Intermediate ties are those that are neither strong nor weak. In such instances, people interact quite frequently and know each other well. Friendship could develop through time and the relationship could become a strong tie or otherwise remain as it is.
The questionnaires were completed at the end of the researcher’s stay in the organization. This could have biased the centrality of financial controllers in the “weak ties” network as they had recently interacted with many development division people at the French R&D site (e.g. SBC representatives). Notwithstanding, it did not seem to affect the “strong ties” and “intermediate ties” networks because, even though, the ties were measured at the end of the researcher’s stay, the financial controllers still remained isolated in the “strong ties” and “intermediate ties” networks –probably because strong ties and even intermediate ties take time to develop and maintain. However, the author believes that the involvement of financial controllers with operational people during the “top management adoption” process has provided an opportunity for them to work further, and in a closer way, with operational people to develop new and creative business solutions. In this case, the strengthening of control did not seem to lead to distrust but, on the contrary, to enhance trust through the interactions between financial controllers and operational people. Regarding other organizational actors involved in the project, they already knew each other before the project was initiated, as it used mainly existing formal communication channels (i.e. SBC representative meetings, Development Directors Meeting, and hierarchical relationships within development divisions). For them, the “top management adoption” process in implementing a performance measurement and evaluation system and the strengthening of
To avoid potential bias and to maintain objectivity, the author excluded himself from the social network analysis. The questionnaire was validated by research colleagues and several practitioners involved in the project. Questions were of a binary type or on a scale of 4 or 5 points. To collect the data, the researcher met each of the 35 respondents to deliver the questionnaire personally and to explain the objective of the research. Approximately half of the questionnaires were returned in person and the other half were returned via the internal mail service. Several respondents were contacted either by phone or in person to prompt them to fill in and return the questionnaire. The data were entered into the Ucinet IV software package, which computes several network measures (Borgatti et al., 2002), and several maps were produced using NetDraw. NetDraw allows the researcher to select nodes or organizational actors in order to display specific networks. The command “node repulsion and equal edge length bias” was used to force the nodes, displayed on the maps, to appear at an equal distance from each other to improve the visual aspects of the relationships among the individuals (e.g. in certain cases, nodes can be so close to each other that it becomes difficult to precise the relational patterns between them). Bidirectional arrows (“symmetrical” relations) indicate that persons A and B maintained some relational tie between each other. Unidirectional arrows indicate that A chose to answer that she/he maintained some relational tie for B, but B chose to answer that she/he does not maintain any relational tie with A. The absence of links between actors in the networks mean that actors do not have any relational tie between each other.
3.1.1. “Overall” network
Three different maps15 (figures 3a, 3b, 3c) were generated to identify relational patterns among the persons involved in the project. Figure 3a depicts the strong ties in the “overall” network elaborated from the “strength of ties” matrix (table 4) in which the matrix was recoded16 so that choice 4 for Q4 was assigned a value of 1. Choices ranging from –1 to 3
15
Figures 3, 4, 5, 6, 7 and 8 appear later in the manuscript (see section 4).
16
The recoding process transforms or modifies the raw data (through the Transform>Recode procedure in Ucinet IV) before submitting them to analysis. For example, we may be only
were assigned a value of 0. Figure 3b depicts the weak ties in the “overall” network elaborated from the “strength of ties” matrix (table 4) in which the matrix was recoded so that choices 1 and 2 for Q4 were assigned a value of 1. Choices -1, 3, 4 were assigned a value of 0. Figure 3c illustrates the intermediate ties in the “overall” network elaborated from “the “strength of ties” matrix (table 4) in which the matrix was recoded so that choice 3 for Q4 was assigned a value of 1. Choices -1, 1, 2, 4 were assigned a value of 0.
3.1.2. Grounding phase
A map (figure 4) was generated to depict the strong ties in the “grounding phase” network and representing the trusted relationships that Controller 1 mobilized in his search for organizational support in the early life of the project. The “strength of ties” matrix (table 4) was recoded so that choice 4 for Q4 was assigned a value of 1. Choices -1, 1, 2, 3 were assigned a value of 0.
3.1.3. Dynamics at the SBC representative meetings
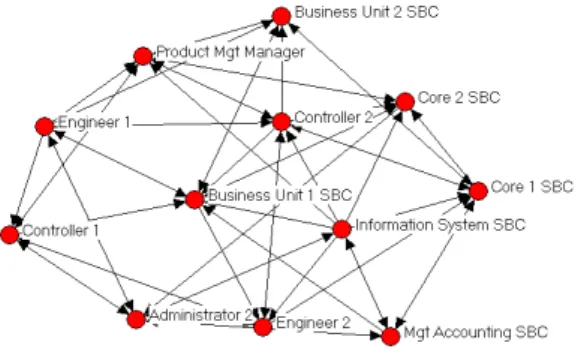
A map (figure 5) was generated to display strong ties or trusted relationships among SBC representatives, SBC administrators, Controller 1, Controller 2, Engineer 1 and Engineer 2. The map highlights the role of strong ties in the “top management adoption” process among SBC representatives and SBC administrators. The “strong ties” network was elaborated from the “strength of ties” matrix (table 4) so that choice 4 for Q4 was assigned a value of 1. Choices ranging from –1 to 3 were assigned a value of 0
interested in working with interpersonal trust relationships. Therefore, it turns out that the lower rankings (below 3) to question 4 (Q4) “How do you qualify your relation with this person?” do not represent strong ties. In such a case, we may decide to recode all ranks lower than 3 to 0 and recode all rank 4 as 1 so that only “trust as a friend” (choice 4 to question 4) relationships appear on the graphs. The same process applies if we are interested in mapping intermediate ties (choice 3 to question 4) or weak ties (choices 1 and 2 to question 4). The cut-offs have not been chosen
3.1.4. Project Team - development division diffusion process
Three maps (figures 6a, 6b, 6c) were generated to highlight relational patterns between the Project Team and SBC representatives. Figure 6a depicts the strong ties in the “inter-development division diffusion” network. It was elaborated from the “strength of ties” matrix (table 4) in which the matrix was recoded so that choice 4 for Q4 was assigned a value of 1. Choices ranging from –1 to 3 were assigned a value of 0. Figure 6b depicts the weak ties in the “inter-development division diffusion” network elaborated from the “strength of ties” matrix (table 4) in which the matrix was recoded so that choices 1 and 2 for Q4 were assigned a value of 1. Choices –1, 3 and 4 were assigned a value of 0. Figure 6c illustrates the intermediate ties in the “inter-development division diffusion” network elaborated from “the “strength of ties” matrix (table 4) in which the matrix was recoded so that choice 3 for Q4 was assigned a value of 1. Choices -1, 1, 2, 4 were assigned a value of 0.
3.1.5. Intra-development division diffusion process
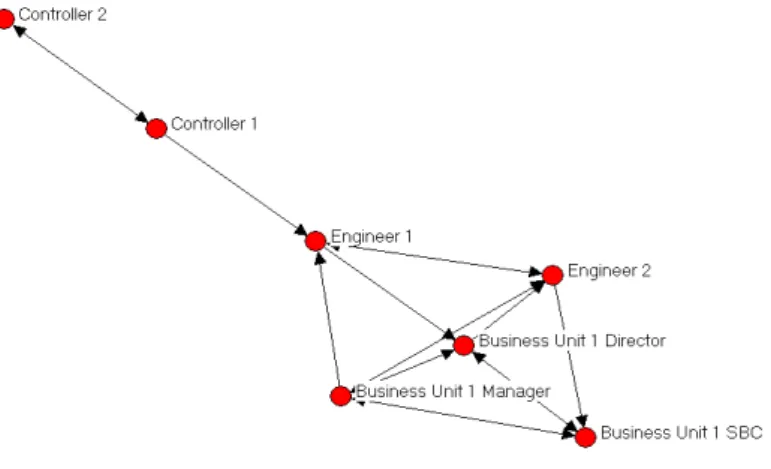
Two maps17 (figures 7a and 7b) were elaborated to display strong and intermediate ties between the Project Team, SBC representatives, and SBC representatives´ hierarchical superiors for Business Unit 1 and Management Accounting divisions. The maps show (1) the position of Controllers 1 and 2 in development divisions and (2) whether specific trusted relations existed between Project Team members, SBC representatives and SBC representatives´ hierarchical superior in development divisions. To describe such patterns, the “strength of ties” matrix (table 4) was recoded so that choices 3 and 4 for Q4 were assigned a value of 1. Choices ranging from –1 to 2 were assigned a value of 0.
3.1.6. Top management approval
17
Eight maps were originally developed (see Masquefa 2005 for a full representation) but for simplicity two maps were displayed here as examples. The other six showed very similar patterns to figure 7a.
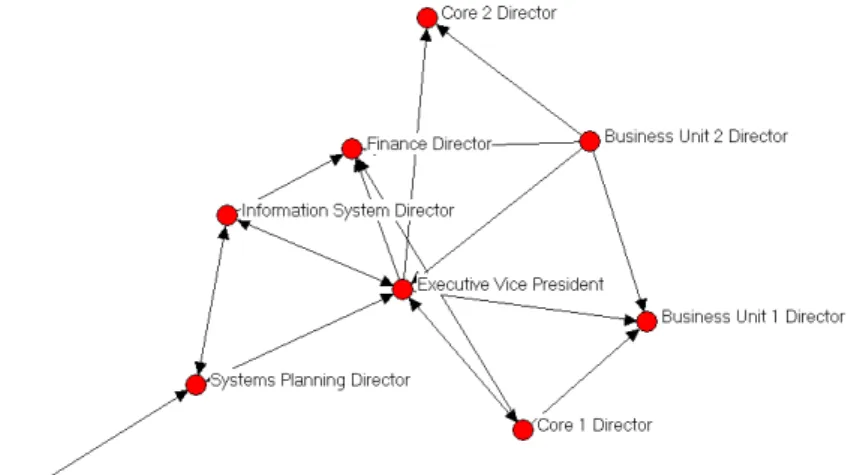
One map (figure 8) was generated to display trusted relationships between development directors and the Executive Vice President of Development. To explore such structural patterns, the “strength of ties” matrix (table 4) was recoded so that the choice 4 for Q4 was assigned a value of 1. Choices –1 through 3 were assigned a value of 0.
4. Structural analysis
The case description in section 2 illustrated the successful “top management adoption” of a new performance measurement and evaluation system originally developed by financial controllers. The change process raised issues of support or opposition by various organizational members. The following section analyses how different types of relationships among individuals facilitated or hindered the “top management adoption” process from a social network perspective.
4.1. “Overall” network
The construction of the “overall” network was described in Section 3.1.1. Figures 3a and 3c show that employees from a same organizational unit are tied together in networks of strong ties. These strong ties are constituted primarily by work boundaries (i.e. figure 3a Information Systems at the upper left, Finance at the upper right, Business Unit 1 at the lower right, Systems Planning at the lower right, Product Management at the lower left, etc.). Figure 3b indicates that weak ties are far more numerous than strong ties. In line with the social network literature, weak ties are more easily accessible and easier to develop and maintain than stronger ties and are more likely to be found between subgroups.
<Insert figure 3 here>
(Controller 1 and Controller 2) are quite isolated in the “strong ties” and “intermediate ties” networks, while they are more centrally18 located in the “weak ties” network (figure 3b). In contrast, Engineer 1 and Engineer 2 are more centrally located in the three networks, especially in both the “strong ties” network and the “intermediate ties” network.
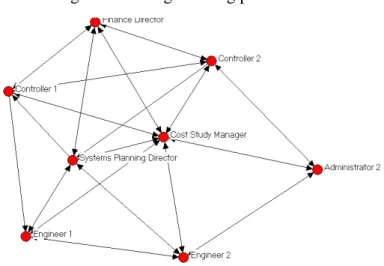
4.2. The grounding phase
The strong ties in the “grounding phase” network were represented as outlined in Section 3.1.2. Figure 4 depicts a network of trusted relationships, operationalized through strong ties, among the first people enrolled in the project.
<Insert figure 4 here>
Early in the “top management adoption” process the patterns of interactions between Controller 1 and the persons he contacted were not purely random moves (see figure 4). Controller 1 first contacted the Cost Study Manager and the pattern of their relation is represented by a reciprocal strong tie. The Cost Study Manager benefits from a centrally located position in the network. He trusts and he is trusted by all the other actors in the “grounding phase” network. The Cost Study Manager also strongly advised Controller 1 to meet with Engineers 1 and 2. The meeting between Controller 1, Controller 2 and Engineer 1 and Engineer 2 resulted in the formation of the Project Team. Moreover, the Project Team first contacted Administrator 2 with whom they share strong ties. Accordingly, the introduction of the project occurred through a chain of strong ties – trusted relationships – before its dissemination to other organizational actors.
4.3. Dynamics at the SBC representatives meeting
18
A measure of centrality used in social network analysis is “degree centrality” that counts the number of in-ties and out-ties of the nodes to determine which actors are more central than others.
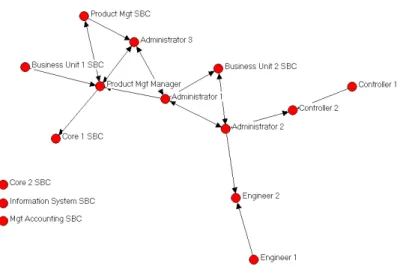
An analysis was carried out to determine trusted relationships between the Project Team members, the SBC representatives and the SBC administrators, as described in Section 3.1.3 (figure 5).
<Insert figure 5 here>
Figure 5 highlights the role of Administrator 2 as a cutpoint between the Project Team and SBC representatives. That is, if she is taken away from the network, the network would then be divided into three independent networks. She used her network of trusted ties to inform several of the SBC representatives and SBC administrators, in particular Administrator 1, about the Project Team’s proposal, thus reducing possible resistance to the project. The Project Team enrolled Administrator 2 because she was an SBC administrator and because the Project Team trusted her. The trusted relationships that Administrator 2 had with the Business Unit 2 SBC representative and Administrator 1 greatly benefitted the Project Team. Also, Administrator 1, Administrator 2, the Core 2 SBC representative, the Product Management Manager, the Product Management SBC representative, and Administrator 3 are all connected in a dense network of strong ties – trusted relationships –, and they all reacted positively towards the initiative.
On the other hand, SBC representatives who were not in favor of the initiative (Business Unit 1 SBC representative, Core 2 SBC representative, Management Accounting SBC representative) are isolated in the network. Their weaker position in the network reveals that they were unlikely to mobilize other SBC representatives to oppose the project. Consequently, in the controversial change introduced here, the advocates mobilized their network of strong ties to convince other members that the change was a good idea and to obtain a critical mass of individuals to overcome detractors. Detractors became more isolated and unable to influence other members to oppose the proposal.
The construction of the “Project Team – development division diffusion” networks was described in Section 3.1.4 (figure 6). The abundance of weak ties between the Project Team and the SBC representatives (figure 6b), along with the numerous intermediate ties between the Project Team and the SBC representatives (figure 6c) and the absence of strong ties between the Project Team and the SBC representatives (figure 6a) suggest that the performance measurement and evaluation system diffused from the Project Team to the distant development divisions (both in terms of physical distance -i.e. different buildings on the same R&D site- and social networks) through weak ties and intermediate ties rather than strong ties.
<Insert figure 6 here>
These findings are consistent with the bulk of network studies that emphasize the role of bridges19 -weak ties- in the propagation of diverse phenomena. For instance, Granovetter (1973, p. 1376) notes that:
“Weak ties are more likely to link members of different small groups than are strong ones, which tend to be concentrated within particular groups”.
In this case, SBC representatives served as bridges between the Project Team and the development divisions. Consequently, the following proposition can be offered:
P1: The “top management adoption” process in implementing a performance measurement and evaluation systems20 will tend to diffuse between organizational groups, primarily through weak ties and intermediate ties rather than through strong ties.
19
4.5. Intra-development division diffusion process
The construction of the “intra-development division diffusion” network was described in Section 3.1.5 (figure 7). This section analyses the relational patterns between: (1) the Project Team, (2) the SBC representatives and (3) the SBC representatives´ hierarchical superiors for Business Unit 1 and Management Accounting divisions.
<Insert figure 7 here>
Figure 7 suggests that, within Business Unit 1 and Management Accounting, the SBC representatives, their hierarchical superiors, and the division’s director are connected by strong ties. For instance, Business Unit 1 SBC representative is strongly connected to Business Unit 1 Manager who is, herself, strongly connected to Business Unit 1 Director. Similar patterns were found in a previous analysis of the other six instances of intra-development division diffusion (see Masquefa, 2005); that is, the SBC representatives presented the project to hierarchical superiors with whom they shared a strong tie to obtain organizational support. This finding is consistent with the social network literature. Nelson (1989) suggests that people use strong ties for political mobilization and solidarity. Therefore, the following proposition can be offered:
P2: The “top management adoption” process in implementing a performance measurement and evaluation systems will tend to diffuse within organizational units through strong ties.
According to P1 and P2 , the overall “top management adoption” process in implementing a performance measurement and evaluation system diffused, in the first place, through weak
20
and intermediate ties to development divisions and then through strong ties within development divisions. Similar findings have been found in the social network literature. For instance, Weimann (1980, p.21) suggests that:
“Weak ties provide the 'bridges' over which innovations cross the boundaries of social groups…whereas the influence on the decision making is done mainly by the strong ties network within each group".
A characteristic that emerges from figure 7 is the network position of Controllers 1 and 2 in the operational networks21. Their positions contrast with Engineers 1 and 2. Both financial controllers are isolated from the operational affairs of the company. Engineer 1 is, in most cases, the cutpoint between the financial controllers and the development units. Only in the case of Management Accounting (figure 7b) is the situation reversed, whereby the financial controllers occupy a central position. These observations directly reflect the role of the financial controllers. The coalition with Engineers 1 and 2 greatly helped the “top management adoption” process, especially when SBC representatives were resistant to the project. When certain SBC representatives (i.e. Business Unit 1, Management Accounting, Core 2) opposed the project, the Project Team members used their intermediate ties with SBC representatives to reduce the resistance associated with the change process (i.e. Controllers 1 and 2 met with Management Accounting SBC representatives and her hierarchical superior, while Engineers 1 and 2 met with Business Unit 1 SBC representatives and her hierarchical superior). In both cases, the trust-like relations, represented by intermediate ties, seemed to be an important resource. On the other hand, when Controller 1 introduced the proposal to Core 2 SBC representatives and his hierarchical superiors, his lack of trusted ties in Core 2 development division resulted in increasing behavioral uncertainty that could have led to resistance and project failure. In the case of resistance to change, weak ties make it more difficult to convince operational staff and to overcome their objections.
21
The other six intra-development division diffusion maps show similar patterns to figure 7a; that is, Controller 1 and 2 appear isolated.
On the other hand, when SBC representatives were in favor of the proposal (Core 1, Business Unit 2, Customer Support, Information Systems, Quality testing, Product management), the feedback and support meetings were highly constructive, and the nature of the relationships between the Project Team members and the SBC representatives were of secondary importance. Therefore, in the context of the “top management adoption” of a controversial performance measurement and evaluation system:
P3: In the absence of resistance to change, weak ties provide more efficient conduits and propagate performance measurement and evaluation systems faster than strong ties because they provide bridges to distant organizational units.
P4: When there is resistance to change, intermediate ties and strong ties are more suitable conduits to implement performance measurement and evaluation systems because the trust component that has been developed through frequent interactions helps to overcome resistance to change.
In light of the above findings and the results found by previous studies in the field of management accounting (e.g. Scapens and Roberts, 1993; Cobb et al., 1995; Emsley, 2005), financial controllers with traditional roles, as in the case of Sygmatech, are likely to have more difficulty in obtaining organizational support for implementing performance measurement and evaluation systems. Therefore:
P5: Financial controllers with a “traditional” orientation are less likely to obtain organizational support in implementing performance measurement and evaluation systems since they remain isolated in organizational networks and lack strong ties to operational units.
The construction of the “top management approval” network was described in Section 3.1.6. The last step in the diffusion process was the acceptance by the Executive Vice President of Development. Controller 1 and Engineer 1 attended a meeting with the Executive Vice President of Development, during which they explained the raison d’être of the project and the people involved in it. They asked him to support the project and communicate it through formal communication channels down to the rest of the organization. The Executive Vice President of Development agreed to support the initiative as:
“It was congruent with the current needs of the company.” (Executive Vice President
of Development in a meeting with Controller 1 and Engineer 1)
He also reviewed the people that had participated in the project and was satisfied that a consensus had been reached by all the development divisions and the various hierarchical levels. The next crucial event was the formal presentation to the development directors at the Development Directors’ Meeting. Controller 1 feared opposition from one or more directors at the meeting. The aim of meeting was not only to obtain approval from all the directors, but also to make them fully responsible for implementing the performance measurement and evaluation system within their own development divisions.
<Insert figure 8 here>
The strong ties – trusted relationships – in the “top management approval” network (see Figure 8) indicate that most directors at the French R&D site had trusted reciprocal ties to the Executive Vice President of Development. This hierarchical network, in which the links are organized around the Executive Vice President of Development, suggests that he had earned the trust and commitment of most of his subordinates. In an interview with the researcher, the Vice President of Development commented on “trust”: