HAL Id: hal-03084029
https://hal.inria.fr/hal-03084029
Submitted on 20 Dec 2020
HAL is a multi-disciplinary open access
archive for the deposit and dissemination of sci-entific research documents, whether they are pub-lished or not. The documents may come from teaching and research institutions in France or abroad, or from public or private research centers.
L’archive ouverte pluridisciplinaire HAL, est destinée au dépôt et à la diffusion de documents scientifiques de niveau recherche, publiés ou non, émanant des établissements d’enseignement et de recherche français ou étrangers, des laboratoires publics ou privés.
Copyright
Mining RDF Data of COVID-19 Scientific Literature for
Interesting Association Rules
Lucie Cadorel, Andrea G. B. Tettamanzi
To cite this version:
Lucie Cadorel, Andrea G. B. Tettamanzi. Mining RDF Data of COVID-19 Scientific Literature for Interesting Association Rules. WI-IAT’20 - IEEE/WIC/ACM International Joint Conference on Web Intelligence and Intelligent Agent Technology, Dec 2020, Melbourne, Australia. �hal-03084029�
Mining RDF Data of COVID-19 Scientific Literature for Interesting Association
Rules
Lucie Cadorel
Univesité Côte d’Azur, Inria, CNRS, I3S, France Sophia-Antipolis, France
Email: lucie.cadorel@inria.fr
Andrea G. B. Tettamanzi
Univesité Côte d’Azur, CNRS, Inria, I3S, France Sophia-Antipolis, France
Email: andrea.tettamanzi@univ-cotedazur.fr
Abstract—In the context of the global effort to study, un-derstand, and fight the new Coronavirus, prompted by the publication of a rich, reusable linked data containing named entities mentioned in the COVID-19 Open Research Dataset, a large corpus of scientific articles related to coronaviruses, we propose a method to discover interesting association rules from an RDF knowledge graph, by combining clustering, community detection, and dimensionality reduction, as well as criteria for filtering the discovered association rules in order to keep only the most interesting rules. Our results demonstrate the effectiveness and scalability of the proposed method and suggest several possible uses of the discovered rules, including (i) curating the knowledge graph by detecting errors, (ii) finding relevant and coherent collections of scientific articles, and (iii) suggesting novel hypotheses to biomedical researchers for further investigation.
1. Introduction
The COVID-19 pandemics has brought about an im-mediate and unprecedented response by the whole scien-tific community, beyond the disciplines of Biology and Medicine. Researchers from all over the world and from all disciplines have mobilized to contribute to a common effort to study, understand, and fight the new Coronavirus and its associated diseases and pandemics.
One of the major challenges in this context is to make sense of the huge scientific literature that has been (and is being) produced about this subject. The number of articles published about COVID-19 is so large that it would be impossible for any researcher to be aware of (let alone read) them all. This is one problem where knowledge rep-resentation and knowledge discovery have the potential to play an important role to support the effort of the scientific community.
The Wimmics team,1 a joint research group of Inria and the I3S Laboratory, decided to join the global effort by starting the Covid-on-the-Web Project,2 to publish, as
thoroughly and quickly as possible, a maximum of rich and reusable linked data about the coronaviruses [1].
1. https://team.inria.fr/wimmics/ 2. https://www.inria.fr/en/covid-web
The Covid-on-the-Web dataset3is based on the
“COVID-19 Open Research Dataset” (CORD-19), which gathers more than 50,000 full-text scientific articles related to the coronaviruses. It consists of two main modules, namely the CORD-19 Named Entities Knowledge Graph, contain-ing named entities mentioned in the CORD-19 corpus and linked to DBpedia, Wikidata, and other BioPortal vocabu-laries, and the CORD-19 Argumentative Knowledge Graph, a graph of arguments, conceptual structures linking claims to evidence supporting or attacking them. A third, cross-sectional module describes in RDF the metadata and content of the CORD-19 articles.
While publishing a comprehensive knowledge graph of named entities mentioned in the scientific literature and linked to Linked Open Data vocabularies is already an invaluable tool to support the search of the literature and semantic information retrieval, we thought it would be even more interesting to use data mining methods to discover interesting knowledge hidden in this dataset. Such knowl-edge, in the form of multi-relational association rules, might further enrich the dataset and suggest novel hypotheses to biomedical researchers for further investigation.
Our main contributions may be summarized as follows:
• we propose a method for discovering association rules from an RDF dataset combining clustering, community detection, and dimensionality reduction;
• we propose a method for filtering the discovered association rules in order to keep the most “inter-esting” ones;
• we apply the proposed method on the CORD-19 Named Entities Knowledge Graph, showing its ef-fectiveness as a technique to discover interesting hidden patterns that can be used to further enrich the dataset and suggest novel hypotheses for biomedical research.
The rest of the paper is organized as follows: Section 2 positions our contribution with respect to the literature; Section 3 provides a detailed description of the method we propose to mine the CORD-19 Named Entities Knowledge Graph for interesting association rules; Section 4 reports
the results of the experimental validation of the proposed approach and Section 5 draws some conclusions and outlines directions for further research.
2. Related Work
The growth of the semantic Web and of its most promi-nent implementation, the Linked Open Data (LOD), has made a huge number of interconnected RDF (Resource Definition Framework) triples, of the form (subject, pred-icate, object), which represent knowledge in a machine-understandable format, freely available for sharing and reuse [2]. LOD have thus become a giant real-world data re-source that can be exploited for mining implicit knowledge, this opening up exciting new opportunities for data mining research [3].
Finding association rules, also known as association rule mining, is an important data mining task. Since the seminal work on the Apriori algorithm [4], association rule mining has been a thriving field of research, which has contributed many effective techniques for detecting frequent patterns [5]. Several methods have been proposed in the literature for mining association rules from large RDF knowledge graphs. These methods can be divided into two broad categories: on the one hand, we find methods inspired by inductive logic programming [6] or statistical relational learning [7]; on the other hand, methods that follow the mainstream of association rule mining are adapted and applied to RDF graphs.
From the former category, we may mention AMIE [8], AMIE+ [9], and their descendants or Foil and DL-Focl [10]. Somehow atypical, but very promising, are meth-ods using evolutionary metaheuristics to drive the explo-ration of the hypothesis space [11].
Example of the latter category are [12], aimed specif-ically at ontology learning, [13], using association rule mining for RDF base enrichment, or [14], for mining RDF-based medical data. It is typical of these methods to generate transactions from an RDF graph using SPARQL queries and then use frequent pattern analysis algorithms to extract rules from those transactions. In addition, the idea is to exploit the knowledge embedded in the RDF graph at the schema level in order to add more semantics to the rules [3]. Our contribution can be viewed as being part of this stream of research.
One of the open issues of association rule mining is that of measuring the interest of the discovered patterns, beyond straightforward interestingness measures like confidence or lift. As a matter of fact, obvious and trivial rules tend to have high support and confidence, but they do not teach us anything novel; to be subjectively “interesting” for an expert, a rule should be somehow surprising, unexpected, improb-able. Some proposals to attack this problem are surveyed in [15].
An alternative approach that has been proposed in the literature is to look for associations by restricting one’s attention to specific subsets of a dataset. Often, the aggregate behavior of a dataset may be very different from localized
segments. In such cases, it is desirable to design algorithms which are effective at discovering localized associations, because they expose a customer pattern which is more specific than the aggregate behavior [16].
One way in which relevant localized segments can be automatically detected is by clustering the dataset using community detection algorithms [17]. To be sure, detecting communities in very large graphs (in our specific case, in a graph of named entity co-occurrences) requires scalable and efficient algorithms, like [18].
3. Discovering Interesting Association Rules
Association Rule Mining is often based on finding fre-quent patterns in a large transactional database by cal-culating support and then selecting them based on some interestingness measure, traditionally confidence. Support and confidence are defined as follows :
Supp(X → Y ) = No. of transactions with bothX andY Tot. No. of transactions =P(X ∩ Y );
(1)
Conf (X → Y ) = No. of transactions with bothX andY No. of transaction withX =P(Y | X).
(2) The limit of this approach is that the interesting rules with a low support are not discovered and the itemsets with a high support are over-represented. In the literature, one of the solutions proposed to overcome this issue is processing the database. Accordingly, we tried different pre-processing methods and then we combined them.
3.1. Clustering and Community Detection
The first pre-processing idea consists of creating sub-groups of transactions and/or itemsets and separately finding rules inside each group. Two methods have been tried: Clustering and Community Detection [19].
3.1.1. Clustering. In a transactional database, two differ-ent types cluster analysis can be performed. The first one is clustering the transactions, whereas the second one is clustering the itemsets. We chose to try both approaches. In this section, we describe the method of clustering the transactions, which follows essentially the same approach used for clustering itemsets, except for the input data.
We used hierarchial agglomerative (i.e., bottom-up) clus-tering (HAC) to cluster the transactions. As we had more features about transactions, we added them in the input data and computed their one-hot encoding matrix. In our approach, it is required to have enough transactions in each clusters in order to obtain more local rules. To determine the
Figure 1. Overall methodology
optimal number of clusters, we applied the elbow method. The steps are described below:
1) Compute Similarity: similarity can be viewed as the inverse of a distance metric. It is used to com-bine similar elements or clusters.
2) HAC with Complete Linkage: the algorithm starts creating a cluster for each element and then it combines them into larger clusters (linkage) until all elements are in the same cluster.
3) Elbow Method: it consists of calculating the sec-ond derivative of the distance between clusters and taking the number of clusters where such second derivative is highest. As we wanted a large enough number of clusters, we added a further condition, which is that of having at least three clusters with a predefined minimum number of transactions in each cluster. Otherwise we take the next highest value of the second derivative, until the condition is satisfied.
The clustering approach of the itemsets is similar, except that we do not have more features than the transactions in the one-hot encoding matrix.
3.1.2. Community Detection. The second approach is Community Detection. Community Detection algorithms seek to gather nodes in a large network. The main idea that distinguishes community detection from clustering, is that the network structure is used to split the database. Thus, a co-occurrence matrix is used instead of a transactional matrix to represent the links.
Both Clustering and Community Detection suffer from the curse of dimensionality, that is why our next pre-processing step is dimensionality reduction, before splitting the database into sub-groups.
3.2. Dimensionality Reduction
The second pre-processing step we applied is dimension-ality reduction, both for Clustering and Community Detec-tion. The most well-known methods are linear transforma-tions such as Principal Component Analysis [20]. However, data do not always lie on a linear subspace, that is why methods like auto-encoders [21] are more powerful. We decided to implement this approach using neural networks. The idea of Auto-encoders is to learn a latent-space representation thanks to the encoder part and reconstruct the data with the decoder. The results of the encoder part is our new input data.
We applied Auto-encoders on both one-hot encoding matrix and co-occurrences matrix. Then, we repeated the Clustering methods on both results of the encoder in order to get our subgroups.
3.3. Combining Methods
The final data pre-processing step is to combine different proposed methods before applying association rule mining algorithms. The idea is to mix them in different ways in order to find different rules.
For example, Algorithm 1 presents a model combin-ing Community Detection and Clustercombin-ing. First, we gather itemsets into communities. Then, inside each community, we create a new one-hot encoding of transactions and thus we cluster the transactions. Dimensionality reduction with auto-encoders is applied to both Community Detection and Clustering. Eventually, we find rules for each cluster in each community.
The other way round, clustering transactions first and then finding communities might be another possibility. Fig-ure 1 presents all the possible combinations.
Data:X co-occurrences matrix, Y one-hot encoding matrix
Initialisation :
list R rules,CD communities,C clusters← [ ] ˆ
X ←Auto_encoders(X)
CD ←Community_Detection(Xˆ) foreach community inCD do
Select itemsets in community Y0← Y [. . . ,itemsets]
ˆ
Y ←Auto_encoders(Y0) C ←Clustering( ˆY ) foreach cluster inC do
Select transactions in cluster R ←Rules(Y [transactions,itemsets]) end
end
return the list of rulesR
Algorithm 1: Example of aggregated methods
3.4. Filtering Rules
While we focused on pre-processing methods, the post-processing is also important to filter rules and keep the most interesting ones. We identified three filters that can help us keep the best rules.
1) Minimum Confidence: confidence can be viewed as the reliability of a rule. We chose to keep rules that have a confidence higher than a given thresh-old.
2) Interestingness Measure: we wanted to penalize rules whose antecedents and/or consequents are very frequent. In [22], the authors define a measure (see Equation 3) based on the support of a rule. We kept the rules with a value of this measure higher than a given threshold.
3) Redundant Rules: we deleted all rules that com-ply with the following definition of redundancy: A, B, C → D is redundant if
Conf (A, B → D) ≥ Conf (A, B, C → D).
Interestingness(X → Y ) = (Supp(X → Y )
Supp(X) )
× (Supp(X → Y ) Supp(Y ) ) × (1 − Supp(X → Y )
Tot. No. of transactions) (3)
4. Experiments and Results
4.1. RDF Dataset and Evaluation Metrics
The Covid-on-the-Web Dataset [23] is an RDF dataset composed of several distinct graphs, including the CORD-19 Named Entities Knowledge Graph. This graph gathers
Data:T test set, R discovered rules A ← Extract_NEs_from_abstracts(T) B ←Extract_NEs_from_bodies(T) foreach article in T do
list P ← [ ](the list of predicted NEs) foreach antecedent inR do
if antecedent in A[article, :]then P.add(consequent)
end
Num_NE ←sum_same_NE(P,B[article, :]) precision ← N um_N E
length(P )
end end
avg_precision ←Average(precision) return avg_precision, the average precision
Algorithm 2: Model Evaluation
named entities (NEs) identified in scientific articles and linked to DBpedia, Wikidata, and other BioPortal vocab-ularies. We chose to use named entities identified and disambiguated by Entity-Fishing and linked to Wikidata. As our work is focused on discovering association rules between named entities, we queried the dataset’s SPARQL endpoint to get articles and named entities but also other metadata related to the articles such as publication, date, or authors. We used a sample of 27,636 articles and 6,398 named entities. We split the dataset into a training and a test set, with 22,000 articles (80%) and 5,636 articles (20%), respectively.
The named entities have been first identified in the abstracts of the articles and then in their bodies. We decided to use the named entities in the articles’ abstracts to discover rules because of the smaller number of NEs. Also, abstracts summarize all the important ideas of the article and, thus, are expected to mention the most important entities. Never-theless, the named entities in the bodies remain interesting in order to evaluate our model. We tried to predict NEs in the bodies from association rules found in the abstracts. Then we compared the predicted named entities with the named entities extracted in the body by Entity-fishing. We finally computed the precision of our predictions, defined as P recision =Number of predicted NEs truly in the body
Total number of predicted NE . (4) Algorithm 2 describes the method we followed to evaluate our model.
4.2. Data Pre-Processing
Before applying our methodology, we prepared the data to be more informative. As NEs are textual data, we first chose to apply lowercasing, removed punctuation and NEs which only consisted of numbers. Also, we decided to remove NEs according to their frequency. Thus, we kept NEs occurring in more than 5 articles and removed the 15 most frequent NEs (Figure 2).
Figure 2. A histogram showing the distribution of the 15 most frequent named entities.
The second step was to create new data used as input for Clustering and Community Detection algorithms. We generated a one-hot encoding matrix and a co-occurrences matrix. From the co-occurrences matrix we implemented a graph structure.
Finally, we chose to aggregate different algorithms and, after some preliminary experiments, we kept the following five models:
• AE + C is a clustering on the articles with an auto-encoder to reduce dimensionality. Indeed, ap-plying clustering without dimensionality reduction was computationally too slow.
• WT is a Community Detection algorithm called
Walk Trap [18]. It is a vertices based algorithm using a hierarchical clustering. The idea is to apply a random walk to compute a probability to go from node i to node j in t steps. Afterwards, a distance is calculated thanks to the probabilities in order to apply HAC.
• AE + CD is also a Community Detection algorithm. In this approach, we used an auto-encoder on the co-occurrences matrix to get latent variables. We applied HAC to this new variables to find NEs communities.
• WT + (AE + C) is a combination between Com-munity Detection and Clustering. First, we applied Walktrap algorithm to find communities. Then, for each community, we took their NEs and applied auto-encoder and clustering on the articles having those NEs.
• AE + CD + (AE + C) is the same as WT + (AE
+ C), except that it uses the AE + CD Community Detection approach.
We compared the above five models to a baseline con-sisting of applying the association rule mining algorithm directly to the data, without any pre-processing.
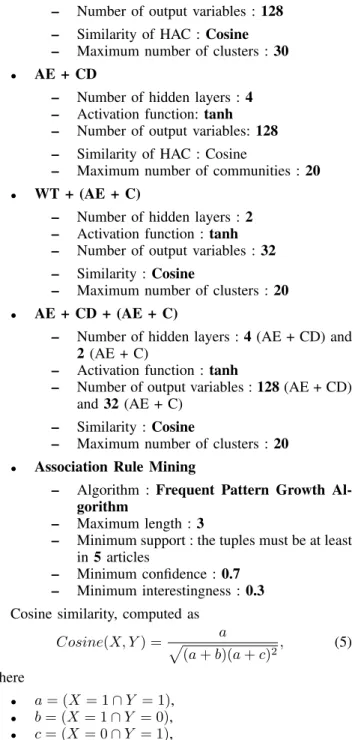
Finally, we set up hyperparameters for the different approaches and the association rules algorithm.
• AE + C
– Number of hidden layers : 4 – Activation function : tanh
– Number of output variables : 128 – Similarity of HAC : Cosine – Maximum number of clusters : 30
• AE + CD
– Number of hidden layers : 4 – Activation function: tanh – Number of output variables: 128 – Similarity of HAC : Cosine
– Maximum number of communities : 20
• WT + (AE + C)
– Number of hidden layers : 2 – Activation function : tanh – Number of output variables : 32 – Similarity : Cosine
– Maximum number of clusters : 20
• AE + CD + (AE + C)
– Number of hidden layers : 4 (AE + CD) and 2 (AE + C)
– Activation function : tanh
– Number of output variables : 128 (AE + CD) and 32 (AE + C)
– Similarity : Cosine
– Maximum number of clusters : 20
• Association Rule Mining
– Algorithm : Frequent Pattern Growth Al-gorithm
– Maximum length : 3
– Minimum support : the tuples must be at least in 5 articles
– Minimum confidence : 0.7 – Minimum interestingness : 0.3 Cosine similarity, computed as
Cosine(X, Y ) = p a (a + b)(a + c)2, (5) where • a = (X = 1 ∩ Y = 1), • b = (X = 1 ∩ Y = 0), • c = (X = 0 ∩ Y = 1),
measures the cosine angle between two vectors projected in a dimensional space. Since we created a multi-dimensional latent space with auto-encoders, this metric is more advantageous than other metrics such as Euclidean distance.
The hyperbolic tangent activation function, defined as
tanh(X) = 2
1 − e−2x − 1, (6)
is a non-linear function whose shape is sigmoidal. The ad-vantage of this function is its output range between[−1, 1]. Thus, the negative inputs will be mapped to strongly nega-tive outputs and posinega-tive inputs will be mapped to strongly positive outputs, which is useful to differentiate data.
TABLE 2. COMPARISON OF NUMBER OF COMMON RULES.
Baseline AE + C WT AE + CD WT + Clust AE + CD + (AE + C) Baseline AE + C 28 (2,6%) WT 193 (49,7%) 46 (11,9%) AE + CD 127 (100%) 16 (12,6%) 111 (87,4%) WT + (AE +C) 25 (7%) 123 (34%) 45(12,5%) 19 (5,3%) AE + CD + (AE + C) 41 (10,1%) 89 (22%) 47 (11,6%) 41 (10,1%) 66 (16,3%) 4.3. Results
To determine the most effective model, we analyzed three metrics which determine interest, novelty and predic-tive power of the rules.
The comparison of the number of rules before and after filtering, presented in Table 1, highlights how many rules are not considered as interesting. For example, our baseline found 14,233 rules before filtering, which is the largest number among all approaches. However, those rules are mainly redundant or uninteresting according to our criteria. Thus, only 1.7% of those rules have been kept after filtering. On the contrary, methods AE + C found fewer rules (6,409), which however turned out to be less redundant, since 17% of them have been kept. All our combining methods get more interesting rules compared to the baseline.
TABLE 1. NUMBER OF RULES BY MODEL.
Number of rules Number of rules Model before filtering after filtering Baseline 14,233 251 (1.7%) AE + C 6409 1091 (17%) WT 10,050 388 (3.8%) AE + CD 2264 127 (5.6%) WT + (AE +C) 3419 361 (10.5%) AE + CD + (AE + C) 3380 405 (12%)
The second evaluation consists of a two-by-two com-parison of the number of rules that are in both models as presented in Table 2. Thanks to this metric, we analyzed if a model is able to create novelty by providing rules which are not found in another model. We noticed that the Community Detection approaches (AE + CD and WT) yield rules very similar to those found by the baseline. The AE + CD method even has 100% of its rules that have been already found with the baseline. Thus, this method does not bring out novelty. On the other hand, we noticed that the rules of the Clustering method AE + C yield more novelty since they are totally different from the other models and more particularly from the baseline (only 2,6% of common rules). We finally noticed that the last two approaches, and more precisely AE + CD + (AE + C), are similar neither to the baseline (10,1%), nor to AE + C (22%). Therefore, we can conclude that the combination of Community Detection and Clustering is able to generate new interesting rules that we have not found with the other models.
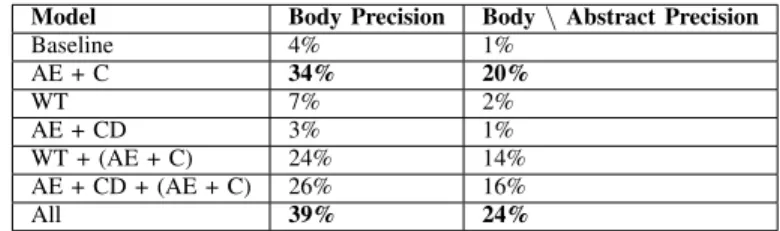
Finally, we evaluated the different models by predicting NEs that may be in the body according to the extracted NEs and our association rules. For instance, if the NE fever has been extracted in the body and is also found as an antecedent in our rules, then the consequent NEs of fever, such as cough, are predicted as being also NEs in the body. The precision helps us to determine how many NEs have been correctly predicted. The first precision, presented in Table 3, represents the percentage of predicted NEs that have been actually extracted in the body. The second one removes the predicted NEs that are already in the abstract. Indeed, most NEs in the abstract are obviously in the body. However, predicting NEs truly in the body that are not in the abstract could be a hallmark of interesting and non-trivial rules. Table 3 shows that AE + CD method outperforms the baseline and Community Detection approaches. The combi-nations of Community Detection algorithms and Clustering give also a better precision than our baseline. If we combine all the rules generated by all the model, we obviously reach a higher precision mostly due to AE + C and AE + CD + (AE + C) models.
TABLE 3. PRECISION EVALUATION
Model Body Precision Body\Abstract Precision
Baseline 4% 1% AE + C 34% 20% WT 7% 2% AE + CD 3% 1% WT + (AE + C) 24% 14% AE + CD + (AE + C) 26% 16% All 39% 24%
To conclude this evaluation, the Clustering model AE + C gives the best results in terms of number of interesting rules, novelty and precision. Nevertheless, the other rules generated by the combination of Community Detection and Clustering also bring some novelty, which could be useful to find surprising rules for the users.
4.4. Discussion of Results
The proposed methodology applied to the CORD-19 Named Entities Knowledge Graph allowed us to enrich the dataset. In this section, we give some details on three applications of the discovered rules.
First, the discovered rules allowed us to detect some errors in the extraction of named entities by Entity-Fishing.
TABLE 4. DETECTED ERRORS IN THE DATASET
Error Acronym Associated Named Entities Correct Named Entity nokia n95 n95 personal protective equipment mask n95
íþróttabandalag vestmannaeyja IBV avian infectious bronchitis, respiratory tract, Infectious bronchitis virus chicken
a59 road a59 glycoprotein Mouse hepatitis virus A59 international federation of basque pelota FIPV feline infectious peritonitis, Feline Infectious Peritonitis Virus
coronavirus, transmissible gastroenteritis virus
new international version NIV henipavirus, vaccine, malaysia Nipah Virus
Most of the errors are due to wrongly-associated acronyms. For example, we found nokia n95 associated to personal protective equipment in a rule. Since the topics of all the papers in the CORD-19 base are related to biomedical research, the correct named entity is obviouslsy mask n95, instead of nokia n95. Table 4 presents some of the errors discovered this way in the dataset.
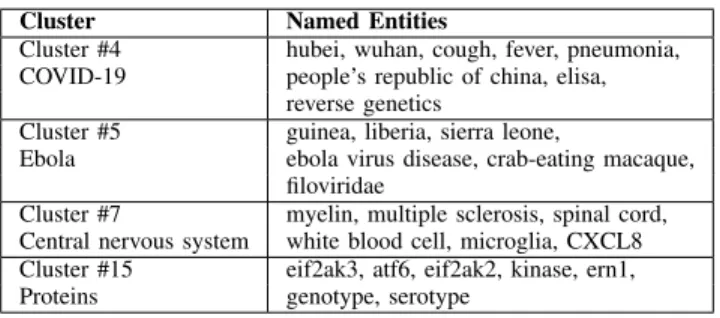
The second application could be finding relevant and coherent collections of articles in the database. Indeed, our clustering methods yielded groups of articles that turned out to deal with the same topic. For example, several clusters gather NEs related to one disease or a specific organ. This is the case of clusters number 4, 5, and 7, which mention NEs about COVID-19, Ebola, and the central nervous system, respectively. We also detected more biological clusters about proteins or enzymes such as cluster number 15.
We could also gather named entities, since we have computed communities.
TABLE 5. EXAMPLE OF CLUSTERS
Cluster Named Entities
Cluster #4 hubei, wuhan, cough, fever, pneumonia, COVID-19 people’s republic of china, elisa,
reverse genetics
Cluster #5 guinea, liberia, sierra leone,
Ebola ebola virus disease, crab-eating macaque, filoviridae
Cluster #7 myelin, multiple sclerosis, spinal cord, Central nervous system white blood cell, microglia, CXCL8 Cluster #15 eif2ak3, atf6, eif2ak2, kinase, ern1, Proteins genotype, serotype
Finally, Table 6 presents some rules generated by our methodology. The rules give information about disease symptoms as well as biology or Web actors. For example, we found the COVID-19 symptoms such as fever, dyspnea and cough but also the hot topics such as surgical mask and respirator or cruise ship and Diamond Princess. Then, we discovered associations between geographic locations and diseases. The NE People’s Republic of China associated with pneumonia has a high probability of co-occurring with Wuhan. On the other hand, African countries associated with Ebola virus are often linked with other African countries. In terms of biology, some associations refer to proteins or enzymes whereas others link diseases together. Finally, we found associations between Web companies such as Facebook and Twitter or two biological databases PubMed
TABLE 6. EXAMPLE OF RULES
Antecedents Consequents fever, dyspnea cough runny nose cough
anxiety mental depression surgical mask respirator cruise ship diamond princess exponential growth basic reproduction
number liberia, western african ebola virus guinea epidemic
people’s republic of china, pneumonia wuhan
camelus, middle east respiratory arabian peninsula syndrome coronavirus
poultry, people’s influenza a virus republic of china subtype h7n9 tnf, cytokine il10 eif2ak3, eif2ak2 atf6 p38 mitogen-activated protein sb203580 kinases, pyrazolanthrone
methyl, cholesterol cyclodextrin etiology, vasculitis kawasaki disease steroid, magnetic-resonance imaging osteonecrosis
hepatitis, liver cirrhosis hepatocellular carcinoma
pubmed embase
facebook twitter
and Embase. The rules are diverse and provide information not only on the medical or biological aspect but also on the social or economic one.
5. Conclusion
In this paper, we have proposed a method combin-ing clustercombin-ing, community detection, and dimensionality reduction for discovering association rules from an RDF knowledge graph. We have also proposed a post-processing method to filter the association rules according to their interestingness. We have presented five different models applied to the CORD-19 Named Entities Knowledge Graph. The experimental results provide evidence supporting the effectiveness of the proposed method. We have demon-strated that clustering and community detection help to reduce the number of rules and to detect weaker (i.e., lower-support) but more interesting hidden patterns. The evaluation method showed that the clustering method combined with auto-encoders gives the best results in terms of precision.
Nevertheless, adding community detection to clustering gen-erates novelty in the rules.
The application of the discovered rules allowed us to clean the database by finding errors among extracted named entities. As a useful byproduct of our method, we have also found relevant clusters and communities that might ease the navigation of the knowledge graph. We finally discovered rules covering various topics that give us insight to add to the database and might suggest novel hypotheses to biomedical researchers for further investigation.
Even though this first association rules analysis has pro-vided interesting results, the proposed methodology could be improved. We have not yet applied the method on the other named entities linked to DBpedia and Bioportal: adding these and other resources will certainly boost the number and quality of the discovered rules. The validation of the rules by a medical expert is also an important test to assess the reliability of our rules. As future work, the visualisation of our rules may play a key role to make the search of information in scientific literature more interactive and leverage it.
Acknowledgments
This work has been supported by the French govern-ment, through the 3IA Côte d’Azur “Investments in the Future” project managed by the National Research Agency (ANR) with the reference number ANR-19-P3IA-0002.
References
[1] F. Michel, F. Gandon, V. Ah-Kane, A. Bobasheva, E. Cabrio, O. Corby, R. Gazzotti, A. Giboin, S. Marro, T. Mayer, M. Simon, S. Villata, and M. Winkler, “Covid-on-the-Web: Knowledge graph and services to advance COVID-19 research,” in International Semantic Web Conference (ISWC), Athens, Greece, 2020.
[2] C. Bizer, T. Heath, and T. Berners-Lee, “Linked data - the story so far,” Int. J. Semantic Web Inf. Syst., vol. 5, no. 3, pp. 1–22, 2009. [3] M. Barati, Q. Bai, and Q. Liu, “Mining semantic association rules
from RDF data,” Knowledge-Based Systems, vol. 133, pp. 183–196, 2017.
[4] R. Agrawal and R. Srikant, “Fast algorithms for mining association rules in large databases,” in VLDB’94, Proceedings of 20th International Conference on Very Large Data Bases, September 12-15, 1994, Santiago de Chile, Chile, J. B. Bocca, M. Jarke, and C. Zaniolo, Eds. Morgan Kaufmann, 1994, pp. 487–499. [Online]. Available: http://www.vldb.org/conf/1994/P487.PDF
[5] J. Han, H. Cheng, D. Xin, and X. Yan, “Frequent pattern mining: current status and future directions,” Data Min. Knowl. Discov., vol. 15, no. 1, pp. 55–86, 2007.
[6] S. Muggleton, L. D. Raedt, D. Poole, I. Bratko, P. A. Flach, K. Inoue, and A. Srinivasan, “ILP turns 20 - biography and future challenges,” Mach. Learn., vol. 86, no. 1, pp. 3–23, 2012.
[7] L. Getoor and B. Taskar, Introduction to Statistical Relational Learn-ing. Cambridge, MA: MIT Press, 2007.
[8] L. A. Galárraga, C. Teflioudi, K. Hose, and F. M. Suchanek, “AMIE: association rule mining under incomplete evidence in ontological knowledge bases,” in 22nd International World Wide Web Conference, WWW ’13, Rio de Janeiro, Brazil, May 13-17, 2013, D. Schwabe, V. A. F. Almeida, H. Glaser, R. Baeza-Yates, and S. B. Moon, Eds. International World Wide Web Conferences Steering Committee / ACM, 2013, pp. 413–422.
[9] L. Galárraga, C. Teflioudi, K. Hose, and F. M. Suchanek, “Fast rule mining in ontological knowledge bases with AMIE+,” VLDB J., vol. 24, no. 6, pp. 707–730, 2015.
[10] G. Rizzo, N. Fanizzi, and C. d’Amato, “Class expression induction as concept space exploration: From DL-Foil to DL-Focl,” Future Gener. Comput. Syst., vol. 108, pp. 256–272, 2020.
[11] D. M. Tran, C. d’Amato, B. T. Nguyen, and A. G. B. Tettamanzi, “An evolutionary algorithm for discovering multi-relational associ-ation rules in the semantic web,” in Proceedings of the Genetic and Evolutionary Computation Conference, GECCO 2017, Berlin, Germany, July 15-19, 2017, P. A. N. Bosman, Ed. ACM, 2017, pp. 513–520.
[12] J. Völker and M. Niepert, “Statistical schema induction,” in The Semantic Web: Research and Applications - 8th Extended Semantic Web Conference, ESWC 2011, Heraklion, Crete, Greece, May 29-June 2, 2011, Proceedings, Part I, ser. Lecture Notes in Computer Science, G. Antoniou, M. Grobelnik, E. P. B. Simperl, B. Parsia, D. Plexousakis, P. D. Leenheer, and J. Z. Pan, Eds., vol. 6643. Springer, 2011, pp. 124–138.
[13] Z. Abedjan and F. Naumann, “Improving RDF data through associa-tion rule mining,” Datenbank-Spektrum, vol. 13, no. 2, pp. 111–120, 2013.
[14] V. Nebot and R. B. Llavori, “Finding association rules in semantic web data,” Knowl. Based Syst., vol. 25, no. 1, pp. 51–62, 2012. [15] K. Kontonasios, E. Spyropoulou, and T. D. Bie, “Knowledge
dis-covery interestingness measures based on unexpectedness,” Wiley Interdiscip. Rev. Data Min. Knowl. Discov., vol. 2, no. 5, pp. 386–399, 2012.
[16] C. C. Aggarwal, C. M. Procopiuc, and P. S. Yu, “Finding localized associations in market basket data,” IEEE Trans. Knowl. Data Eng., vol. 14, no. 1, pp. 51–62, 2002. [Online]. Available: https://doi.org/10.1109/69.979972
[17] Z. Yang, R. Algesheimer, and C. J. Tessone, “A comparative analysis of community detection algorithms on artificial networks,” CoRR, vol. abs/1608.00763, 2016. [Online]. Available: http: //arxiv.org/abs/1608.00763
[18] P. Pons and M. Latapy, “Computing communities in large networks using random walks,” J. Graph Algorithms Appl., vol. 10, no. 2, pp. 191–218, 2006. [Online]. Available: https: //doi.org/10.7155/jgaa.00124
[19] R. de Padua, E. Lédo Silva Jr, L. Pessine do Carmo, V. Oliveira de Carvalho, and S. Oliveira Rezende, “Preprocessing data sets for association rules using community detection and clustering: a com-parative study,” in XIII Encontro Nacional de Inteligência Artificial e Computacional, 2016.
[20] I. T. Jolliffe, Principal Component Analysis, 2nd Edition. New York: Springer, 2002.
[21] M. A. Kramer, “Nonlinear principal component analysis using au-toassociative neural networks,” AIChE Journal, vol. 37, no. 2, pp. 233–243, 1991.
[22] E. Spyropoulou, T. D. Bie, and M. Boley, “Interesting pattern mining in multi-relational data,” Data Min. Knowl. Discov., vol. 28, no. 3, pp. 808–849, 2014. [Online]. Available: https: //doi.org/10.1007/s10618-013-0319-9
[23] Wimmics Research Team, “Covid-on-the-web dataset,” May 2020. [Online]. Available: https://doi.org/10.5281/zenodo.3833753