Supporting information
Population-balance description of shear-induced clustering, gelation and
suspension viscosity in sheared DLVO colloids
Marco Lattuada
&, Alessio Zaccone
$, Hua Wu
§and Massimo Morbidelli
§&
Adolphe Merkle Institute, University of Fribourg, Chemin des Verdiers 4, 1700 Fribourg,
Switzerland
$
Department of Physics, Technische Universität München, 85748 Garching b. München,
James-Franck-Str. 1, Munich, Germany
§
Institute for Chemical and Bioengineering, Department of Chemistry and Applied
Biosciences, ETH Zurich, Vladimir-Prelog-Weg 1, 8093 Zurich, Switzerland
Corresponding authors:
[email protected]
[email protected]
[email protected]
Electronic Supplementary Material (ESI) for Soft Matter.
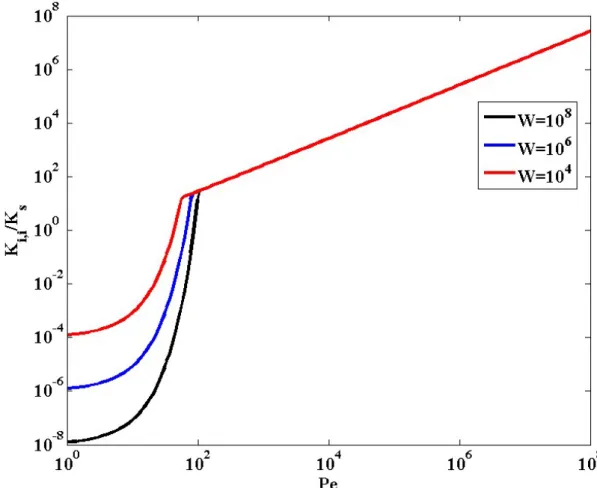
Figure S1 Normalized rate of aggregation for equal size clusters as a function of Pe number, according to
Equation (2) in the main text, for the three different Fuchs stability ratio values W indicated in the legend. Calculations have been performed for a particle diameter equal to 120 nm, particle volume fraction equal to 19% and shear rate equal to 1200 s-1. K
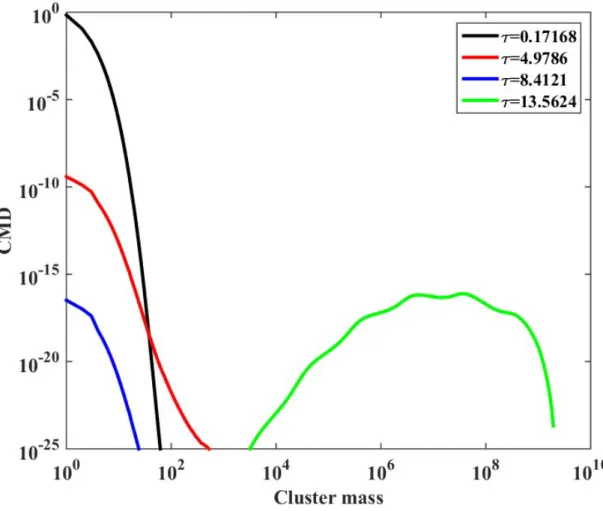
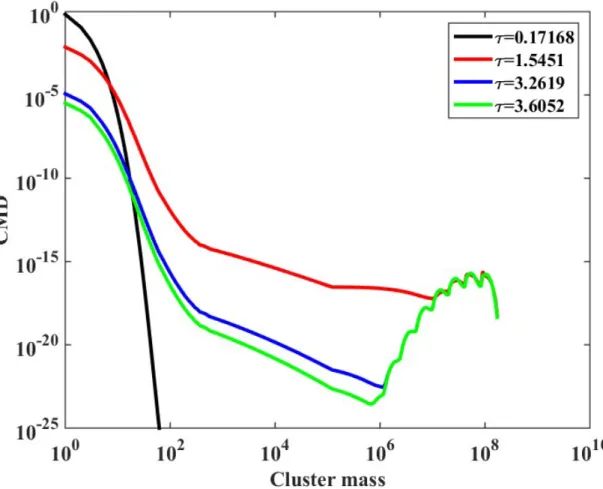
Figure S2 Cluster mass distribution as a function of the cluster mass (expressed as the number of primary
particles), for four dimensionless times indicated in the legend, when aggregation is modeled using the aggregation Kernel given by Equation (2) in the main text. The calculations have been carried out for particle diameter equal to 120 nm, W=105, particle volume fraction equal to 21% and shear rate equal to 1700 s-1. The
Figure S3 Cluster mass distribution as a function of the cluster mass (expressed as the number of primary
particles), for four dimensionless times indicated in the legend, when aggregation is modeled using the aggregation Kernel given by Equation (2) in the main text. The calculations have been carried out for particle diameter equal to 120 nm, W=105, particle volume fraction equal to 21% and shear rate equal to 1700 s-1. The
Figure S4 Cluster mass distribution as a function of the cluster mass (expressed as the number of primary
particles), for four dimensionless times indicated in the legend, when aggregation is modeled using the aggregation Kernel given by Equation (2) in the main text. The calculations have been carried out for particle diameter equal to 120 nm, W=105, particle volume fraction equal to 21% and shear rate equal to 1700 s-1. The
breakage Kernel is expressed by Equation (6) in the main text, with c1=2.38·10-10. Broad fragment mass
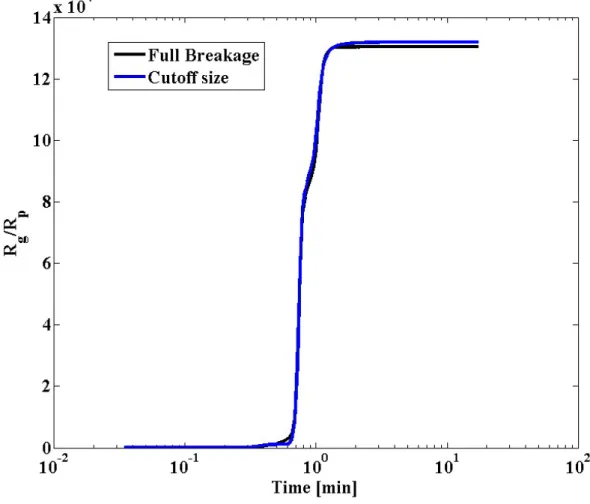
Figure S5a Dimensionless radius of gyration evolution as a function of time, for two different situation:
breakage and aggregation fully active on all sizes, and breakage Kernel expressed by Equation (6) in the main text, with c1=2.38·10-10, and the presence of a cutoff at a given size (RgMax=6.2·104 nm). The calculations have
been carried out for particle diameter equal to 120 nm, W=105, particle volume fraction equal to 21% and shear
rate equal to 1700 s-1, when aggregation is modeled using the aggregation Kernel given by Equation (2) in the
Figure S5b Viscosity profiles as a function of time, for two different situation: breakage and aggregation fully
active on all sizes, and the presence of a cutoff at a given size (RgMax=6.2·104 nm). The calculations have been
carried out for particle diameter equal to 120 nm, W=105, particle volume fraction equal to 21% and shear rate
equal to 1700 s-1, and breakage Kernel expressed by Equation (6) in the main text, with c
1=2.38·10-10, when
Figure S5c Cluster mass distributions as a function of cluster mass, for a few dimensionless time values, as
shown in the legend. In this case aggregation is fully active on all sizes, in the case where the aggregation Kernel is given by Equation (2) of the main text. The calculations have been carried out for particle diameter equal to 120 nm, W=105, particle volume fraction equal to 21% and shear rate equal to 1700 s-1, and breakage
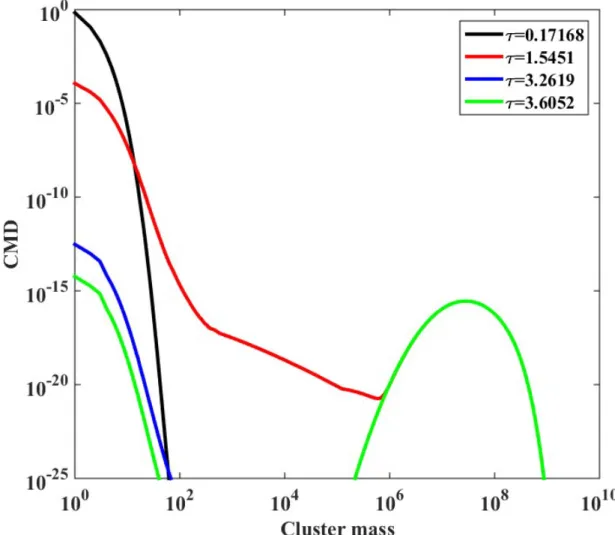
Figure S5d Cluster mass distributions as a function of cluster mass, for a few dimensionless time values, as
shown in the legend, in the case where the aggregation Kernel is given by Equation (2) of the main text. In this case a cutoff at a given size (RgMax=6.2·104 nm) has been imposed. The calculations have been carried out for
particle diameter equal to 120 nm, W=105, particle volume fraction equal to 21% and shear rate equal to 1700 s -1, when aggregation is modeled using the aggregation Kernel given by Equation (2) in the main text.
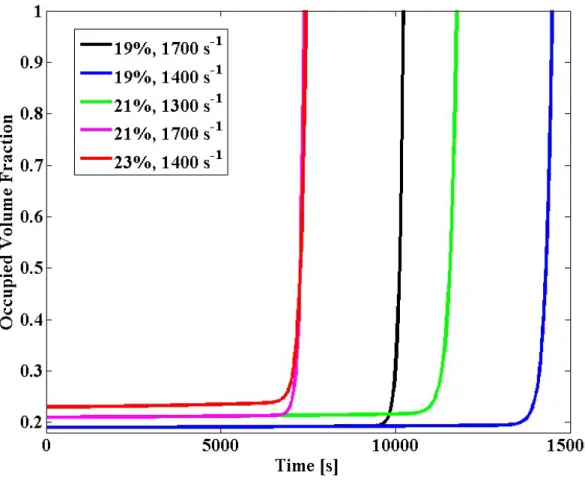
Figure S6 Occupied volume fraction evolution for the same set of data shown in Figure 4 of the main text. The
calculations have been carried out when aggregation is modeled using the aggregation Kernel given by Equation (2) in the main text, with the following stability ratio values: W=1.38·108 for particle volume fraction equal to
19%, W=108 for particle volume fraction equal to 21% and W=6.5·107 for particle volume fraction equal to
Figure S7a Average Scattering Structure Factor as a function of the dimensionless scattering wave vector, for
the time indicated in the legend. The calculations have been carried out for the following conditions: particle volume fraction equal to 21%, fractal dimension equal to 1.8, diffusion-limited aggregation kernel, no breakage.
Figure S7b Average Scattering Structure Factor as a function of the dimensionless scattering wave vector, for
the time indicated in the legend. The calculations have been carried out for the following conditions: particle volume fraction equal to 21%, fractal dimension equal to 2.7, W=108 and simple shear aggregation kernel, with
Figure S7c Average Scattering Structure Factor as a function of the dimensionless scattering wave vector, for
the time indicated in the legend. The calculations have been carried out for the following conditions: particle volume fraction equal to 21%, fractal dimension equal to 2.7, W=108 and simple shear aggregation kernel with