RESEARCH ARTICLE
Comparison of [
18
F]-Tracers in Various
Experimental Tumor Models by PET Imaging
and Identification of an Early Response
Biomarker for the Novel Microtubule Stabilizer
Patupilone
T. Ebenhan,
1M. Honer,
2S.M. Ametamey,
2P.A. Schubiger,
2M. Becquet,
3S. Ferretti,
3C. Cannet,
1M. Rausch,
1P.M.J. McSheehy
31
Global Imaging Group, Novartis Institute of Biomedical Research, 4002 Basel, Switzerland
2
Animal Imaging Center-PET, Center for Radiopharmaceutical Science, Eidgenoessische Technische Hochschule (ETH) Zurich, Wolfgang-Pauli-Strasse 10, 8093 Zurich, Switzerland
3
Oncology Research, Novartis Institute of Biomedical Research, 4002 Basel, Switzerland
Abstract
Purpose: The suitability of [18F]FDG, [18F]FLT, [18F]FET, and [18F]FCH as non-invasive positron emission tomography (PET) biomarkers for monitoring response to chemotherapy was analyzed in various experimental tumor models.
Procedures: Tracer uptake into three syngeneic rodent tumor models and ten human xenograft models was evaluated using semiquantitative analysis of small-animal PET data. Murine RIF-1 fibrosarcomas and [18F]FLT were selected to monitor the effects of the novel cytotoxic
patupilone.
Results: Except [18F]FCH, all tracers provided good tumor visualization. Highest [18F]FDG uptake was identified in syngeneic tumors. Xenograft models, however, showed low [18F]FDG SUVs and were better visualized by [18F]FLT. Monitoring the effects of patupilone on [18F]FLT uptake in RIF-1 tumors revealed a significant decrease of tracer uptake after 24 h, which strongly negatively correlated with apoptosis.
Conclusion: [18F]FLT PET of experimental tumors is a viable complement to [18F]FDG for preclinical drug development. [18F]FLT may be an excellent biomarker for patupilone-induced apoptosis.
Key words: PET, [18F]FDG, [18F]FET, [18F]FCH, [18F]FLT, Tumor xenografts, Quad-HIDAC, Biomarker, Patupilone
Introduction
N
on-invasive imaging of molecular and biological processes in living subjects with positron emissiontomography (PET) provides exciting opportunities to mon-itor metabolism and detect diseases in humans and in small animal models [1]. The first oncological application using 2-deoxy-2-[18F]fluoro-glucose ([18F]FDG) for PET imaging of tumors was almost 25 years ago [2]. Since then, [18F]FDG has become indispensable for the detection and grading of tumors and is also increasingly used for the monitoring of tumor response to therapy [3–5]. Radiolabelled thymidine,
T. Ebenhan and M. Honer contributed equally to this work.
amino acid or choline derivatives such as 3′-deoxy-3′-[18
F] fluorothymidine ([18F]FLT), [18F]fluoro-ethyl-L-tyrosine
([18F]FET) or [18F]fluorocholine (N,N-dimethyl-N-[18 F]fluo-romethyl-2-hydroxyethylammonium ([18F]FCH) are alterna-tive PET tracers for tumor diagnosis because these compounds monitor biochemical pathways of cell prolifer-ation [6], protein synthesis [7] or membrane assembly [8].
Thymidine is a component consumed by rapidly growing cells via a salvage pathway for incorporation into DNA [9]. After using different nucleoside transporters, thymidine is directly phosphorylated by thymidine kinase-1 (TK-1), which is exclusively expressed in S-phase and further metabolized into thymidine triphosphate, acting as a substrate for DNA polymerase [10]. [18F]FLT, an [18F]-labelled analogue of thymidine, has become an important and promising tracer in oncology research and clinical practice aside from [18F]FDG [11–16]. Tumor uptake and retention of [18F]FLT should thus be a good biomarker of tumor cell proliferation and is considered to be less influenced by tumor blood flow and nontumor cell metabolism as has been observed for [18F]FDG [17].
[18F]FET is a fluoro-ethylated derivative that is not metabolized or incorporated into proteins, contrary to its template amino acid tyrosine. Sodium-independent amino acid transporters are responsible for high [18F]FET accumulation in tumor cells [18]. A successful labeling method and first data in vitro as well as distribution in a patient were demonstrated by Wester et al. [19]. Results from larger groups of patients with [18F]FET are part of the recent literature from 2005/2006 [20, 21], and intensive preclinical research with a more mechanistic focus was done on brain tumor models such as C6 rat glioma [22, 23]. It has also been shown that [18F] FET selectively accumulates in tumors and not in inflam-matory tissues [24].
Choline and the fluorinated analogue [18F]FCH are similarly transported into mammalian cells followed by phosphorylation, interacting with choline kinase, which is up-regulated in tumor cells. Choline is then metabolized to phosphatidylcholine, an essential cellular compound needed to assemble membranes [8]. Initial work, using [11C]choline and [18F]FCH as PET tracers to demonstrate the diagnostic potential of these compounds, i.e., diagnosing prostate tumors as well as lung and brain tumors, has been done by Degrado et al. [25,26] and Hara et al. [27–30].
The purpose of this study was to evaluate potential PET tracer candidates besides [18F]FDG for determining the optimal biomarker for each of various drug development candidates with different mechanisms of action. This was prompted by our observations that human tumor xenografts in athymic nude mice have a low and heterogeneous [18F]FDG uptake per se [31], which may limit the sensitivity of this approach in xenografts. In this report, the standardized uptake values (SUV) of [18F]FLT, [18F]FET, and [18F]FCH were compared with [18F]FDG in various experimental tumor models comprising syngeneic rodent tumors and human tumor xenografts. Comparisons suggested that in these experimental models, [18F]FLT was the best tracer since it
provided the highest and most consistent uptake in tumors. As an example of the application of these pre-clinical compar-isons of different tracers, we chose to use [18F]FLT PET imaging to monitor the effect of the novel cytotoxic compound patupilone (aka Epothilone B, EPO906). Patupi-lone is a potent microtubule stabilizer [32] currently in phase II/III clinical development for several different types of solid tumor [33] and shows strong anti-proliferative action induc-ing apoptosis in vitro and in vivo [32,34]. To test the effect of paputilone on [18F]FLT tumor uptake, we chose the s.c. murine RIF-1 tumor model, since Leyton et al. [35] had shown sensitivity for this model using [18F]FLT as a biomarker to monitor the early effects of treatment of another cytotoxic, cisplatin. Furthermore, this model was (a) highly sensitive to patupilone giving the chance of large changes in [18F]FLT uptake, (b) tolerated the drug very well, thus minimizing drop-out from the PET experiment over 6 days, and (c) was easily amenable to ablation and thus subsequent analysis ex vivo allowing correlation between PET and immunohistochemistry (IHC). The identification of [18F]FLT as a non-invasive PET biomarker of tumor response to patupilone would facilitate development of this compound and any future clinical application of the compound.
Materials and Methods
Radiopharmaceuticals
[18F]FDG was obtained from the commercial [18F]FDG production of
the University Hospital Zurich with a specific activity of ca. 1,000 GBq/μmol. [18F]FLT was produced in-house at the Department of Radiopharmaceutical Science of the Federal Institute of Technology of Zurich (ETH) according to the procedure reported by Kim et al. [36]. The specific activity was ca. 250 GBq/μmol. [18F]FET and [18F] FCH were provided by University Hospital Zurich with specific activities of ca. 200 GBq/μmol and 100 GBq/μmol, respectively. [18F]
FET was produced using the method published by Wester et al. [19], [18F]FCH was synthesized as described by Spaeth et al. [7].
Animal Handling
All experiments were carried out according to procedures covered by permit numbers (BS 1974/75) and approved by the Kantonales Veterinäramt Zurich and strictly adhered to the Federal animal protection law and the“Eidgenössische Tierschutzverordnung”.
Female Brown-Norway (BN) rats, C3H/He and C57BL/6 mice were obtained from Charles River (France) and female Harlan Hsd: Npa nu/nu (nude) athymic mice were obtained from the Novartis breeding stock. Rats weighed between 135 and 180 g, whereas mice weighed 20–30 g prior to experiments. Depending on the growth rate of the tumor, animals were shipped to the imaging facility site 2–4 weeks after preparation, using appropriate transfer conditions.
All animals were randomized based upon body weight and tumor volume measured beforehand by calipers. Animals were identified by tail and back labels or shaving and kept in groups of six to ten mice or three to five rats, respectively, under normal
conditions with access to food and water ad libitum. Animals were killed by CO2inhalation (mice) or decapitation (rats).
Tumor Models
Mouse B16/BL6 metastatic melanoma were created as described [37]. Cells were cultured in supplemented minimum essential medium (2 mmol/L glutamine, 5% fetal calf serum (FCS), 1% sodium pyruvate, 1% nonessential amino acids, and 2% vitamins) and kept at confluence for 4–5 days (with a medium change every 48 h) before resuspension in Hank’s balanced salt solution (+10% FCS). Using a Hamilton syringe, 5×10⁴cells were injected intradermally (i.d.) in a
volume of 1μL into the dorsal pinna of both ears of anesthetized C57BL/6 mice. After 1 week, the primary tumor was visible as a black dot in the middle of the ear, and after 10 days, the cervical lymph node metastases were detectable by palpitation. Mice were used for PET studies ca. 14 days after cell inoculation.
Murine RIF-1 fibrosarcoma cells were obtained as a gift from Ms Loreta Rodrigues (St George’s Hospital Medical School, London, UK). Cells were cultured in RPMI medium supplemented with 10% FCS and 5 × 10⁶ cells per mouse were injected
subcutaneously (50 μL phosphate-buffered saline (PBS)) in the upper thigh of anesthetized female C3H/He mice. After 10–14 days, tumors were of sufficient size for PET studies.
BN472 rat mammary carcinoma tumors were created by transplantation of tumor fragments as described [38]. Briefly, frozen tissue or fresh tumor samples from earlier in-house studies were washed sterilely in saline containing 100μg/mL gentamicin and then placed in a Petri dish containing Ham’s F-12 medium with 100 μg/mL gentamicin and 10% FCS. The tumor tissue was divided into small pieces (3×3×3 mm), and one piece was inserted into a hole made by a 22-gauge sterile needle in the lowest mammary fat pad of anesthetized rats after wiping the skin with 70% alcohol. The hole was closed with two metal wound clips which were then removed after 3–4 days.
The human NSCLC cell line NCI-H-460 was obtained from the American Type Culture Collection and a stable luciferized version created in Novartis by retroviral infection. Using athymic nude mice, two different brain tumor models were evaluated as follows. (1) H-460-Luc cells (5 × 10⁴ in 10 μL PBS) were injected intracranially (i.c.) in the cortex. (2) Orthotopic lung model with spontaneous metastases to the lymph-nodes as well as brain: H-460-Luc cells (105 in 100 μL of Ca and Mg-free PBS) were injected into the pleural cavity. This number of cells permitted growth over a reasonable time without impacting too rapidly on mouse health, and lymph-node metastases (neck and legs) including some micro brain metastases appeared ca. 2 weeks later. Prior to PET experiments, growth was monitored non-invasively using the IVISTM-imaging system (Caliper, USA), and quantifica-tion of light emission was made with the Living ImageTMv2.20 software package by injecting the mice i.p. with 150 mg/kg ofD -Luciferinin in PBS (10 ml/kg) 15–20 min prior to imaging. Shipment to the PET imaging facility was done when the bioluminescent (BioL) signal was9106photons/s (5–7 days post cell injection).
The human NSCLC cell line NCI-H-596 was grown in RPMI-1640 medium supplemented with 10% FCS and 1% glutamine. Cells were grown to confluence before trypsination and re-suspension in Ca2+- and Mg2+-free PBS. Cells were injected s.c. in the flank of athymic nude mice at a concentration of 5×10⁶cells per animal in a volume of 50μL in PBS under anesthesia. After 6–12 weeks growth,
tumors were transplanted by ablating the tumor and dissecting the nonnecrotic material in culture medium. In a sterile environment, 40 mm3of solid tumor material was placed s.c. into fresh mice under anesthesia. Further passages of the tumor were made by transplantation. All other human tumor xenografts grown in athymic nude mice were created by injection of cells. Various different cell lines (HCT-116 colon carcinoma, NCI-H-460 lung adenocarcinoma, KB-31 cervical epidermoid carcinoma, DU-145 prostate carcinoma, HT-29 colon adenocarcinoma, SKOV-3 ovarian carcinoma and U87 MG glioblastoma) were grown in high glucose medium (Dulbecco’s modified essential medium) supplemented with 10% FCS, 1% glutamine, 1% sodium pyruvate, and the 1% antibiotics (penicillin and streptomycin). At confluence, cells were trypsinized and injected s.c. (dorsal axillary region) in 50–100 μL (≥2×10⁶
cells) of PBS (Na+- and Mg2+-free) in the anesthetized animal. In general, tumors grown at the skin were allowed to reach sizes of ≥200 mm3 prior to PET imaging. However, due to different growth rates of the tumor models and the availability of scanner time, sometimes smaller tumors were used of 50–100 mm3
and occasion-ally 10–50 mm3 particularly for the i.c. tumors (H-460-Luc). However, in all cases, the PET system used (see below) was able to visualize these tumors with the appropriate tracer.
Drug Preparation and Treatment
Patupilone was obtained from Chemical Development, Novartis (Basel, Switzerland), and the powder was stored at −20°C. It was freshly prepared on each treatment day by dissolving in polyethylene glycol-300 (PEG-300) and then diluting with physiological saline (0.9% (w/v) NaCl) to obtain a mixture of 30% (v/v) PEG-300 and 70% (v/v) physiological saline for i.v. administration in the tail vein. The injection volume was 5 mL/kg for mice and 2 mL/kg for rats. Treatment with vehicle (PEG-300/saline) or patupilone was once weekly.
Several different experiments were performed with patupilone, where mice were treated i.v. with either patupilone (1–5 mg/kg) or the patupilone-vehicle (vehicle). In the two BioL experiments using human H-460-Luc cells in athymic mice (Fig. 1), animals were divided into two groups (n=10 per group) and were treated once with vehicle or patupilone (4 mg/kg). In the dose–response experiment using murine RIF-1 tumors, mice were divided into four groups (n=8 per group) and treated once with vehicle or patupilone at 1, 3, or 5 mg/kg (Fig.7). For the longitudinal [18F] FLT experiment with extensive IHC (Figs. 8 and 9), mice were divided into two groups (n=20 per group) and treated with vehicle or patupilone (5 mg/kg). The same mice were studied by PET at baseline (day 0) as at 24 h when the mice were killed and the tumors ablated for IHC. The remaining 30 mice (five mice for each treatment group) were studied by PET prior to IHC at the subsequent three different time points posttreatment. This experimental protocol permitted correlation of IHC with [18F]FLT at each time point posttreatment.
Animal Monitoring
During the experiments, body weight (BW in grams) and tumor volume (TVol in cubic millimeter) were measured three times per week. Tumor dimensions were measured using a caliper, and TVol was calculated by the following equation: TVol=(pi/6) ×x×y×z, where x, y, and z represent the three orthogonal axes of the tumor. Efficacy was assessed as the T/C from the change (subtraction) in
TVol from day 0 (patupilone treatment) to the endpoint (at 1 week posttreatment initiation), T/CTVol=ΔTVol(treated)/ΔTVol(control). In a
similar manner, the effect of the drug on BW was also quantified, i.e., the fractional change in BW,ΔF-BW (BWafter/BWbefore), for
both vehicle-control and drug-treated groups was determined and applied as follows: T/CBW=ΔF-BW(treated)/ΔF-BW(control).
Small Animal PET Study, Image Acquisition,
and Reconstruction
All PET experiments were performed at the Animal Imaging Center of ETH Zurich at the Center for Radiopharmaceutical Science using the Fig. 1. Growth of human lung H-460-Luc cells in athymic nude mice as assessed by bioluminescence and the effect of patupilone. H-460 cells stably expressing the enzyme luciferase were injected intracranially or orthotopically (pleural cavity of lung) as described in“Materials and Methods”. Luciferin (150 mg/kg) was injected intraperitoneally 15–20 min prior to image
acquisition using the IVISTM imaging system. Mice were treated once by patupilone (4 mg/kg i.v.) on day 5. BioL, in photons/ sec, is expressed as mean±SEM (n=10) per group (open squares vehicle, filled circles PAT-treated) where asterisk signifies significantly different (PG0.05) from vehicle at all time points posttreatment. Figures show BioL quantified at different time points from a the head following i.c. injection, and b the lung following pleural injection and an example of the BioL in a mouse 12 days after cell injection in the pleural cavity of the lung (c).
Table 1. Summary of [18F]FDG, [18F]FLT, [18F]FET, and [18F]FCH SUVs in various experimental rodent tumor models
SUV ratio [18F]FDG versus
Tumor model (histotype) Species (host) [18F]FDG SUVa TVol (mm3)a [18F]FLT SUVa TVol (mm3)a B16/BL6 ortho (Melanoma) Mouse (C57BL/6) 2.06±1.13 (19) 93±62 0.27±0.04 (8) 295±234 RIF-1 s.c. (Fibrosarcoma) Mouse (C3H-He) 0.62±0.21 (4) 295±112 0.56±0.22 (16) 1480±1102 BN472 ortho (Breast) Rat (BN) 0.85±0.21 (63) 1952±1760 0.43±0.09 (6) 10664±3020
H-460 ortho (NSCLC) Human (Nude mice) nd (12) – 0.56±0.06 (4) 249±103
H-460 i.c. (NSCLC) Human (Nude mice) nd (6) – 1.32±0.34 (7) 14±9
H-460 s.c. (NSCLC) Human (Nude mice) 0.22±0.08 (4) 455±65 0.72± 0.24 (8) 307±223 H-596 s.c. (NSCLC) Human (Nude mice) 0.22±0.05 (38) 275±170 0.70±0.16 (68) 237±123 HCT-116 s.c. (Colon) Human (Nude mice) 0.22±0.04 (43) 59±40 0.74±0.13 (48) 68±57 SKOV-3 s.c. (Ovarian) Human (Nude mice) 0.26±0.02 (4) 307±129 0.44±0.08 (5) 346±244 U87MG s.c. (Glioma) Human (Nude mice) 0.55±0.16 (9) 101±81 0.37±0.09 (18) 479±120 HT-29 s.c. (Colon) Human (Nude mice) 0.18±0.02 (2) 234±76 0.53±0.08 (5) 172±93 KB-31 s.c. (Cervix) Human (Nude mice) 0.19±0.04 (17) 261±143 0.38±0.07 (5) 437±421
DU-145 s.c. (Prostate) Human (Nude mice) 0.25 (1) 480 – –
An empty cell means not measured
SUV standardized uptake value, TVol tumor volume as calculated by ROI analysis (PMOD), ortho orthotopic, i.c. intracranial, s.c. subcutaneous, nd not detectable
a
dedicated 16-module quad-HIDAC tomograph with a sub-millimetre resolution (Oxford Positron Systems; Weston-on-the-Green, UK) [38,
39]. The field of view of 280 mm axially and 170 mm in diameter allowed the acquisition of whole animal body images in a single bed position. For each tracer, extensive PET experiments were performed beforehand to determine the optimal injection and acquisition protocol. These analyses revealed that the use of fasting protocols and anesthesia during the tracer distribution and uptake phase did not significantly increase tracer accumulation. In contrast, these protocols rather enhanced the variability of tracer uptake since fasting states and anesthesia levels cannot be fully harmonized in a cohort of animals. Therefore, each tracer (5-30 MBq; 150μL) was injected i.v. in the nonfasted, restrained animal allowing distribution and accumulation of the radiotracer in the non-anesthetized animals, i.e., under physiolog-ical conditions. For injection into mice, sterile 25-gauge needles were used. For rats, catheter-assisted injections were performed (Vasofix, Braunüle™). In both cases, injected doses were precisely quantified by measuring syringes before and after radiotracer application. Animals with problematic or questionable injections were excluded from the quantitative analysis. Following tracer injection; at 8 min for [18F]FCH and [18F]FET or at 20 min for [18F]FDG and [18F]FLT; the animals were anesthetized with isoflurane (Forene, Abbott Laboratories; North Chicago, USA) in an air/oxygen mixture and fixed on the scanner bed (routinely two mice or one rat), and PET acquisition was initiated 15 min ([18F]FET, [18F]FCH) or 30 min ([18F]FDG, [18F]FLT) after injection. A warm air stream was used to assure thermostasis at 37°C body temperature, measured by a rectal sensor. Depth of anesthesia was controlled by monitoring respiratory frequency using a dedicated thorax belt.
Raw data files were acquired in list-mode and reconstructed in single time frame using the OPL-EM algorithm (i.e., voxel size of 0.125 mm3 and matrix size of 120×120×100 for mouse double scanning and 240× 240×200 for rats) [40]. Reconstruction did not include scatter, random, and attenuation correction. A simultaneous Na-22 point source measurement was used as internal standard to correct the reconstructed image data sets for possible variabilities in scanner sensitivity.
Image Analysis and Quantification
Reconstructed PET images were visually inspected in three dimen-sions throughout the body and evaluated by a region-of-interest (ROI) analysis using the dedicated biomedical image quantification software PMOD (Pmod Technologies Ltd, Adliswil Switzerland) [41]. ROIs were drawn manually in all coronal slices comprising the tumor, thus providing volume and average activity concentration of the entire tumor. The average activity concentration in the tumor was
then normalized to the injected dose per body weight and expressed as an average standardized uptake value. An alternative approach using the 5% hottest voxels to provide the“maximum SUV” in a tumor was not found to be superior, and experience showed it gave the same results for compound effects on the various tracers.
Tumor Dissection, Histology,
and Immunohistochemistry Analysis of Ki67,
Proliferating Cell Nuclear Antigen, and Caspase-3
In the [18F]FLT experiment, the activity of patupilone was monitored, and histology and immunohistochemistry were per-formed at several time points of 1, 2, 3, and 6 days posttreatment (n=10 mice per time point). The mice were killed by CO2inhalation,
and tumor slices were harvested from the largest circumference of the tumor, fixed in 4% phosphate-buffered formaldehyde for 24 h at 4°C, and processed into paraffin as previously described [38].
IHC was performed on paraffin sections and used the following antibodies for detection of: (1) Caspase-3, (ASP175, Cell Signal-ling, Danvers, MA, USA), (2) proliferating cell nuclear antigen (PCNA; ab29, Abcam, Cambridge, UK), and (3) Ki67 antigen (ab833, Ki67 at 1:100—Abcam, Cambridge, UK).
Microwave-assisted antigen retrieval was carried out for 20 min (caspase-3 and PCNA) or 40 min (Ki67) in 10 mM citrate buffer, pH 6.0. After washing in Tris-buffered saline (TBS), endogenous peroxidase was quenched with 0.5% H2O2in methanol for 20 min
at room temperature. Slides were further incubated with primary antibody: (1) overnight (room temperature) caspase-3 diluted 1/75 or Ki67 diluted 1/100 and (2) 1 h (room temperature) with PCNA diluted 1/2,000. Negative controls were incubated without primary antibody. After washing in TBS, sections were incubated with biotinylated serums followed by avidin–biotin horseradish peroxi-dase complex (Dako, Glostrup, Denmark). Peroxiperoxi-dase activity was visualized by incubation in a solution of 3.3′-diaminobenzidine tetrahydrochloride (Medite, Nunningen, Switzerland). Sections were counterstained with Mayer’s hematoxylin and mounted with Pertex (Medite). Slides were examined with a light microscope (Nikon, Eclipse 600) equipped with a motorized stage, connected to a 3CCD color video camera (Sony, DXC-970 MD). Detection of apoptotic or proliferating nuclei was done automatically using the software “Histolab” (Microvision Instruments). Approximately three to nine frames, covering approximately 10% of the total tumor area, were captured at ×400 magnification in a nonnecrotic and nonhemor-rhagic area. The color corresponding to the apoptotic or proliferating nuclei staining and to the non-apoptotic or nonproliferating nuclei
[18F]FET SUVa TVol (mm3)a [18F]FCH SUVa TVol (mm3)a SUV ratio [18F]FLT [18F]FDG [18F]FET Versus tracer [18F]FCT
0.84±0.16 (4) 339±142 0.54±0.06 (3) 184±51 0.13 0.41 0.26 0.59±0.08 (4) 259±88 0.39±0.06 (4) 128±49 0.90 0.95 0.63 0.64±0.08 (5) 21353±7824 0.27±0.05 (5) 16686±5620 0.51 0.75 0.32 – – – – – – – 0.75±0.21 (3) 6.9±4.3 nd (4) – – – – 0.61±0.28 (8) 303±178 0.21±0.07 (8) 212±149 3.27 2.77 0.95 0.73±0.04 (4) 190±12 nd (4) – 3.18 3.32 – 0.42±0.06 (4) 207±154 0.20±0.01 (4) 108±81 3.36 1.91 0.91 – – – – 1.69 – – – – – – 0.67 – – – – – – 2.94 – – – – – – 1.73 – – – – nd (6) – – – –
one were defined by using the HSI color space, and the percentage of apoptotic or proliferating nuclei was calculated.
Graphics and Statistics
Figures and Table show the mean±SEM, unless stated, and the significance value was set at PG0.05. To test reproducibility of the tracer uptake over more than two studies, a one-way analysis of variance (1W-ANOVA) was performed. To determine the significance of the effect of patupilone treatment, differences between the means of the various parameters measured (TVol, BW, FLT, caspase-3, Ki67, and PCNA) were determined using the raw values, and a 1W- or 2W-ANOVA as appropriate with Tukey post hoc. In addition, the effects at different time points were summarized as the treatment/vehicle–control ratio (T/C), i.e., mean value of drug-treated group divided by the mean value of the control group. Correlation between IHC ex vivo and [18F] FLT in vivo was tested by linear regression to provide the R and P
values. All analyses used the SigmaStat v3.1 software. To correct for multiple correlations in the large [18F]FLT IHC experiment (six were made of [18F]FLT versus Ki67, PCNA and, caspase-3 on day 1 and on all time points pooled), a Bonferroni test was applied, i.e., P value multiplied by six.
Results
Tumor Growth
The human tumor s.c. models (H-460, HCT-116, KB-31, DU-145, HT-29, SKOV-3, U87 MG) xenografted into nude athymic mice grew with a doubling time of 2–4 days, and tumors reached a suitable size for imaging 2–3 weeks post cell injection or transplantation (see, for example, O’Reilly et al 2008 [42]). The exception was the H-596 model which grew much more slowly, only doubling in size every 7–
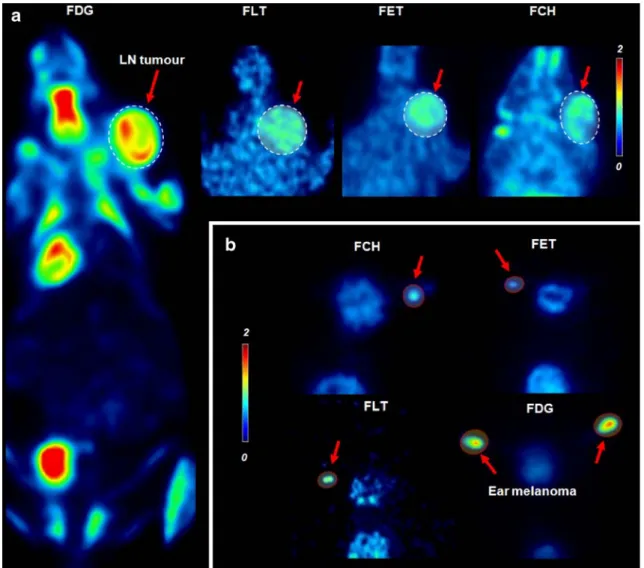
Fig. 2. Tracer uptake in the syngeneic B16/BL6 melanoma tumor model (C57BL/6 mice): a lymph-node metastases and b primary ear tumors. Results show a [18F]-PET biodistribution of the tracer in a representative coronal slice of the mouse
including lymph node tumor metastases as highlighted in the red box in the right neck area. Red arrows indicate the different tracers in the tumor. Related coronal slices of [18F]FLT, [18F]FET, and [18F]FCH are shown in the smaller images only showing head/neck area including lymph node (LN) metastases. Ear melanomas measured with all tracers (b) appeared as spots on coronal slides (crop of the head/neck area). All images are normalized to the same SUV color scale.
10 days. The syngeneic rodent tumor models also had doubling times of 2–3 days as has previously been described for B16/BL6 [37], RIF-1 [43], and BN472 [34]. The models where human lung H-460-Luc cells were grown intracrani-ally (i.c.) or orthotopicintracrani-ally have not previously been described, and their growth as monitored by biolumines-cence and the effect of a single dose of patupilone (4 mg/kg i.v.) is shown in Fig. 1. In both models, BioL was quantifiable ca. 5 days after cell injection and, if the mice were untreated, tumor growth proceeded rapidly, and mice had to be culled 12–14 days post cell injection.
FDG Uptake
We had previously observed that [18F]FDG PET of the human tumor models H-596, KB-31, and HT-29 showed rather low tracer uptake [31]. Here, we have screened additional tumor models for [18F]FDG uptake and compared them as shown in Table1. [18F]FDG SUV did not correlate with the respective tumor volume as demonstrated by linear regressions for each tumor model (R≤0.2, P90.2).
The results showed large differences in [18F]FDG SUV when compared across the different tumor models. Highest [18F]FDG uptake was identified in the syngeneic orthotopic models of B16/BL6 (Fig.2a, b) and BN472 (Fig.3a) and also in the RIF-1 model (Fig. 3b), which could be considered orthotopic because it is a fibrosarcoma grown s.c. All the other ten models tested were human tumor xenografts grown in nude athymic mice and showed low [18F]FDG SUVs of 0.18–0.26, apart from the s.c. glioma U87 MG tumor model, which
provided a good tumor visualization (mean SUV of 0.55). In general, human tumor xenografts showed a higher tracer activity accumulation in the tumor rim compared to the central area (Figs.4and5), and the tracer uptake became increasingly rim-limited as the tumor became larger. Thus, although the tumors could be distinguished from their respective back-ground and surrounding tissue, the relatively low uptake meant that determination of a significant drug-induced decrease in [18F]FDG would be difficult unless these were large effects of at least 30%. In the human lung tumor H-460-Luc grown orthotopically or intracranially (i.c.), no [18F]FDG uptake was measurable at all (Fig. 4a, c), and there was no correlation between [18F]FDG and TVol (R≤0.18, P≥0.27).
Uptake of [
18F]FLT, [
18F]FET, and [
18F]FCH
Table 1 summarizes the data, and original representative images are shown in Figs.2,3,4, and5. Seven different tumor models (B16/BL6, RIF-1, H-596, BN472, H-460-Luc i.c., HCT-116, H-460 s.c.) were compared for uptake of the tracers [18F]FLT, [18F]FET, and [18F]FCH. Moreover, additional tumor models (H-460 ortho, SKOV-3, U87 MG, HT-29, and KB-31) underwent [18F]FLT PET to attain further information for this particular tracer and to compare it with [18F]FDG. Finally, the mean SUVs of the different tracers were expressed as ratios to their respective [18F]FDG SUV as also shown in Table1to compare relative uptake of the tracers.In contrast to the results for [18F]FDG described above, relatively low [18F]FLT uptake was observed for the two syngeneic orthotopic tumors of BN472 in rats (Fig.3a) and
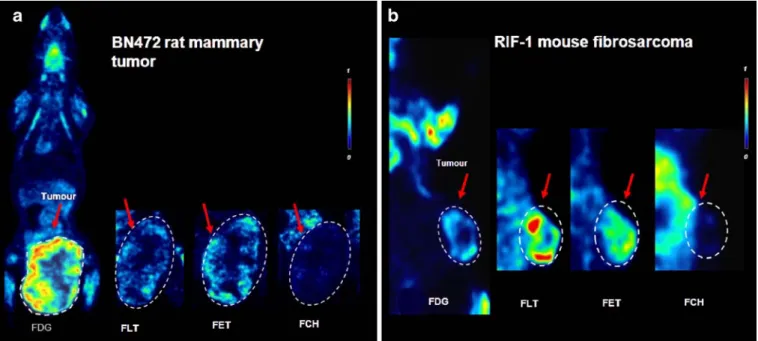
Fig. 3. Tracer uptake pattern into a rat BN472 mammary tumors (BN rats) and b RIF-1 mouse fibrosarcoma (C3H/He mice). Results shown for a and b are prominent [18F]FDG PET images displaying the typical biodistribution of the tracer in a representative coronal slice, including the tumor highlighted in a red box. Red arrows indicate the different tracers in the tumor. Related coronal slices of [18F]FLT, [18F]FET, and [18F]FCH are displayed as cropped images, including only the tumor area (lower belly or right flank). All images are normalized to the same SUV color scale.
B16/BL6 in mice (Fig. 2a, b), even though for the latter model, the primary (ear) and main metastases (cervical lymph node) could be clearly visualized. A comparison of the [18F]FLT and [18F]FDG uptake (SUVs) in the same model to give an [18F]FLT/[18F]FDG ratio permitted comparison between models to emphasize that some models apparently metabolized [18F]FDG more than [18F]FLT, while for others, the opposite was the case. Thus, in the BN472 and B16/BL6 models, the [18F]FLT/[18F]FDG ratios were 0.51 and 0.13, respectively, indicating more [18F]FDG than [18F]FLT uptake. The other syngeneic orthotopic model, RIF-1 in mice, provided good visualization by [18F] FLT; ([18F]FLT/[18F]FDG ratio = 0.9) and in all three models, the [18F]FLT uptake was fairly consistent. Again, in marked contrast to the results for [18F]FDG, the s.c. human tumor xenografts in athymic mice had a reasonable accumulation of [18F]FLT (SUV range of 0.37–0.78) and
consequently higher [18F]FLT/[18F]FDG ratios of 1.7–3.3, the exception being U87MG, which had the lowest values for [18F]FLT uptake but the highest values for [18F]FDG of the s.c. xenografts. In general, the xenograft images for [18F] FLT were fairly heterogeneous and“spotty,” i.e., regions of high and low intensity distributed across the tumor but not necessarily rim-limited (Figs.4 and5).
The tumor model with the strongest [18F]FLT uptake was the human H-460 lung tumor grown i.c. in nude mice, with a very intense tracer accumulation (SUV of 1.3) providing excellent visualization (Fig.4a), much better in comparison to the same tumor grown orthotopically in the mouse lung (Fig. 4c). This tumor was poorly visualized by [18F]FDG also when grown s.c. (Fig.4b). It could be detected by [18F] FET but rather poorly by [18F]FCH (Fig.4).
In general, [18F]FCH provided very poor visualization (Figs. 2, 3, 4, and 5), with by far the best tracer uptake
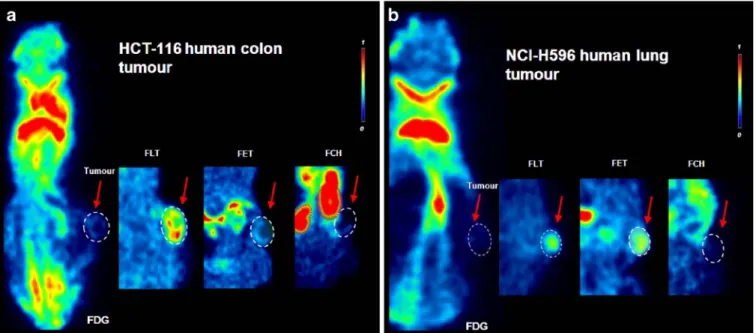
Fig. 4. Tracer uptake pattern into athymic nude mice bearing H-460 human lung tumor. The H-460 tumor grown a intracranially, b subcutaneously, and c orthotopically in the lung. Images in b and c are normalized to the same SUV color scale. Results show a [18F]FDG PET performed on i.c. growing tumors, displaying biodistribution of the tracer in a representative coronal slice including tumor (no visualization by [18F]FDG), as highlighted in the red box in the brain/neck area.
Red arrows indicate the tumor for each tracer. Related coronal slices of [18F]FLT, [18F]FET, and [18F]FCH are shown in the cropped images, only focussing on the brain area, partly including tracer uptake in the tumor. Visualization of tumors from cells growing s.c. (b) are indicated (right flank area) on a single coronal slice for each tracer for direct comparison. c A series of merged coronal slices, including [18F]FDG (green/blue signal) and [18F]FLT (red signal) information for differentiation of heart muscle tissue from solid lung tumor tissue. Moreover, three representative coronal slices for both [18F]FDG and [18F]FLT displaying midbrain overview are shown in order to reveal possible brain metastases of this particular tumor model.
Fig. 5. Tracer uptake into athymic nude mice bearing human s.c. xenografts. Representative coronal slices are shown including a central display of the tumor of a HCT-116 colon carcinoma and b H-596 lung tumor. Results shown in a and b summarize [18F]FDG PET displaying biodistribution of the tracer including the tumor, highlighted in the red box. Red arrows indicate the different tracers for each tumor: [18F]FLT, [18F]FET, and [18F]FCH are shown in the smaller images only showing the
areas including tumors (sometimes showing organs such as kidneys). All images are normalized to the same SUV color scale.
Fig. 6. Examples of the reproducibility of [18F]FDG and [18F]FLT in experimental tumor models. Results show individual [18F] FLT and [18F]FDG SUVs and the associated mean±SEM in three different tumor models from several independent experiments over 3 years. a Five studies with BN472 for [18F]FDG, b four studies with H-596 using [18F]FLT, c three studies each with HCT-116 for [18F]FDG, and d for [18F]FLT. Differences between means in each graph were tested using a 1W-ANOVA with Tukey post hoc; *P=0.01 between Exp-3 and Exp-4 using [18F]FLT on H-596 tumors. Data are also summarized in Table1.
detectable in the B16/BL6 model (ear and lymph node). In the other models, tumors were detectable using [18F]FCH in only five out of the eight models investigated (Table 1). Visualization of tumors with [18F]FET was possible in all seven models and was fairly invariant across the different models (SUV 0.42–0.84), although images were “spotty” and showed low intensity. The highest uptake was again in the B16/BL6 model (Fig. 2a, b), where both the primary tumor and metastases could be seen.
In summary, of the four tracers compared in these experimental models, [18F]FLT appeared to be the best PET tracer since it provided good visualization in all models with sufficient tracer uptake to expect feasible detection of drug-induced decreases in SUV.
Reproducibility of [
18F]FDG and [
18F]FLT
Uptake in Several Different Studies
Both [18F]FDG and [18F]FLT were used in several different PET studies over 3 years. In order to attain an idea of the
inter-experimental variability over this time, the SUVs were compared in rat BN472 tumors and the two human tumor xenografts of H-596 and HCT-116 in athymic nude mice. As Fig. 6 shows, the intra-experimental variability was greater than the inter-experimental variability so that the mean SUVs were fairly invariant over time, and only one (minor) statistically significant difference was detectable, between two of the four [18F]FLT experiments using H-596 tumors.
[
18F]FLT Response to Anticancer Therapy
with Patupilone in RIF-1-Bearing C3H Mice
Patupilone dose-dependently inhibited growth of RIF-1 tumors giving, after 6 days, a T/CTVol of 1.0, 0.40, and0.26 for the doses of 1, 3, and 5 mg/kg, respectively (Fig.7a). Treatment was well tolerated with no body-weight loss over the whole treatment period, but a dose-dependent effect was apparent in comparison to vehicle: T/CBW=0.99,
0.95, and 0.90 for 1, 3, and 5 mg/kg, respectively (Fig.7b). Thus, the highest patupilone dose of 5 mg/kg was selected for the [18F]FLT PET experiment.
A preliminary PET experiment with 12 C3H/He mice bearing RIF-1 tumors showed that patupilone caused a significant (P=0.002) decrease in [18F]FLT (T/CFLT=0.78, i.e.,
22% decrease compared to vehicle) after just 24 h. Immuno-histochemistry experiments ex vivo showed that both markers for proliferation, %Ki67 and %PCNA, were also decreased (T/ Cs=0.86 and 0.80, respectively), and the [18F]FLT SUV on day 1 correlated significantly with %Ki67 (R=0.65, P=0.02) but not %PCNA.
A second experiment using 40 mice is summarized in Fig. 8. This experiment confirmed that patupilone rapidly and highly significantly (PG0.001) decreased the [18
F]FLT SUV after just 24 h, and this was followed by a slow recovery, but the SUVs remained significantly below those of the vehicle-treated mice. Broadly speaking, these decreases in [18F]FLT uptake were paralleled by decreases in %Ki67, but the effects were smaller and did not reach significance at any single time point, although over the entire treatment period, there was a significant effect (P= 0.03, 2W-ANOVA). Oddly, there was overall a significant increase in PCNA (P=0.02) that was highly significant on day 3 (T/CPCNA=1.5, P=0.002). As expected, there was a
significant increase in apoptosis (caspase-3) induced by patupilone which was highly significant overall and most prominent on day 1 (T/CPCNA= 2.2, P = 0.004). In this
experiment, the patupilone treatment was also considered well tolerated because there was no loss in body weight.
Correlations between the various IHC ex vivo parameters and [18F]FLT uptake in vivo revealed a weak positive correlation between %Ki67 and [18F]FLT on day 1 (R=0.57, P=0.09, n=10), but none at all over the whole course of the experiment (R=0.1, P=0.5, n=39; Fig.9a). In contrast, there was a very strong negative correlation between apoptosis and [18F]FLT on day 1 (R=-0.88, P=0.0009, Fig.9b) and over the whole time course (R=-0.72, PG0.0001, Fig.9c). For PCNA,
Fig. 7. Efficacy and tolerability of patupilone in C3H/He mice bearing RIF-1 fibrosarcomas. Tumors were treated with patupilone once on day 0 (1, 3, or 5 mg/kg) or vehicle. Results show the mean±SEM (n=8) for the tumor volume (a) and body weight (b) for vehicle and patupilone treated mice; *PG0.05 significantly different from vehicle at the endpoint on day 6 (1W-ANOVA with Tukey post hoc).
there was a moderate negative correlation between [18F]FLT and %PCNA (R =−0.43, P=0.006, Fig.9d) but no correla-tion at 24 h (R =−0.33, P=0.35, n=10). These correlations remained significant even when applying a Bonferroni correction for the six correlations tested (6 ×P). Thus, non-invasive measurement of [18F]FLT appeared to be an excellent marker of apoptosis induced by patupilone in RIF-1 tumors.
Discussion
By testing a large panel of 13 different tumor models, it has been possible to confirm our preliminary impression [31] that [18F]FDG PET imaging gives low and rim-limited tracer uptake, especially in human tumor xenografts. Such models tend to have an inadequate blood supply, and indeed tumor blood volume and blood flow has been shown to decrease with increasing tumor size [42], and consistent with this observation, hypoxia also tends to increase with tumor size
[43]. Thus, our data suggest that the static [18F]FDG PET images used here may be influenced by blood flow, as are other imaging techniques using i.v. contrast agents such as dynamic contrast-enhanced magnetic resonance imaging (DCE-MRI) [37, 44]. Indeed, the syngeneic orthotopic models showed the strongest [18F]FDG PET uptake and have previously been demonstrated to be very well vascu-larized [34,37,45]. Although in this study, we did not show if a lower blood flow was associated with hypoxia, a significant correlation has been described in cervical tumors between tumor oxygenation levels and DCE-MRI [46]. Increased hypoxia has been associated with increased glycolysis (via HIF-1 transcriptional up-regulation of nu-merous glycolytic enzymes) but not always so, and a number of other factors influence glycolysis including the microvas-culature [47]. Our experience with many models using both imaging and various histological methods is that human tumor xenografts have a well-perfused rim, a small rim of hypoxia next to this and centrally a small to large necrotic
Fig. 8. Longitudinal effect of patupilone on [18F]FLT uptake by s.c. RIF-1 tumors in vivo and comparison with ex vivo IHC
analyses of apoptosis and proliferation. Tumor-bearing C3H/He mice (n=40) were treated with vehicle or patupilone (5 mg/kg, once i.v.), after which each treatment group was further divided for each time point (n=5 per group per time point). Results show the mean±SEM (n=5) for the various parameters of [18F]FLT (a), Ki67 (b), caspase-3 (c), and PCNA (d) at the different time points shown. Differences between means were tested using a 2W-ANOVA with Tukey post hoc. The effect of drug treatment on the different parameters was summarized as the T/C.
area (tumor-type dependent). Thus, although there may be high glucose uptake and glycolysis at the rim, over the whole tumor, the total [18F]FDG uptake is low.
In general, low and heterogeneous tracer uptake in experimental tumors represents a complicating factor for proper PET data interpretation. For [18F]FDG PET imaging in rodents, various protocols were suggested to increase tumor uptake [48, 49]. Our own pilot study indicated that tracer uptake times longer than 30 min, and fasting periods up to 6 h do not result in a significant increase in tracer accumulation. We therefore refrained from fasting and focused on a strict standardization of injection and acquisition protocols to keep inter-individual variability at a minimum. Additionally, the quantitative assessment of the heterogeneity of tracer uptake within a tumor is considered to be another major challenge in small animal PET imaging. To detect the effect of a drug on the vital portion of an experimental tumor, the determination of a “maximum SUV” (only including the hottest voxels of the tumor ROI) might be more meaningful compared to a ROI comprising the entire tumor volume. However, when we directly compared mean SUV with maximum SUV, we found no difference in the outcome of the effect of a compound. Thus, we came to the conclusion that such an analysis might be biased by other factors such as partial volume loss, and we opted for the average SUV of the whole tumor volume as the most appropriate indicator of tracer uptake. Clearly, small animal PET imaging is characterized by limitations such as the lack of fully quantitative reconstruction software (e.g., correct-ing for partial volume loss) or the inaccurate ROI delineation in the absence of any anatomical information. Nevertheless, the
high reproducibility of our [18F]FDG and [18F]FLT uptake values showing low inter- and intra-experimental variability (Fig.6) led us to conclude that the bias of our experimental approach was in an acceptable range.
In contrast to [18F]FDG, however, with its low and heterogeneous tracer uptake, two other fluorinated tracers, [18F]FLT and [18F]FET, showed much more similar intra-tumor model uptake with adequate to very good visualiza-tion in all models: 12 for [18F]FLT and seven for [18F]FET, suggesting, based upon our argumentation above, that the SUV of these two tracers may be less influenced by the tu-mor blood supply. Interestingly, the models with the highest [18F]FDG uptake for the syngeneic orthotopic group (B16/ BL6) or s.c. xenograft group (U87 MG) showed the lowest [18F]FLT uptake for that group: [18F]FLT/[18F]FDG ratios of 0.13 and 0.67, respectively. The biological significance of this observation is not known, but it could be interpreted that high glycolysis is balanced by a lower uptake of thymidine from that salvage pathway. Uptake of the fluorinated tracer [18F]FCH was generally rather low or not detectable at all, even in the human prostate DU-145 tumor model. Again, observation showed that the best tracer uptake was found in syngeneic orthotopic tumors. In the one model with a tumor growing in the brain, H-460 i.c., there was an excellent accumulation of [18F]FLT, much weaker with [18F]FET, and not detectable with [18F]FDG or [18F]FCH. Finally, the mean [18F]FLT uptake and [18F]FDG uptake in a specific tumor type showed low intragroup variability which would permit drug-monitoring studies where subtle changes of tracer uptake need to be identified.
Fig. 9. Correlation of [18F]FLT in vivo with IHC ex vivo. Data are from that shown in Fig.8for all time points (a, c, d) or at 24 h only (b), and the strength of the relationship was measured by linear regression to provide the R value and the significance (P value).
[18F]FLT PET appeared to provide the best imaging parameters across all models, and thus we used this tracer as a non-invasive early-response biomarker to investigate the effect of the novel microtubule stabilizer patupilone. Patupilone is a cytotoxic which rapidly inhibits tumor growth in vivo and causes apoptosis [34, 42], and thus, [18F]FLT PET seemed to be suitable for this compound class. We selected the RIF-1 mouse tumor model because of high sensitivity and very good tolerability of the mice to patupilone and because ablation for IHC was easier than in the H-460-Luc model which, although showing a high [18F] FLT uptake, were very small and difficult to locate. The results in the RIF-1 tumor showed that patupilone caused the expected decrease in [18F]FLT already within 24 h, but the correlation with the proliferation markers Ki67 or PCNA was relatively weak compared with those in the literature reviewed by Apisarnthanarax [50]. Actually, both of these markers are expressed throughout the cell cycle, rather than just in S-phase, and Ki67 can show higher levels in mitosis [51], and PCNA may even be expressed by noncycling cells and has a long half-life [52]. Thus, these markers may not be ideal for detecting the effect of a drug which causes cells to accumulate in G2M prior to apoptosis [32]. In contrast, uptake of [18F]FLT by cells depends predominantly on the enzyme thymidine kinase-1, which is only expressed in S-phase [53]. Thus, the best ex vivo marker, or correlate, for [18F]FLT is really TK-1 [13,50–53], but this is not routinely used in the clinic. However, caspase-3 as a marker for apoptosis is used in the clinic, and the data presented here showed a very strong correlation between [18F]FLT and caspase-3.
Conclusions
Our analysis of several different tumor models and four different fluorinated tracers led us to conclude that, aside from [18F]FDG, [18F]FLT was likely to be the best all-round candidate for routine application as an early-response marker for anti-cancer compounds. [18F]FET also showed some potential, while on the other hand, [18F]FCH proved not to be a good generic tracer for animal tumors. As an example, [18F]FLT was tested in a murine fibrosarcoma using the novel cytotoxic patupilone, and the results showed that this tracer was an excellent marker for apoptosis induced by patupilone, suggesting that this non-invasive technique could usefully be applied as an early tumor-response marker for the clinical development of the compound.
Acknowledgments. The authors thank the team of Rolf Hesselmann and colleagues (PET Center, Division of Nuclear Medicine at University Hospital Zurich) for [18F]FET and [18F]FCH production.
References
1. Phelps ME (2000) Positron emission tomography provides molecular imaging of biological processes. Proc Natl Acad Sci U S A 97:9226–9233
2. Di Chiro G, De La Paz RL, Brooks RA et al (1982) Glucose utilization of cerebral gliomas measured by [18F]fluorodeoxyglucose and positron
emission tomography. Neurology 32:1323–1329
3. Hicks RJ, Kalff V, MacManus MP et al (2001)18F-FDG PET provides
high-impact and powerful prognostic stratification in staging newly diagnosed non-small cell lung cancer. J Nucl Med 42:1596–1604 4. Weber WA (2005) Use of PET monitoring cancer therapy and for
predicting outcome. J Nucl Med 46:983–995
5. Lammertsma AA, Hoekstra CJ, Giaccone G et al (2006) How should we analyse FDG PET studies for monitoring tumour response. Eur J Nucl Med Mol Imaging 33:16–21
6. Kenny LM, Aboagye EO, Price RM (2004) Positron emission tomography imaging of cell proliferation in oncology. Clin Onc 16:176–185
7. Spaeth N, Wyss MT, Weber B et al (2004) Uptake of 18F-fluorocho-line, 18F-fluoroethyl-L-tyrosine, and 18F-FDG in acute cerebral radiation injury in the rat: implications for separation of radiation necrosis from tumour recurrence. J Nucl Med 45:1931–1938 8. Katz-Brull R, Degani H (1996) Kinetics of choline transport and
phosphorylation in human breast cancer cells: NMR application of the zero trans method. Anticancer Res 16:1375–1380
9. Belt JA, Marina NM, Phelps DA et al (1993) Nucleoside transport in normal and neoplastic cells. Adv. Enzyme Regul 33:235–252 10. Kong W, Engel K, Wang J (2004) Mammalian nucleoside transporters.
Curr Drug Metab 5:63–84
11. Shields AF, Grierson JR, Dohmen BM et al (1998) Imaging proliferation in vivo with [F-18]FLT and positron emission tomography. Nat Med 4:1334–1336
12. Grierson JR, Shields AF (2000) Radiosynthesis of 3′-deoxy-3′-[18F] fluorothymidine: [18F]FLT for imaging of cellular proliferation in vivo. Nucl Med Biol 27:143–156
13. Rasey JS, Grierson JR, Wiens LW et al (2002) Validation of FLT uptake as a measure of thymidine kinase-1 activity in A549 carcinoma cells. J Nucl Med 438:1210–1217
14. Buck AK, Halter G, Schirrmeister H et al (2003) Imaging proliferation in lung tumours with PET: 18F-FLT versus 18F-FDG. J Nucl Med 44:1432–1434
15. Mier W, Haberkorn U, Eisenhut M (2002) [18F]FLT; portrait of a proliferation marker. Eur J Nucl Med 29:165–169
16. Shields AF (2006) Positron emission tomography measurement of tumour metabolism and growth: its expanding role in oncology. Mol Imaging Biol 8:141–150
17. Kenny LM, Aboagye EO, Price PM (2004) Positron emission tomogra-phy imaging of cell proliferation in oncology. Clin Oncol 16:176–185 18. Heiss P, Mayer S, Herz M et al (1999) Investigation of transport
mechanism and uptake kinetics of O-(2-[18
F]fluoroethyl)-L-tyrosine in vitro and in vivo. J Nucl Med 40:1367–1373
19. Wester HJ, Herz M, Weber W et al (1999) Synthesis and radio-pharmacology of O-(2-[18F]fluoroethyl)-L-tyrosine for tumour imaging. J Nucl Med 40:205–212
20. Pauleit D, Stoffels G, Schaden W et al (2005) PET with O-(2-18
F-fluoroethyl)-L-tyrosine in peripheral tumours: first clinical results. J Nucl Med 46:411–416
21. Langen KJ, Hamacher K, Weckesser M et al (2006) O-(2-[18F]
fluoroethyl)-L-tyrosine: uptake mechanisms and clinical applications. Nucl Med Biol 33:287–294
22. Wyss MT, Spaeth N, Biollaz G et al (2007) Uptake of18
F-fluorocho-line,18F-FET, and18F-FDG in C6 gliomas and correlation with131I-SIP (L19), a marker of angiogenesis. J Nucl Med 48:608–614
23. Wang HE, Wu SY, Chang CW et al (2005) Evaluation of F-18-labeled amino acid derivatives and [18F]FDG as PET probes in a brain tumour-bearing animal model. Nucl Med Biol 32:367–375
24. Rau FC, Weber WA, Wester HJ et al (2002) O-(2-[18F]fluoroethyl)-L -tyrosine (FET): a tracer for differentiation of tumour from inflammation in murine lymph nodes. J Nucl Med 29:1039–1046
25. DeGrado TR, Baldwin SW, Wang S et al (2001) Synthesis and evaluation of18F-labeled choline analogs as oncologic PET tracers. J
Nucl Med 42:1805–1814
26. Price DT, Coleman RE, Liao RP et al (2002) Comparison of [18F] fluorocholine and [18F]fluorodeoxyglucose for positron emission
to-mography of androgen dependent and androgen independent prostate cancer. J Urol 168:273–280
27. Hara T, Kosaka N, Kishi H (1998) PET imaging of prostate cancer using carbon-11-choline. J Nucl Med 39:990–995
28. Shinoura N, Nishijima M, Hara T et al (1997) Brain tumours: detection with C-11 choline PET. Radiology 202:497–503
29. Hara T, Inagaki K, Kosaka N et al (2000) Sensitive detection of mediastinal lymph node metastasis of lung cancer with 11C-choline PET. J Nucl Med 41:1507–1513
30. Hara T, Bansal A, DeGrado TR (2006) Choline transporter as a novel target for molecular imaging of cancer. Mol Imaging 5:498–509 31. McSheehy PMJ Allegrini PR Ametamey SM et al (2005) The anticancer
agent RAD001 rapidly inhibits 18F-FDG uptake by sensitive but not
resistant tumours. 52nd Meeting Society Nuclear Medicine, abstract 1238 32. Altmann K-H (2003) Epothilone B and its analogs—a new family of
anticancer agents. Mini Rev Med Chem 3:149–158
33. Goodin S, Kane MP, Rubin EH (2004) Epothilones: mechanism of action and biologic activity. J Clin Oncol 22:2015–2025
34. Ferretti S, Allegrini PR, O’Reilly T et al (2005) Patupilone induced vascular disruption in orthotopic rodent tumour models detected by magnetic resonance imaging and interstitial fluid pressure. Clin Cancer Res 11:7773–7784
35. Leyton J, Latigo JR, Perumal M et al (2005) Early detection of tumour response to chemotherapy by 3′-deoxy-3′[18F]fluorothymidine positron
emission tomography: the effect of cisplatin on a fibrosarcoma tumour model in vivo. Cancer Res 65:4202–4010
36. Kim WD, Ahn D, Oh Y et al (2006) New class of SN2 reactions
catalyzed by protic solvents: facile fluorination for isotopic labeling of diagnostic molecules. J Am Chem Soc 128:16394–16397
37. Rudin M, McSheehy PMJ, Allegrini PR et al (2005) PTK787/ ZK222584, a tyrosine kinase inhibitor of vascularendothelial growth factor receptor, reduces uptake of the contrast agent GdDOTA by murine orthotopic B16/BL6 melanoma tumours and inhibits their growth in vivo. NMR Biomed 18:308–332
38. Missimer J, Madi Z, Honer M et al (2004) Performance evaluation of the 16-module quad-HIDAC small animal PET camera. Phys Med Biol 49:2069–2081
39. Jeavons AP, Chandler RA, Dettmar CAR (1999) A 3D HIDAC-PET camera with submillimetre resolution for imaging small animals. IEEE Trans Nucl Sci 46:468–473
40. Reader AJ, Erlandsson K, Flower MA et al (1998) Fast accurate iterative reconstruction for low-statistics positron volume imaging. Phys Med Biol 43:835–846
41. Mikolajczyk K, Szabatin M, Rudnicki P et al (1998) A JAVA environment for medical image data analysis: initial application for brain PET quantification. Med Inform (Lond) 23:207–214
42. O’Reilly T, Wartmann M, Brueggen J et al (2009) Pharmacokinetic profile of the novel microtubule stabilizer patupilone in tumour-bearing rodents and comparison of anti-cancer activity with other MTS in multi-drug resistant human colon tumour cells in vitro and in vivo. Cancer Chemother. Pharmacol 62(6):1045–1054
43. McSheehy PMJ, Robinson S, Ojugo A et al (1998) Carbogen breathing increases 5-fluorouracil uptake and cytotoxicity in hypoxic RIF-1 tumours: a magnetic resonance study in vivo. Cancer Res 58:1185–1194 44. Lee L, Sharma S, Morgan B et al (2006) Biomarkers for assessment of pharmacologic activity for a vascular endothelial growth factor (VEGF) receptor inhibitor, PTK787/ZK 222584 (PTK/ZK): translation of biological activity in a mouse melanoma metastases model to phase I studies in patients with advanced colorectal cancer with liver metasta-ses. Cancer Chemother Pharmacol 7:761–771
45. Robinson S, Rijken P, Howe F et al (2003) Assessment of tumour vascular development and function by susceptibility MRI methods and immunohistochemistry. J Magn Res 17:445–454
46. Cooper RA, Carrington BM, Loncaster JA et al (2000) Tumour oxygenation levels correlate with dynamic contrast-enhanced magnetic resonance imaging parameters in carcinoma of the cervix. Radiother Oncol 57:53–59 47. Rajendran JG, Mankoff DA, O’Sullivan F et al (2004) Hypoxia and glucose metabolism in malignant tumors: evaluation by [18F]fluoromi-sonidazole and [18F]fluorodeoxyglucose positron emission tomography imaging. Clin Cancer Res 10:2245–2252
48. Fueger BJ, Czernin J, Hildebrandt I et al (2006) Impact of animal handling on the results of18F-FDG PET studies in mice. J Nucl Med 47:999–1006 49. Lee K-H, Ko B-H, Paik J-Y et al (2005) Effects of anesthetic agents and fasting duration on18F-FDG biodistribution and insulin levels in tumor-bearing mice. J Nucl Med 46:1531–1536
50. Apisarnthanarax S, Alauddin MM, Mourtada F et al (2006) Early detection of chemoradioresponse in esophageal carcinoma by 3 ′-Deoxy-3′-3H-fluorothymidine using preclinical tumour models. Clin Cancer Res 12:4590–4597
51. Landberg G, Tan EM, Roos G (1990) Flow cytometric multiparameter analysis of proliferating cell nuclear antigen/cyclin and Ki-67 antigen: a new view of the cell cycle. Exp Cell Res 187(1):111–118
52. Quiñones-Hinojosa A, Sanai N, Smith JS (2005) Techniques to assess the proliferative potential of brain tumours. J Neurooncol 74:19–30 53. Eriksson S, Kierdaszuk B, Munch-Petersen B et al (1991) Comparison
of the substrate specificities of human thymidine kinase 1 and 2 and deoxycytidine kinase toward antiviral and cytostatic nucleoside analogs. Biochem Biophys Res Commun 176:586–592
![Table 1. Summary of [ 18 F]FDG, [ 18 F]FLT, [ 18 F]FET, and [ 18 F]FCH SUVs in various experimental rodent tumor models SUV ratio [ 18 F]FDG versus](https://thumb-eu.123doks.com/thumbv2/123doknet/14867662.638248/4.891.222.694.112.506/table-summary-suvs-various-experimental-rodent-models-versus.webp)
![Fig. 9. Correlation of [ 18 F]FLT in vivo with IHC ex vivo. Data are from that shown in Fig](https://thumb-eu.123doks.com/thumbv2/123doknet/14867662.638248/12.891.178.735.106.505/fig-correlation-flt-vivo-ihc-vivo-data-shown.webp)