ORIGINAL PAPER
Performance characteristics
of a rapid immunochromatographic assay for detection
of pandemic influenza A (H1N1) virus in children
Kristina Keitel&Noémie Wagner&Laurence Lacroix& Sergio Manzano&Alain Gervaix
Received: 1 June 2010 / Revised: 28 September 2010 / Accepted: 30 September 2010 / Published online: 12 October 2010 # Springer-Verlag 2010
Abstract Rapid tests for diagnosis of influenza are valuable assets in the management of influenza in pediatric patients. However, test performance fluctuates with virus subtypes. We assessed the test characteristics of Influenza-top®, a rapid immunochromatographic influenza A and B test, in detecting pandemic 2009 influenza A (H1N1) in children up to 18 years of age, using reverse transcriptase polymerase chain reaction (RT-PCR) as the gold standard. Three hundred and one pediatric outpatients with influenza-like illness were included into the study. Overall sensitivity of Influenzatop® was 64% (95% confidence interval (CI) 56–71%) but increased to 92% (95% CI, 80–97%) when performed between 24 and 48 h after onset of symptoms. Positive Influenzatop® results among RT-PCR-positive patients were associated with higher viral load. No significant variation in test performance could be detected when analyzed by age and high versus low prevalence period. Overall test specificity was 99% (95% CI, 95– 100%); positive and negative predictive values were 98% (95% CI, 93–99%) and 70% (95% CI, 63–76%), respec-tively. Conclusion: Influenzatop® rapid influenza test is a sound tool in the diagnosis of H1N1 in pediatric patients when employed 24–48 h after onset of symptoms.
Keywords Child . H1N1 . Influenza . Rapid test
Introduction
On April 29, 2009, the first pandemic (H1N1) 2009 influenza case was reported in Switzerland. In Geneva canton, 2,377 cases were reported until December 2009 for a total population of 453,292, and around 57% occurred in the pediatric age group [16]. Often decisions about treatment, prophylaxis, and infection control measures have to be taken by the pediatric provider before real-time reverse transcriptase polymerase chain reaction (RT-PCR) results are available. A variety of rapid tests for the diagnosis of influenza are at hand and they are used routinely in children. For management of seasonal influen-za in pediatric patients, rapid tests have been shown to reduce prescription of laboratory test, radiographic studies, and antibiotics [4, 10, 12]. However, their performance fluctuates with virus subtypes and has indeed been reported to be poorer for nonhuman strains [6,17]. It is hence crucial to understand the characteristics of commercial tests used for detection of pandemic (H1N1) 2009 virus because it will probably continue to circulate in the population in addition to the seasonal strains in the coming years. We initially used both of QuickVue Influenza A + B® test (Quidel), a rapid test routinely used for rapid testing for seasonal influenza in our pediatric department at the University Children’s Hospital Geneva (HUG), as well as Influenzatop® (ALL.DIAG, Strasbourg, France), a rapid immunochromatographic influenza A and B test, for rapid detection of pandemic (H1N1) 2009 virus in addition to routine RT-PCR testing. After an initial subset of patients has been identified, it appeared from published data and our own experience that sensitivity of QuickVue® was low to moderate [8]. In order to limit the number of nasal swab samples to be collected for each patient, we hence decided to only further assess the performance of Influenzatop® in
K. Keitel
:
N. Wagner:
L. Lacroix:
S. Manzano:
A. Gervaix University Children’s Hospital Geneva,Geneva, Switzerland A. Gervaix (*)
Service d’Accueil et d’Urgences Pédiatriques, Département de l’Enfant et de l’Adolescent, Hôpitaux Universitaires de Genève, Rue Willy Donzé, 6,
1211 Geneva 14, Switzerland e-mail: alain.gervaix@hcuge.ch
our population. The objective of this analysis was to characterize Influenzatop® (ALL.DIAG, Strasbourg, France), a rapid immunochromatographic influenza A and B test, in detecting the pandemic (H1N1) 2009 virus among pediatric patients.
Materials and methods
Study population and testing strategy
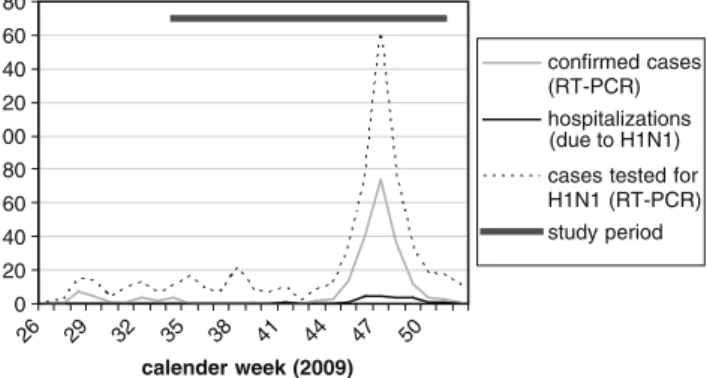
Patients up to 18 years of age who were tested for pandemic (H1N1) 2009 virus using both Influenzatop® and RT-PCR between August 21 and December 16, 2009 were included. Information from two different patient subpopulations were used: the first population consisted of patients included into a pediatric H1N1 surveillance study conducted at HUG; the second population was composed of test results from routine testing at the Pediatric Emergency Division of HUG and at 13 participating outpatient sites. Inclusion criteria and testing procedure were identical for all subgroups. At HUG, a total of 591 pediatric patients were tested for H1N1 between August and December 2009; 216 cases were confirmed positive (Fig.1). The peak of the epidemic in Geneva was observed in November 2009 [16]. After November 21, 2009, the Swiss pediatric H1N1 consortium recommended discontin-uation of routine testing for pandemic (H1N1) 2009 virus. Testing was subsequently limited to at-risk patients present-ing influenza-like illness (ILI) as defined as fever≥38°C plus upper or lower respiratory symptoms. At-risk categories were defined as follows: patients with severe or rapidly aggravating symptoms; patients hospitalized for respiratory infections; patients <12 months of age; patients with personal risk factors such as chronic cardiac conditions, severe asthma, cystic fibrosis, neuromuscular disease, and immunodeficiency; infants <2 years of age born <33 weeks of gestation or with birth weight <1,500 g; and patients in
close contact with at-risk patients such as infants <6 months of age and pregnant women.
Sample collection and testing
For each patient, two specimens were collected by trained physicians. One foam-tipped nasal swab provided by the manufacturer was immediately tested with the Influenzatop® assay (ALL.DIAG, Strasbourg, France) according to the manufacturer’s protocol [1]. One additional nasopharyngeal swab was placed in a viral transport medium, stored at 4°C, and sent off the same day for testing using RT-PCR. InfACDC, a protocol for identification and characterization of the pandemic 2009 influenza A (H1N1) virus strain provided by the Centers for Disease Control and Prevention (CDC), was used [19]. The threshold for detection of fluorescence above background was determined. For semi-quantitative comparison of the amount of RNA template, i.e., viral load, the cycle threshold (Ct) of samples using InfACDC was compared. Ct is the cycle at which the fluorescence from a sample crosses the threshold for detection. Ct is thus inversely related to viral load.
Data analysis
The sensitivities, specificities, positive predictive values (PPV), and negative predictive values (NPV) of Influenza-top® were calculated using RT-PCR for pandemic (H1N1) 2009 virus as the gold standard test; 95% confidence (95% CI) intervals for proportions were produced with the Wilson score method [11]. Differences in proportions among subgroups were analyzed using chi-square tests. For normally distributed variables, difference in mean viral load between subgroups was assessed by ANOVA. For prediction of sensitivity, covariates were compared between Influenzatop®-negative and -positive patients within PCR-positive samples. Chi-square tests were used for categorical variables and t test for Ct. Logistic regression was performed to study independent influence of various factors on sensitivity. Ct was entered as a continuous variable whereas duration of symptoms and age were categorized. The final model was obtained through backward selection of variables displayed in Table3 using the likelihood ratio test at thep<0.10 level. The performance of the predictive model was illustrated by the receiver-operating characteris-tic curve, as well as by sensitivity and specificity. All statistical tests are two-tailed and a p value of 0.05 was considered statistically significant. All computations were performed using SPSS version 15.0 (SPSS Inc.) and Excel 2003 (Microsoft Inc.). Informed consent was obtained at inclusion from patients participating in the H1N1 surveil-lance study (n=83). For the 116 patients tested routinely at HUG, consent was asked retrospectively via telephone 0 20 40 60 80 100 120 140 160 180 26 29 32 35 38 41 44 47 50 calender week (2009) confirmed cases (RT-PCR) hospitalizations cases tested for H1N1 (RT-PCR) study period (due to H1N1)
Fig. 1 Pediatric H1N1 cases at the University Children’s Hospital Geneva, 2009
interviews—4 of 116 patients refused participation in the study. This study was approved by the ethical committee of HUG. For patients included from routine testing at the 13 pediatric outpatient sites (n=94), anonymous data were sent to the investigators for analysis. The study was also approved by the ethical committee of Geneva County.
Results
Characteristics of the study population
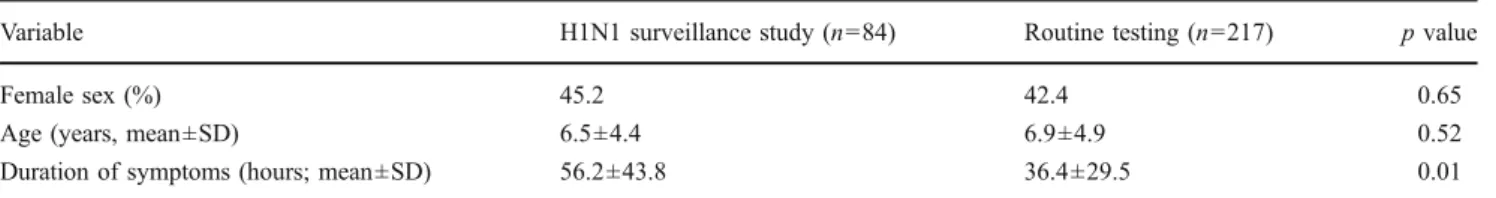
Three hundred and one patients from the H1N1 surveillance study (n=84, 27.9%) and from routine testing at HUG as well as 13 outpatient sites (n=217, 72.1%) were included in the study. The age range of the patients tested was 7 days to 18 years (mean 6.8 years, SD 4.8 years, median 6.06 years); 50 patients (16.6%) were under 24 months of age. Age and sex characteristics were similar for the two patient subpopulations; patients tested in the context of H1N1 surveillance study presented slightly later into the illness (Table1).
Performance of Influenzatop®
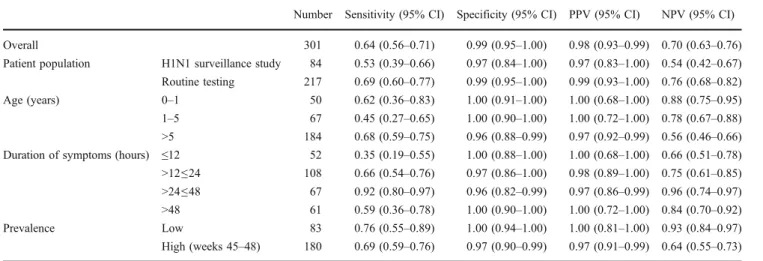
RT-PCR results for pandemic (H1N1) 2009 virus were positive in 164 samples (54%). Table 2 displays both the overall test characteristics for Influenzatop® for the detection of pandemic (H1N1) 2009 virus, as well as stratified by patient subpopulation, age, duration of symptoms, and prevalence phase. In our patient population, Influenzatop® had an overall sensitivity, specificity, PPV, and NPV of 64% (95% CI, 56–71%), 99% (95% CI, 95–1.00%), 98% (95% CI, 93–99%), and 70% (95% CI, 63–76%), respectively. As for the different patient subgroups, Influenzatop® showed a higher sensitivity and NPV in patients tested during routine testing: 69% versus 53% (chi-square 4.13 (p=0.042)) and 76% versus 54% (overall chi-square 7.55 (p=0.006)), respectively. No significant difference in specificity nor PPV could be detected: chi-square 0.48 (p=0.49) and 0.36 (p=0.55). Sensitivity, specificity, and PPV were not signif-icantly different across age strata: overall chi-square—3.98 (p=0.14), 3.03 (p=0.22), and 0.41 (p=0.81), respectively.
However, a significant difference was found for NPV (overall chi-square 17.70,p=0.001): NPV was greater for children aged <1 and 1–5 years when compared to patients >5 years of age (88% and 78% versus 56%; chi-square 20.49 (p<0001), 9.73 (p=0.007), respectively). As for the duration of symptoms, sensitivity was significantly greater when the test was performed between 24 and 48 h after onset of symptoms (92%) when compared to within the first 12 h (35%, chi-square 21.78, p<0.0001), 12–24 h (66%, chi-square 18.20, p=0.0004), and after 48 h (59%, chi-square 9.53, p=0.023). No significant difference in specificity and PPV was detected when stratified by duration of symptoms (overall chi-square 2.31 (p=0.55), and 0.54 (p=0.91), respectively). NPV was significantly greater between 24 and 48 h after onset of symptoms (96%, overall chi-square 11.78, p=0.008) when contrasted to ≤12 h (66%, chi-square 8.71, p=0.03) and 12–24 h (75%, chi-square 17.66, p=0.0005). The test performance within the peak period of the epidemic (weeks 45–48) was not different from that during weeks of lower prevalence in terms of sensitivity, specificity, and PPV (chi-square 0.54 (p=0.46), 1.88 (p=0.17), and 0.48 (p=0.52), respec-tively). A greater NPV was observed in weeks of lower prevalence (93%) versus during the peak of the epidemic (64%, chi-square 24.04, p<0.0001).
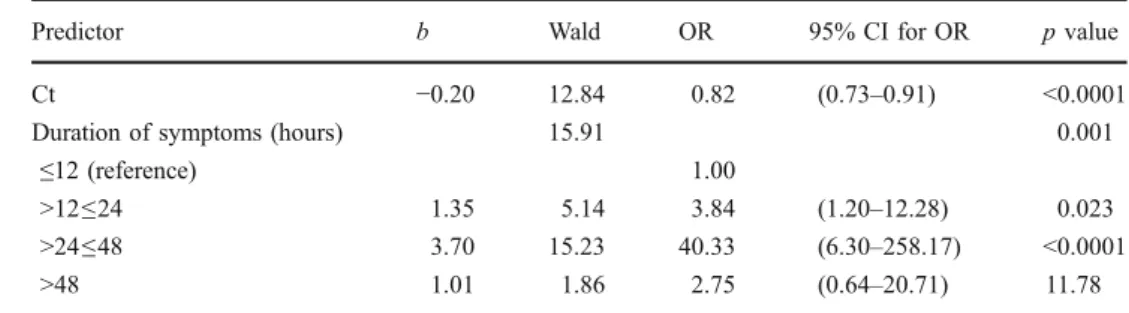
For prediction of the probability of testing positive with Influenzatop® among RT-PCR-positive patients, hence an indicator of sensitivity, binary logistic regression was performed. The following variables (Table 3) were evalu-ated for the development of the prediction model: age, duration of symptoms, Ct, patient subgroup, as well as high versus low prevalence season. These variables showed no significant correlation. From these variables, duration of symptoms and Ct made statistically significant contribution to the prediction (Table 4). Receiver-operating characteris-tic curve for the predictive model had an area under the curve of 0.78 (95% CI, 0.73–0.84) with an optimal sensitivity and specificity of 77% and 85%, respectively. In terms of viral load, RT-PCR-positive samples that yielded positive results in the rapid test reached threshold after a mean of 22.97 cycles (SD±3.40). This contrasted with a significantly greater Ct of 25.77 (SD ±5.02) in the rapid test-negative group. These results thus indicate an
Table 1 Characteristics of patients by subgroup
Variable H1N1 surveillance study (n=84) Routine testing (n=217) p value
Female sex (%) 45.2 42.4 0.65
Age (years, mean±SD) 6.5±4.4 6.9±4.9 0.52 Duration of symptoms (hours; mean±SD) 56.2±43.8 36.4±29.5 0.01
increase in rapid test sensitivity with higher viral load (Table 3). This was indeed confirmed when tested in the logistic regression model where a decrease in Ct (hence increase in viral load) was associated with an increase in sensitivity (Table 4). Mean viral load among RT-PCR-positive patients was lower >48 h after onset of symptoms when compared to patients presenting between 12 and 24 h (Ct 26.6 versus 23.2, p=0.01; overall ANOVA F 3.37,p=0.02). No significant difference in mean viral load across duration strata could be detected (ANOVAF 1.10, p=0.36). Coherent with subgroup analysis (Table 2),
duration of symptoms was a predictor of sensitivity in the logistic regression model; a strong positive association was observed in the subgroup of 24–48 h post onset of symptoms when compared to≤12 h.
Discussion
This study is the first to evaluate the performance of Influenzatop®, a rapid immunochromatographic influenza A and B test, for detection of pandemic (H1N1) 2009 virus
Table 2 Test characteristics of Influenzatop® rapid test compared to RT-PCR
Number Sensitivity (95% CI) Specificity (95% CI) PPV (95% CI) NPV (95% CI)
Overall 301 0.64 (0.56–0.71) 0.99 (0.95–1.00) 0.98 (0.93–0.99) 0.70 (0.63–0.76)
Patient population H1N1 surveillance study 84 0.53 (0.39–0.66) 0.97 (0.84–1.00) 0.97 (0.83–1.00) 0.54 (0.42–0.67) Routine testing 217 0.69 (0.60–0.77) 0.99 (0.95–1.00) 0.99 (0.93–1.00) 0.76 (0.68–0.82) Age (years) 0–1 50 0.62 (0.36–0.83) 1.00 (0.91–1.00) 1.00 (0.68–1.00) 0.88 (0.75–0.95) 1–5 67 0.45 (0.27–0.65) 1.00 (0.90–1.00) 1.00 (0.72–1.00) 0.78 (0.67–0.88) >5 184 0.68 (0.59–0.75) 0.96 (0.88–0.99) 0.97 (0.92–0.99) 0.56 (0.46–0.66) Duration of symptoms (hours) ≤12 52 0.35 (0.19–0.55) 1.00 (0.88–1.00) 1.00 (0.68–1.00) 0.66 (0.51–0.78) >12≤24 108 0.66 (0.54–0.76) 0.97 (0.86–1.00) 0.98 (0.89–1.00) 0.75 (0.61–0.85) >24≤48 67 0.92 (0.80–0.97) 0.96 (0.82–0.99) 0.97 (0.86–0.99) 0.96 (0.74–0.97) >48 61 0.59 (0.36–0.78) 1.00 (0.90–1.00) 1.00 (0.72–1.00) 0.84 (0.70–0.92) Prevalence Low 83 0.76 (0.55–0.89) 1.00 (0.94–1.00) 1.00 (0.81–1.00) 0.93 (0.84–0.97) High (weeks 45–48) 180 0.69 (0.59–0.76) 0.97 (0.90–0.99) 0.97 (0.91–0.99) 0.64 (0.55–0.73)
Table 3 Characteristics of RT-PCR-positive patients
Variable Influenzatop® positive (n=59), % Influenzatop® negative (n=105), % p value
Total 63.9 36.1 Female sex 40.0 52.5 0.12 Age (years) 0.50a ≤2 11.4 10.2 >2≤6 17.1 25.4 >6≤10 31.4 33.9 >10 40.0 30.5
Duration of symptoms (hours) <0.0001a
≤12 7.9 26.8
>12≤24 46.5 42.9
>24≤48 35.6 5.4
>48 9.9 25.0
High prevalence period
(weeks 45–48) 83.8 83.1 0.90
H1N1 surveillance study population 26.7 42.4 0.53 Ct (mean±SD) 22.97±3.40 25.77±5.02 <0.001
a
in children as compared to the standard of RT-PCR testing. Rapid diagnostic tests are valuable tools in the management of pediatric influenza cases as decisions often have to be taken before PCR results are available. Understanding the performance of commercially available tests in children is thus crucial. We found that Influenzatop® was overall moderately (64%) sensitive in detecting pandemic (H1N1) 2009 virus in children when compared to RT-PCR; NPV was 70%. However, sensitivity increased to 92% when performed between 24 and 48 h after onset of symptoms. Overall test performance was hence not sufficient to exclude H1N1 infection in all rapid test-negative patients. At-risk patients at HUG with negative test results were thus treated with neuraminidase inhibitors until RT-PCR results were available. However, given the time-specific results of this more detailed retrospective analysis, treatment could have most likely been delayed in patients at moderate to low risk of complicated infection presenting during the illness phase of higher test sensitivity (48–72 h); this would prevent overutilization of neuraminidase inhibitors in the large number of patients that were PCR-negative. Influen-zatop® is highly specific in detecting pandemic (H1N1) 2009 virus. Given these results, more expensive RT-PCR testing in rapid test-positive patients may not be warranted. Moreover, positive test results are especially useful in the management of patients presenting with febrile illness that are at low risk for bacterial co-infection (i.e., most patients above 3 months of age). On site confirmation of infection with pandemic (H1N1) 2009 virus in this patient group could prevent overuse of antibiotics. On the other hand, rapid testing in patients that are not eligible for RT-PCR testing allows considering antiviral treatment with neur-aminidase inhibitor. Treatment during the first 2 days of symptoms has been shown to shorten influenza symptoms and prevent lower respiratory tract complication in influ-enza cases [9].
With regards to other commercial tests—although comparison has to be qualified given that data were only available from published data—we found that performance of Influenzatop® was similar to that of QuickVue®—65%, 95% CI 58.5–71.4% but higher when compared to BinaxNOW Influenza A&B® (Iverness Medical)—45%,
95% CI 43.3–46.3% [3, 8]. Sensitivity of Influenzatop® was higher when performed between 24 and 48 h post onset of symptoms compared to 74.2% (95% CI, 62–84.2) with QuickVue® [8]. Sensitivity of Influenzatop® was about 7% points higher contrasted to that estimated for direct fluorescence antibody assay (57.3%) in pediatric patients presenting with ILI [14]. In a large study assessing multiple tests, sensitivities of BinaxNOW® and 3MA + B® as compared to R-Mix culture for the detection of pandemic (H1N1) 2009 virus were 9.6% and 40%, respectively. However, in the latter study, the patient population included adults (mean age 13.7 years, range 2 weeks to 97 years) [7]. Influenzatop® rapid test has neither been evaluated in the pediatric population nor for pandemic (H1N1) 2009 virus. The test was reported by the manufacturer to be 98.3% sensitive and 90.1% specific in the detection of influenza A in nasal swabs compared to viral isolation in adults [1]. This divergence from test characteristics observed in our study may be due to variation of performance of rapid influenza detection tests by virus subtype. Sensitivity of rapid tests has indeed been reported to be poorer for the nonhuman pandemic (H1N1) 2009 viruses [6,8,14,15,17].
Viral load, as indicated by a lower number of RT-PCR cycles needed to reach threshold (Ct), was a positive predictor for true positive rapid test results when controlling for age and duration of symptoms. This goes in line with the results assessing the performance of BinaxNOW Influenza A&B Rapid Test® in PCR-positive clinical specimens [3,5]. A positive correlation between sensitivity and viral load has also been found in studies assessing rapid tests during a regular influenza season [3].
Sensitivity was highest when the test was performed between 24 and 48 h. This correlated with a higher viral load in patients diagnosed 12–48 h post onset of symptoms when compared to patients presenting after 48 h. This observed variation in sensitivity is similar to that found for QuickVue® which was found to be 59.7% sensitive on day 1 compared to 76.9%, 79.5%, and 54.5% on days 2, 3, and 4, respectively [3].
Additionally, in a study among adult patients, an immunochromatographic rapid test was not found to be
Predictor b Wald OR 95% CI for OR p value Ct −0.20 12.84 0.82 (0.73–0.91) <0.0001 Duration of symptoms (hours) 15.91 0.001
≤12 (reference) 1.00
>12≤24 1.35 5.14 3.84 (1.20–12.28) 0.023 >24≤48 3.70 15.23 40.33 (6.30–258.17) <0.0001 >48 1.01 1.86 2.75 (0.64–20.71) 11.78 Table 4 Results of binary
logistic regression model for sensitivity
sufficiently sensitive within the 24 h of fever onset owing to low viral load [18]. However, in other studies among adult patients, no significant difference between presenta-tion within the first 24 h or later could be detected [3,13]. In influenza volunteer challenge studies, peak viral load has been reported 24–48 h following viral inoculation [2]. No such data exist for children or elderly subjects, but epidemiologic studies suggest that the natural history might differ. It is possible that children are symptomatic at relatively low viral loads [18]. Regarding the patient population of this study, only a subgroup of at-risk patients or patients with severe symptoms was tested after Novem-ber 21, 2009. One might thus assume that viral load in this group may already be high early into symptomatic illness when compared to studies in the general pediatric popula-tion. However, the majority of patients (81%) were included before implementation of restricted testing and our patient sample can hence still be considered represen-tative for the general pediatric population.
There are several limitations to this study. The study was performed in one region only and in a limited study population. Testing in 19% of patients was limited to at-risk patients and patients presenting with severe symptoms. Due to this selection bias, prevalence of disease may be different in the general pediatric population; the positive and negative predictive values of any test are dependent on the prevalence of disease. Additionally, these values would diverge at different levels of circulation of seasonal influenza and/or pandemic (H1N1) 2009. Performance of Influenzatop® was compared to RT-PCR results with InfACDC primers only; results may be different when other primers are used as a reference standard.
In conclusion, regular assessment of test performance of rapid influenza tests is essential given the continuous antigenic drift of the influenza virus; performance may vary by brand and by virus subtype. When comparing Influenzatop® to that of QuickVue Influenza A + B® and BinaxNOW Influenza A&B® assessed in previous studies, performance of Influenzatop® appears comparable in general but higher when employed between 24 and 48 h post onset of symptoms [3, 8, 14]. Especially when employed between 24 and 48 h after onset of symptoms, Influenzatop® can be a valuable asset in the management of pediatric H1N1 patients. Rapid testing may reduce overuse of antibiotics and can be a helpful adjuvant in the decision about treatment and follow-up of patients [12]. Starting antiviral treatment with neuraminidase inhibitor during the first 2 days of symptoms has been shown to shorten influenza symptoms and prevent lower respiratory tract complication in influenza cases [9]. In this subgroup, Influenzatop® is a sound diagnostic alternative to the more expensive RT-PCR which is not readily available in all settings. Earlier on into the illness, negative results with
rapid tests are not sufficient to exclude infection. In these cases, clinicians should make decision on the treatment, prophylaxis, and preventive measures based on clinical presentation, circulating subtypes, and their respective antiviral susceptibility patterns, as well as economic considerations.
Acknowledgments We thank Drs. Denis Aladjem, Virginie Chaves-Vischer, Pierre-Alex Crisinel, Cristina Delco, Corinne DeMoerlosse, Virginie Desmangles, Marie-Noelle Desthieux, Hakan Erbuke, Catherine Greder, Daniel Halperin, Christophe Hegi, Santosham Itty, Laurent Kaiser, Claire Leresche, Purificacion Mendez, Antoinette Mossaz-Moser, Jean Taguebue, Yves Thomas, and Samuel Zamora for their help in patient recruitment, collection of specimens, and data entry.
Conflict of interest Influenzatop® tests were supplied free of charge from ALL.DIAG, Strasbourg, France. Authors have no other affiliations or financial involvement in any organization or entity with a direct financial interest in the subject matter or materials of the research discussed in the manuscript.
References
1. ALL.DIAG (2010) Influenzatop instructions for use.http://www. alldiag.com/francais/produitsdossier/influenzatop/influenzatop. html. Accessed 10 May 2010
2. Carrat F, Vergu E, Ferguson NM, Lemaitre M, Cauchemez S, Leach S, Valleron AJ (2008) Time lines of infection and disease in human influenza: a review of volunteer challenge studies. Am J Epidemiol 167:775–785
3. Cruz AT, Cazacu AC, Greer JM, Demmler GJ (2008) Rapid assays for the diagnosis of influenza A and B viruses in patients evaluated at a large tertiary care children’s hospital during two consecutive winter seasons. J Clin Virol 41:143–147
4. de La Rocque F, Lecuyer A, Wollner C, d’Athis P, Pecking M, Thollot F, Cohen R (2009) Impact of influenza rapid diagnostic tests (IRDT) on the diagnosis of influenza and on the management of influenza in children in ambulatory pediatric setting. Arch Pediatr 16:288–293
5. Drexler JF, Helmer A, Kirberg H, Reber U, Panning M, Muller M, Hofling K, Matz B, Drosten C, Eis-Hubinger AM (2009) Poor clinical sensitivity of rapid antigen test for influenza A pandemic (H1N1) 2009 virus. Emerg Infect Dis 15:1662–1664
6. Fedorko DP, Nelson NA, McAuliffe JM, Subbarao K (2006) Performance of rapid tests for detection of avian influenza A virus types H5N1 and H9N2. J Clin Microbiol 44:1596–1597 7. Ginocchio CC, Zhang F, Manji R, Arora S, Bornfreund M,
Falk L, Lotlikar M, Kowerska M, Becker G, Korologos D, de Geronimo M, Crawford JM (2009) Evaluation of multiple test methods for the detection of the novel 2009 influenza A (H1N1) during the New York City outbreak. J Clin Virol 45:191–195
8. Gordon A, Videa E, Saborio S, Lopez R, Kuan G, Reingold A, Balmaseda A, Harris E (2009) Performance of an influenza rapid test in children in a primary healthcare setting in Nicaragua. PLoS ONE 4:e7907
9. Jefferson T, Demicheli V, Rivetti D, Jones M, Di Pietrantonj C, Rivetti A (2006) Antivirals for influenza in healthy adults: systematic review. Lancet 367:303–313
10. Jennings LC, Skopnik H, Burckhardt I, Hribar I, Del Piero L, Deichmann KA (2009) Effect of rapid influenza testing on the
clinical management of paediatric influenza. Influenza Other Respi Viruses 3:91–98
11. Newcombe RG (1998) Two-sided confidence intervals for the single proportion: comparison of seven methods. Stat Med 17:857–872
12. Ozkaya E, Cambaz N, Coskun Y, Mete F, Geyik M, Samanci N (2009) The effect of rapid diagnostic testing for influenza on the reduction of antibiotic use in paediatric emergency department. Acta Paediatr 98:1589–1592
13. Rouleau I, Charest H, Douville-Fradet M, Skowronski DM, De Serres G (2009) Field performance of a rapid diagnostic test for influenza in an ambulatory setting. J Clin Microbiol 47:2699– 2703
14. Sandora TJ, Smole SC, Lee GM, Chung S, Williams L, McAdam AJ (2010) Test characteristics of commercial influenza assays for detecting pandemic influenza A (H1N1) in children. Pediatr Infect Dis J 29(3):261–262
15. Suntarattiwong P, Jarman RG, Levy J, Baggett HC, Gibbons RV, Chotpitayasunondh T, Simmerman JM (2010) Clinical
perfor-mance of a rapid influenza test and comparison of nasal versus throat swabs to detect 2009 pandemic influenza A (H1N1) infection in Thai children. Pediatr Infect Dis J 29(4):366–367 16. Swiss Department of Public Health (2010) Pandemic (H1N1)
2009 influenza: hebdomidary report of the Swiss Department of Public Health (2010). http://www.bag.admin.ch/influenza/01120/ 01134/index.html?lang=de#sprungmarke0_11. Accessed 28 Apr 2010
17. Vasoo S, Stevens J, Singh K (2009) Rapid antigen tests for diagnosis of pandemic (swine) influenza A/H1N1. Clin Infect Dis 49:1090–1093
18. Watanabe M, Nakagawa N, Ito M, Ihara T (2009) Sensitivity of rapid immunoassay for influenza A and B in the early phase of the disease. Pediatr Int 51:211–215
19. World Health Organization (2009) CDC realtime RTPCR (rRTPCR) protocol for detection and characterization of swine influenza (version 2-2009). http://www.who.int/csr/resources/publications/ swineflu/CDCRealtimeRTPCR_SwineH1Assay-2009_20090430. pdf. April 28, 2009. Accessed 28 Apr 2010.