ERG components of negative polarity from the inner retina and the optic nerve
response
Gu¨nter Niemeyer
Department of Ophthalmology, University Hospital Zurich, Zurich, Switzerland
Accepted 28 November 2005
Key words: proximal retina, electrical stimulation, ERG, optic nerve response, PhNR, PNR, STR
Abstract
ERG components of negative polarity in the light-adapted and in the dark-adapted inner retina are reviewed from a clinical perspective and include consideration of experimental research. Field potentials are inherently complex including summating contributions from specialized neurons as well as from glial elements. This property applies to the PERG, PhNR and to the STR. Experimental research can contribute to identifying the sites/cells of origins i.e. by determining depth profiles and by pharmacological manip-ulation. Intraretinal microelectrode-studies and pharmacological dissection of light-evoked responses have elucidated the origin of field potentials from the retinal pigment epithelium to the retinal ganglion cells. Thresholds for dark-adapted response components have been compared. Attenuation of the STR by anesthesia was found in cats in vivo when compared to threshold intensities used in isolated eye prepara-tions in vitro, suggestive of depression of inner retinal activity by anesthetics. Evidence has been presented for antidromically elicited retinal responses of negative polarity that resemble the STR and summate with the light-evoked retinal response. This observation supports the notion that negative field potentials and components as recorded in the vitreous and at the cornea receive contributions from retinal ganglion cells. The weight of this contribution appears to vary among species, at least concerning the STR. The ocular negative reponses from the inner retina are compared to cortical excitatory mechanisms generating nega-tivity in the baseline of the EEG.
In the light of an increasing interest in assess-ing the function of the inner retinal layers, I shall briefly review the responses and components of negative polarity that are generated in the inner retina. For a detailed background of these sig-nals, which largely reflect various aspects of gan-glion cell and amacrine cell activity, the reader is referred to [1–3]. Clinically accessible signals of this sort are shown in a cartoon (Figure 1) and, together with experimentally characterized responses listed in Table 1. I shall also review the properties of the optic nerve action potential including previously unpublished data obtained by antidromic electrical stimulation, which gener-ates retinal field potentials of negative polarity as well.
Clinically accessible signals
Scotopic Threshold Response, STR
Among the clinically accessible signals embedded as components in the electroretinogram (ERG), I first address the scotopic threshold response, STR (Figures 1–3). The STR is a rod-driven response to very weak stimuli under full dark adaptation [4]. The signal is sensitive to very dim levels of background light [5, 36] appearing with stimuli below the threshold intensity for the b-wave, and generating measurable amplitudes about 1.0 units above the psychophysical thresh-old (summarized in Figure 5). In a recent study, Jost found a difference of 0.99 log units between
the STR recorded and the psychophysical thresh-old using the same Ganzfeld stimulator for both [6]. Due to processes of amplification from
photo-receptors to third order neurons [37] and mecha-nisms of inner retinal network adaptation the STR can reflect remaining sensitivity in advanced
Figure 1. Cartoon of mammalian retina, of selected signals from the retina and approximate sites of generation of ERG compo-nents. Note that proximal negative responses (PNR) and optic nerve responses (ONR) are obtained in experimental situations. Ver-tical arrows indicate the stimulus.
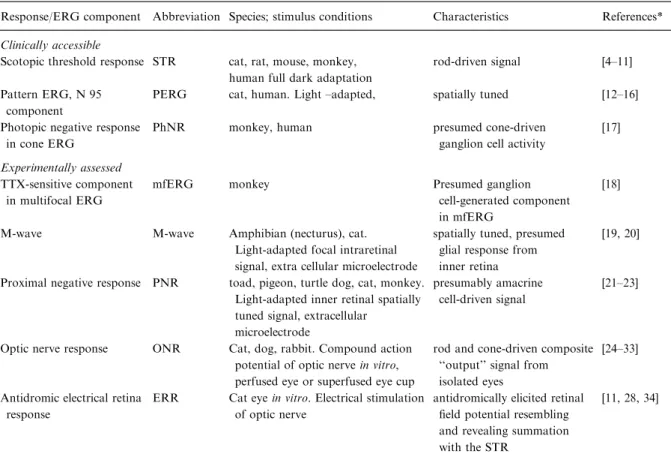
Table 1. Overview of signals of negative polarity from inner retina and optic nerve
Response/ERG component Abbreviation Species; stimulus conditions Characteristics References* Clinically accessible
Scotopic threshold response STR cat, rat, mouse, monkey, human full dark adaptation
rod-driven signal [4–11] Pattern ERG, N 95
component
PERG cat, human. Light –adapted, spatially tuned [12–16] Photopic negative response
in cone ERG
PhNR monkey, human presumed cone-driven ganglion cell activity
[17]
Experimentally assessed TTX-sensitive component
in multifocal ERG
mfERG monkey Presumed ganglion cell-generated component in mfERG
[18]
M-wave M-wave Amphibian (necturus), cat. Light-adapted focal intraretinal signal, extra cellular microelectrode
spatially tuned, presumed glial response from inner retina
[19, 20]
Proximal negative response PNR toad, pigeon, turtle dog, cat, monkey. Light-adapted inner retinal spatially tuned signal, extracellular
microelectrode
presumably amacrine cell-driven signal
[21–23]
Optic nerve response ONR Cat, dog, rabbit. Compound action potential of optic nerve in vitro, perfused eye or superfused eye cup
rod and cone-driven composite ‘‘output’’ signal from isolated eyes
[24–33]
Antidromic electrical retina response
ERR Cat eye in vitro. Electrical stimulation of optic nerve
antidromically elicited retinal field potential resembling and revealing summation with the STR
[11, 28, 34]
inherited degeneration of the retina [7] when the a- and b-waves of the ERG have vanished. We observed that the STR is sensitive to general anesthesia (Figure 20 in [6]): the threshold in the anaesthetized cat was on average 1.25 log units above the threshold intensity for the STR in the isolated perfused cat eye. Examples of human, anesthetized rat and cat (in vitro) STRs are shown in Figure 2. The STR thus represents an exqui-sitely sensitive tool for selective monitoring of rod function in clinical as well in research settings [38–40].
The generation of the STR comprises the complex rod circuit involving four classes of amacrine cells [41] in addition to ganglion cells and Mu¨ller cells. The reciprocal synapses of ama-crine- to bipolar cells are likely to be sites of sig-nal amplification in the inner retina [37]. The multifold contributions to the STR can be de-duced from two studies that addressed loss of the ganglion cells: Sieving [38] reported only changes in configuration and in timing of the STR in cats up to 21 months after sectioning the optic nerve with histologically identified loss of ganglion cells and corresponding thinning of the nerve fiber layer. In the same study a patient with
long-standing posttraumatic unilateral atrophy of the optic nerve was examined electrophysiologically. The STR in the affected eye still generated STRs that, however deviated in configuration, ampli-tude and timing from those recorded in the con-trol eye of the patient. In macaque monkeys, in contrast, loss of ganglion cells and severe visual field defects induced by experimental glaucoma led to attenuation or loss of the STR [40]. The authors conclude that the balance of contributing cells generating the signals in the proximal retina varies greatly among species.
Photopic Negative Response, PhNR
Light-adapted components of negative polarity in the clinical ERG include the Photopic negative response, PhNR, and the N 95 component of the pattern ERG (Figure 1). The single flash Ganz-feld cone-driven (photopic) ERG recorded after 10 min of adaptation to a rod-suppressing back-ground light is a fast signal with a brief a-wave followed by a spike-like b-wave with rigid timing [2]. Following the b-wave a broad trough below the baseline can be seen under standard stimulus conditions, but is best generated using red flashes
Figure 2. Typical traces of scotopic threshold responses. (a) human STR intensity series recorded with a DTL fibre electrode from a 30 yr old volunteer, average of 4, with the STR appearing at an intensity of)5.19 log cd.s/m2from [6]. (b) intensity series of
ERGs (right column) and optic nerve responses (left column) recorded from an in vitro arterially perfused mammalian eye (from [5] by permission). For the ONR recordings longer pulses were used in order to analyze/observe the OFF-components. (c) Average of STR recordings from 5 healthy fully dark adapted rats (R. Bush and G. Niemeyer, unpublished; [35]).
presented on a blue background [17]. Experimen-tal evidence [17] and clinical observation in glau-coma and diseases compromising the optic nerve unequivocally show that retinal ganglion cells provide a major contribution to the PhNR. Potentially broad clinical use of this photopic component of the standard Ganzfeld ERG is anticipated.
N 95 component of the pattern ERG
The first comprehensive description [12] and recent reviews [13, 14] document the importance of the pattern ERG (PERG) as a key instrument in assessing the site of visual dysfunction in the axis from photoreceptors to the visual cortex in ophthalmology and neuro-ophthalmology. The
negative component ‘‘N95’’, a signal of particular diagnostic value is understood to be generated by retinal ganglion cells and related cells responding to stimulation with higher spatial frequencies [15].
Experimentally obtainable signals
TTX-sensitive component of the multifocal ERG
Experimental approaches were and will be nec-essary to further elucidate the origin of the components underlying the inherently complex field potential, the ERG. A number of signals of negative polarity have been recorded and attributed to inner retinal structures. Using the multifocal ERG (mfERG) in anesthetized mon-keys, Hood et al. [18] recorded changes after intravitreal application of micromolar concen-trations of TTX, a sodium channel-blocking compound. Comparison of the mfERG before and after the action of TTX revealed a mainly negative component, that could be attributed to ganglion cell and perhaps also to amacrine cell activity.
M-wave: A local ERG component of negative polarity in the inner retina is the M-wave, first recorded and analyzed by Karwoski and Proenza [19] in the amphibian retina. It has been attrib-uted mainly to changes in extracellular concen-tration of potassium ([K+]o) as caused by
depolarization of the glial Mu¨ller cells [42]. The signal was recorded extracellularly by microelec-trodes in the inner retina and exhibited spatial tuning. The relatively slow negative response ap-peared at onset as well as at offset of a light stimulus. Sieving, Frishman and Steinberg [20] were the first to record M-waves in mammalian retina. They used a small spot of light and a white background centered on the tip of the microelectrode at 25% retinal depth. The M-wave could be clearly separated from the intrare-tinal b-wave (P II) as well as from the faster PNR and from the STR.
Proximal negative response (PNR)
Another experimentally well-established signal in the inner retina is the proximal negative response, PNR, recorded first by Burkhardt [21]
Figure 3. Proximal negative responses (PNR) at recorded by means of a microelectrode in the toad retina at increasing stimulus intensity (bottom to top), modified from [21] with permission. Note that negative polarity is displayed upwards.
in the amphibian retina (Figure 3). It is a signal of negative polarity recordable near or within the inner retina with spatially tuned flashes centered around the microelectrode. The configuration of the response resembles that of the negative, tem-porally dispersed optic nerve response (see be-low) with clear-cut ON- and OFF-components. The signal has been attributed mainly to ama-crine cells, which exhibit a synaptic network of particularly high density in the amphibian retina. Dowling and Ripps [22] found that in the skate retina application of TTX failed to greatly affect the PNR and concluded that the signal reflects a depolarization of the resting membrane potential rather than spike-responses of amacrine cells. Ogden [23] reported PNR recordings from mon-key and also from chicken, pigeon, turtle and dog, revealing the PNR as a signal generated in all species studied.
The optic nerve response recordedin vitro in relation to the STR
Finally I shall discuss the summed action poten-tial of the mammalian optic nerve as recorded
from the isolated arterially perfused feline eye in vitro [24–27]. The in vitro perfused isolated mammalian eye preparation affords the opportu-nity to monitor the summed ganglion cell activity as the output of retinal excitation via a simple Ag–AgCl suction electrode at the severed end of the optic nerve and a surface electrode
(Figure 4a). The typical configuration of the light-evoked temporally dispersed compound action potential at higher stimulus intensity consists of a rapid ON-component, a variable plateau- and a complex OFF-component (Fig-ure 4b). The complexity of this field potential with oscillations at higher stimulus intensities is understood to arise from the integration of the various firing patterns of the different classes of the estimated 193000 axons of retinal ganglion cells [28–31]. The configuration of the responses shown in Figure 4 resembles in polarity, shape and timing the compound action potentials re-corded from the optic nerve as well as from within the disc after stimulation of the optic tract of rhesus monkeys [28]. The ONR has a much faster time course than the changes in [K+]o that are generated by slow Mu¨ller cell
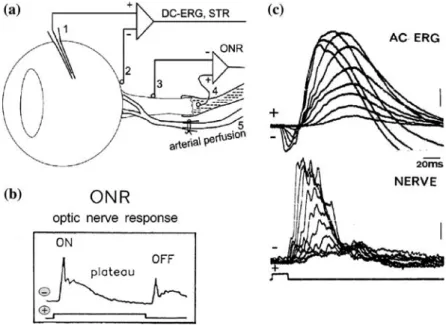
Figure 4. Cartoon of the recording setup of an isolated, arterially perfused feline eye and typical in vitro recorded light evoked sig-nals. (a) Setup in vitro perfused isolated mammalian eye. 1 and 4: dc electrodes [43], 2 and 3: AgAgCl reference electrodes, 5: PE cannula tied to the ophthalmociliary artery for perfusion with oxygenated, serum-enriched tissue culture medium at 37.5°C. (b) Optic nerve response elicited by a submaximal stimulus intensity in dark adaptation, revealing the characteristic components of this temporally dispersed negative compound action potential. (c) superimposed single traces of ERGs (top) and ONRs at increasing intensity in response to pulses of 20 ms in duration under dark adaptation. Calibration bars: 200 lV for ERG, and 100 lV for the optic nerve responses.
activity [44]; Niemeyer and Steinberg, unpub-lished results.
An optic nerve response of similar configura-tion revealing the different conducconfigura-tion velocities of ganglion cell classes can be elicited by antero-grade electrical stimulation [27, 28]. Several experimental studies have revealed the selective sensitivity of ONR components to pharmacologi-cal manipulations [reviewed in 29; 45–49].
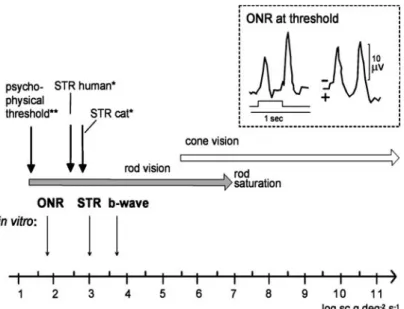
ONRs generated by increasing intensities of brief (20 ms) pulses can be compared to ERGs recorded in the same preparation (Figure 4c). At threshold intensities, the ONR was about 1 log unit more sensitive than the STR (Figures 2b, 5), [6, 11, 27].
Values reported for the absolute sensitivity of the STR depend on noise levels as well as on the criterion voltage chosen, and both differ among studies. The relation between the threshold of the ERG as represented by the STR and the ONR is of interest since the signals share the primary generating structure, the retinal ganglion cells. The STR and the ONR both have the same polarity and a similar shape as illustrated in Fig-ure 6: responses to photic stimulation for 400 ms duration have been scaled to the ONR and are displayed with negativity downwards. Note that the long stimulus duration elicited negative OFF
responses in both the ONR and in the STR tra-ces. The latency consistently was found to be longer for the STR than for the ONR. Much like the b-wave, the STR thus is preceded by the summed response of the axons of the retinal gan-glion cells. ERG components as field potentials are understood to reflect neuronal as well as slower glial components. This difference in tim-ing has been observed previously [24, 25, 32].
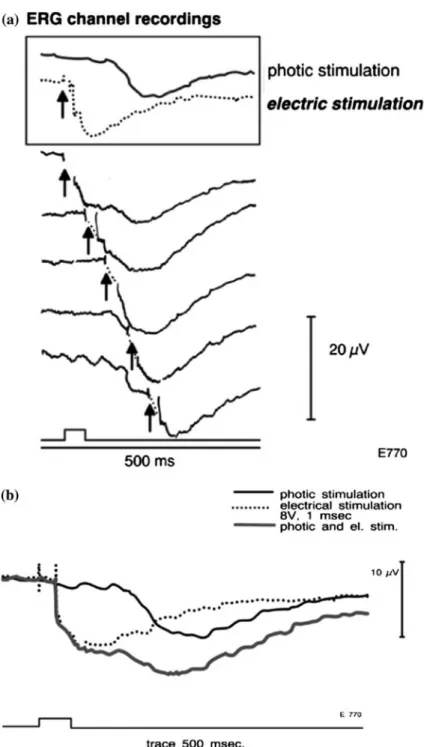
Antidromic electrical stimulation of the optic nerve elicits a negative retinal retinal response
In an attempt to elucidate the negative polarity of the signals discussed here, our laboratory became interested in antidromic electrical stimu-lation of the ganglion cells via the optic nerve in vitrowhile recording the ERG channel without photic stimulation. Pulses of 1 ms in duration and of 5–15 V were applied to the optic nerve using the electrode configuration described above. Recordings in the ERG channel exhibited a marked stimulus artifact with a barely detect-able signal latency due to the short distance of the stimulating electrodes. The artifact was fol-lowed by a temporally dispersed signal of nega-tive polarity that resembled the STR. The electrically driven retinal response was saturable
Figure 5. Comparative graph of threshold intensities found to elicit the ERG, STR, and ONR from human, anaesthetized cats (upper half) and from in vitro perfused cat eyes (lower half).§ONR, optic nerve response recorded in vitro. *from Robson and
Frishman [8]. **from Finkelstein and Gouras [50]. Inset: ONR traces near threshold recorded in a perfused mammalian eye. Rep-rinted from [27] with permission from Elsevier.
when increasing the stimulus strength to about 12 V. More importantly, combination of electri-cal stimulation with sub maximal photic stimula-tion revealed summastimula-tion (Figure 7). These results support the hypothesis that ganglion and ama-crine cells in combination with and Mu¨ller cells generate field potentials of negative polarity that can be recorded in the vitreous and at the cornea due to passive volume conduction.
An attempt to understand the electrical evoked retinal potential recorded in the perfused eye preparation has to consider the depolariza-tion of Mu¨ller cells by stimuladepolariza-tion of the optic nerve: Miller, Dacheux and Proenza have shown extra- and intracellular recordings from Mu¨ller cells in axolotl following light as well as anti-dromic electrical stimulation [42]. In fact, the antidromic response recorded near the retinal sur-face (Figure 2a in [42]) exhibits a configuration similar to the electrically evoked vitreal signal re-corded in the perfused cat eye (Figures 6 and 7). The authors conclude that light evoked and anti-dromically generated depolarizations interact in Mu¨ller cells. The corresponding depth profile (Figure 2c in [42]) indicates the origin of the neg-ative field potential in the inner retina and shows a change in polarity near the middle of axolotl retina. This would be in keeping with earlier experimental results of Ogden and Brown [51] who described a ‘‘P wave’’, a positive response
re-corded intraretinally in cynamolgus monkey near the fovea to transretinal or antidromic electrical stimulation. The depth profile of the P wave exhibits as well negative polarity in the innermost retinal layers (see also review by Karwoski [34].
Gouras [52] analyzed graded negative poten-tials in the optic nerve fiber layer of rhesus mon-key in the course of identifying phasic and tonic retinal ganglion cells that resemble the antidrom-ically elicited vitreal potentials presented here. Gouras proved the retinal origin of the P wave as opposed to the previously postulated centrifu-gal origin. Direct comparison of these intrareti-nal field potentials to the vitreal sigintrareti-nals of negative polarity discussed in the present study requires caution considering differences in recording techniques such as position of the ref-erence electrodes and filter bandwidths, as well as species differences.
Depolarization of cells and axons in the inner retina.
The components of negative polarity generated in the proximal retina correspond to depolariza-tion of dipole structures arranged predominantly in layers parallel to the retinal surface (amacrine cells, ganglion cells, axons of the ganglion cells). The respective field potentials with contributions from depolarization of Mu¨ller cells produce
neg-Figure 6. STR traces scaled to the simultaneously recorded ONR of a similar amplitude. The responses were recorded from dark adapted perfused cat eye at very low stimulus intensity and are displayed at the same polarity. The calibration bar refers to the ONR. Recordings were obtained near threshold (white light from xenon source, attenuated by 8.0 log neutral density filters). Aver-age of 32 sweeps, photocell trace below the signals.
ative waveforms. Depolarization of saggitally oriented dipoles are understood to cause the neg-ative a-wave and the positive polarity of the b-wave, generated primarily by photoreceptor
cells and by ON-bipolar cells, respectively, and probably by their interaction with Mu¨ller cells. The negative polarity and configuration of the retinal responses to antidromic electrical stimulation
Figure 7. Traces from the ERG channel in perfused cat eyes revealing the light evoked STR as well as retinal negative potentials elicited by antidromic electrical stimulation of the optic nerve. (a) STRs elicited by the light pulse indicated by upward deflection of the trace at the bottom and electrically responses elicited at increasing delays as marked by the arrows. (b) Detailed display reveals the summation of the light evoked with the electrically elicited retinal signals [11].
of the optic nerve reported above supports this view: the generation of an STR-like field poten-tial results from the activation of ganglion cells and probably from the depolarization of Mu¨ller cells [11].
Extensive electroencephalographic studies re-lated to the issue of propagation of outspread excitatory signals of negative polarity to a dis-tant recording site have been reviewed by Bir-baumer et al. [53]: Excitatory postsynaptic potentials in cortical layer I exhibit current sinks that generate negative baseline shifts to the scalp. These slow potentials (latencies of >200 ms) occur under a number of clinical and experimental conditions may serve as an ana-logue for our understanding of the inner retinal excitatory signals of negative polarity as re-corded from vitreous and cornea.
Summary
ERG components of negative polarity in the light-adapted and in the dark-adapted inner ret-ina are reviewed from a clinical perspective and include consideration of experimental research. Field potentials are inherently complex including summating contributions from specialized neu-rons as well as from glial elements. This property applies to the PERG, PhNR and to the STR. Experimental research can contribute to identify-ing the sites/cells of origins i.e. by determinidentify-ing depth profiles and by pharmacological manipula-tion. Intraretinal microelectrode-studies and pharmacological dissection of light-evoked re-sponses have elucidated the origin of field poten-tials from the retinal pigment epithelium to the retinal ganglion cells.
Thresholds for dark-adapted response compo-nents have been compared. Attenuation of the STR by anesthesia was found in cats in vivo when compared to threshold intensities used in isolated eye preparations in vitro, suggestive of depression of inner retinal activity by anesthetics. Evidence has been presented for antidromically elicited retinal responses of negative polarity that resemble the STR and summate with the light-evoked retinal response. This observation sup-ports the notion that negative field potentials and components as recorded in the vitreous and
at the cornea receive contributions from retinal ganglion cells. The weight of this contribution appears to vary among species, at least concern-ing the STR. The ocular negative reponses from the inner retina are compared to cortical excit-atory mechanisms generating negativity in the baseline of the EEG.
Acknowledgements
I thank Pof. Urs Gerber as well as two anony-mous reviewers for constructive comments on the manuscript.
References
1. Fishman GA, Birch DG, Holder GE, Brigell MG. Electrophysiologic testing in disorders of the retina, optic nerve and visual pathway. 2nd ed. Ophthalmology mono-graphs. San Francisco: The foundation of the American Academy of Ophthalmology, 2001.
2. Gouras P, Niemeyer G. Electroretinography, Disorders of visual processing. In: Celesia G ed. Handbook of Clinical Neurophysiology Vol. 5, Edinburgh: Elsevier BV, 2005: 87– 97.
3. Principles and practice of clinical electrophysiology of vision. JR Heckenlively and GB Arden, eds. Mosby Year book, St Louis, 1991.
4. Sieving PA, Frishman LJ, Steinberg RH. Scotopic thresh-old response of proximal retina in cat. J Neurophysiol 1986; 56: 1049–1061.
5. Kuze M, Niemeyer G. Absolute sensitivity of the electroretinogram and of the optic nerve action potential in the perfused feline eye. Jpn J Ophthalmol 2003; 47: 362–367.
6. Jost K. Vergleich der Lichtreizschwelle der Ele-ktroretinogramms (ERG) des Menschen, der ana¨sthesier-ten Katze und des perfundierana¨sthesier-ten Katzenauges. MD thesis Faculty of Medicine, University Zurich, 2003.
7. Bush RA, Hawks KW, Sieving PA. Preservation of inner retinal responses in the aged royal college of surgeon’s rat. Invest Ophthalmol Vis Sci 1995; 36: 2054–2062.
8. Robson JG, Frishman LJ. Dissecting the dark-adapted electroretinogram. Documenta Ophthalmol 1999; 3–4: 187–215.
9. Sieving PA, Nino C. Scotopic threshold response (STR) of the human electroretinogram. Invest Ophthalmol Vis Sci 1988; 29: 1608–1614.
10. Aylward GW, Billson FA. The scotopic threshold response in man. Clin Vision Sci 1989; 4: 373–377.
11. Niemeyer G, Jost K. Comparison of scotopic threshold response with optic nerve response and electrically driven retinal field potentials in vitro. Invest Opthalmol Vis Sci. 2002 (Suppl) 72:# 1815.
12. Arden GB, Veagan. Electroretinograms evoked in man by local uniform or patterned stimulation. J Physiol 1983; 341: 85–104.
13. Holder G. the pattern electroretinogram and an integrated approach to visual pathway diagnosis. Progr Retin Eye Res 2001; 20: 531–561.
14. Holder GE, Robson AG, Hogg CR, Kurz-Levin M, Lois N, Bird AC. Pattern ERG: clinical overview, and some observations on associated fundus autofluorescence imag-ing in inherited maculopathy. Documenta Ophthalmol 2003; 106: 17–23.
15. Harrison JM, O’Connor PS, Young RSL, Kincaid M, Bentley R. The pattern ERG in man following surgical resection of the optic nerve. Invest Ophthalmol Vis Sci 1987; 28: 492–499.
16. Maffei L, Fiorentini A. Electroretinographic response to alternating gratings before and after section of the optic nerve. Science 1981; 211: 953–954.
17. Viswanathan S, Frishman LJ, Robson JG, Harwerth RS, Smith EL III. The photopic negative response of the macaque electroretinogram: reduction by experimental glaucoma. Invest Ophthalmol Vis Sci 1999; 40: 1124–1136. 18. Hood DC, Frishman LJ, Viswanathan S, Robson JG, Ahmed J. Evidence for a ganglion cell contribution to the primate electroretinogram (ERG): effects of TTX on the multifocal ERG in macaque. Vis Neurosci 1999; 16(3): 411–416.
19. Karwoski CJ, Proenza LM. Relationship between Mu¨ller cell responses, a local transretinal potential, and potassium flux. J Neurophysiol 1977; 40: 244–259.
20. Sieving PA, Frishman LJ, Steinberg RHS. M wave of proximal retina in cat. J Neurophysiol 1986; 56(4): 1039–1048. 21. Burkardt DA. Proximal negative response in frog retina.
J Neurophysiol 1970; 33: 405–420.
22. Dowling JE, Ripps H. The proximal negative response and visual adaptation in the skate retina. J Gen Physiol 1977; 69: 57–74.
23. Ogden TE. The proximal negative response of the primate retina. Vision Res 1973; 13: 797–807.
24. Gouras P, Hoff M. Retinal function in an isolated, perfused mammalian eye. Invest Ophthalmol 1970; 9: 388–399. 25. Niemeyer G. The function of the retina in the perfused eye.
Documenta Ophthalmol 1975; 39: 53–116.
26. Niemeyer G. Neurobiology of perfused mammalian eyes. J Neurosci Methods 1981; 3: 317–337.
27. Niemeyer G. Retinal research using the perfused mamma-lian eye. Progr Retin Eye Res 2001; 20(3): 289–318. 28. Ogden TE, Miller RF. Studies of the optic nerve of the
rhesus monkey: nerve fiber spectrum and physiological properties. Vision Res 1966; 6: 485–506.
29. Hughes A, Wa¨ssle H. The cat optic nerve: fibre total count and diameter spectrum. J Comp Neurol 1976; 169: 171–184. 30. Doty RW, Kimura DS. Oscillatory potentials in the visual system of cats and monkeys. J Physiol 1963; 186: 205–218. 31. Bishop PO, Jeremy D, Lance JW. The optic nerve. Properties of a central tract. J Physiol 1953; 121: 415–432. 32. Ames A III, Gurian BS. Measurement of function in an in vitro preparation of mammalian central nervous tissue. J Neurophysiol 1960; 23: 676–691.
33. Niemeyer G, Kleinert D. Scotopic threshold response and optic nerve action potential of the perfused cat eye share
important features. Invest Ophthamol Vis Sci (Suppl) 2001; 42: S179.
34. Karwoski C. Retinal extraxcellular potential responses not evoked by light. Chapter 17. In: Heckenlively JR, Arden GB eds. Principles and practice of clinical electrophysiol-ogy of vision, St Louis: Mosby Year book, 1991. 35. Bush RA, Reme´ C. Chronic lithium treatment induces
reversible and irreversible changes in the rat ERG in vivo. Clin Vision Sci 1992; 7: 393–401.
36. Frishman LJ, Reddy MG, Robson JG. Effects of back-ground light on human dark-adapted electroretinogram and psychophysical threshold. J Opt Soc Am 1996; 13: 601–612.
37. Copenhagen DR, Hemila¨ S, Reuter T. Signal transmission through the dark-adapted retina of the toad. J Gen Physiol 1990; 95: 717–732.
38. Sieving PA. Retinal ganglion cell loss does not abolish the scotopic threshold response (STR) of the cat and human ERG. Clin Vision Sci 1991; 6(2): 149–158.
39. Korth M, Nguyen NX, Horn F, Martus P. Scotopic threshold response and scotopic PII in Galucoma. Invest Ophthalmol Vis Sci 1994; 35: 619–625.
40. Frishman LJ, Shen FF, Du L, Robson JG, Harwerth RS, Smith EL III, Carter-Dawson L, Crawford MLJ. The scotopic electroretinogram of macaque after retinal gan-glion cell loss from experimental glaucoma. Invest Oph-thalmol Vis Sci 1996; 37: 125–141.
41. Kolb H. The neural organization of the human retina Chapter 5. In: Heckenlively JR, Arden GB eds. Principles and practice of clinical electrophysiology of vision, St Louis: Mosby Year book, 1991.
42. Miller RF, Dacheux R, Proenza L. Mu¨ller cell depolariza-tion evoked by antidromic optic nerve stimuladepolariza-tion. Brain Res 177; 121:162–166.
43. Niemeyer G, Kueng N. A simple and stable d.c. electrode for ocular electrophysiology. Documenta Ophthalmol 1999; 95: 55–61.
44. Orkand RK, Nicholls JG, Kuffler SW. Effect of nerve impulses on the membrane potential of glial cells in the central nervous system of amphibia. J Neurophysiol 1966; 29: 788–806.
45. Gerber U, Niemeyer G. Beta-adrenergic antagonists mod-ify retinal function in the perfused cat eye. Clin Vision Sci 1988; 3(4): 255–266.
46. Kaelin-Lang A, Jurklies B, Niemeyer G. Effects of adenosinergic agents on the vascular resistance and on the optic nerve response in the perfused cat eye. Vision Res 1999; 39(6): 1059–1068.
47. Jurklies B, Kaelin-Lang A, Niemeyer G. Cholinergic effects on cat retina in vitro: changes in rod- and cone-driven b-wave and optic nerve response. Vision Res 1996; 36: 797–816.
48. Uji Y, Kuze M, Matubara H, Motoaki D, Sasoh M. Effects of the b1-selective adrenergic antagonist betaxolol on electroretinography in the perfused cat eye. Documenta Ophthalmol 2003; 106: 37–41.
49. Macaluso C, Frueh B, Kaelin-Lang A, Onoe S, Niemeyer G. Multiple effects of adenosine in the arterially perfused mammalian eye. Possible mechanisms for the neuropro-tective function of adenosine in the retina. Documenta Ophthalmol 2003; 106: 51–59.
50. Finkelstein D, Gouras P. Human electroretinogram near absolute threshold of vision. Int Ophthalmol Clin 1969; 9(4): 1073–1981.
51. Ogden TE, Brown KT. Intraretinal responses of the cynamolgus monkey to electrical stimulation of the optic nerve and retina. J Neurophysiol 1964; 27: 682–705. 52. Gouras P. Antidromic responses of orthodromically
iden-tified ganglion cells in monkey retina. J Physiol 1969; 204: 407–419.
53. Birbaumer N, Elbert T, Canavan AgM, Rockstroh B. Slow potentials of the cerebral cortex and behavior. Physiol Reviews 1990; 70: 1–41.
Address for correspondence:Gu¨nter Niemeyer, Wissmannstr.16, CH-8057-Zurich, Switzerland
![Figure 2. Typical traces of scotopic threshold responses. (a) human STR intensity series recorded with a DTL fibre electrode from a 30 yr old volunteer, average of 4, with the STR appearing at an intensity of ) 5.19 log cd.s/m 2 from [6]](https://thumb-eu.123doks.com/thumbv2/123doknet/14877306.642742/3.829.84.751.107.451/typical-threshold-responses-intensity-electrode-volunteer-appearing-intensity.webp)
![Figure 3. Proximal negative responses (PNR) at recorded by means of a microelectrode in the toad retina at increasing stimulus intensity (bottom to top), modified from [21] with permission](https://thumb-eu.123doks.com/thumbv2/123doknet/14877306.642742/4.829.80.393.95.627/proximal-negative-responses-microelectrode-increasing-intensity-modified-permission.webp)