ABSTRACT: Consumption of CLA by lactating women affects the composition of their milk, but the pattern of the different CLA isomers is still unknown. We determined the effects of short ma-ternal supplementation with CLA-rich Alpine butter on the occur-rence of FA and CLA isomers in human milk. In an open random-ized controlled study with a two-period cross-over design, milk FA and CLA isomer concentrations were measured on postpar-tum days ≥20 in two parallel groups of lactating women before, during, and after consumption of defined quantities of Alpine but-ter or margarine with comparable fat content (10 d of butbut-ter fol-lowed by 10 d of margarine for one group, and vice versa in the other). In the 16 women who completed the study (8/group), Alpine butter supplementation increased the C16and C18FA, the sum of saturated FA, the 18:1 trans FA, and the trans FA with CLA. The CLA isomer 18:2 c9,t11 increased by 49.7%. Significant in-creases were also found for the isomers t9,t11, t7,c9, t11,c13, and t8,c10 18:2. The remaining nine of the total 14 detectable iso-mers showed no changes, and concentrations were <5 mg/100 g fat. A breastfeeding mother can therefore modulate the FA/CLA supply of her child by consuming Alpine butter. Further studies will show whether human milk containing this FA and CLA iso-mer pattern acts as a functional food for newborns.
Paper no. L9632 in Lipids 40, 581–587 (June 2005).
Human milk (from German women) contains more long-chain FA, with long-chain lengths of C20to C24including several double bonds, than bovine milk fat. It contains a high propor-tion of palmitic acid (16:0, 25.3%) and the isomeric groups of 18:1 and 18:2, their main components being oleic acid (c9, 29.0%) and linoleic acid (c9,c12, 9.5%) (8).
The major CLA isomer is c9,t11-octadecadienoic acid (c9,t11 18:2) (1), also called rumenic acid (2). Although linoleic acid is isom-erized by the enzymatic conversion of the c12 to the t11 bond by the anaerobe Butyrivibrio fibrisolvens in the rumen (3), an estimated 64% of dairy milk fat CLA is of endogenous origin (4). Total CLA and isomer concentrations in dairy milk fat de-pend on feeding (i.e., pasture, oilseeds), the effects of altitude and season, as well as the age and breed of the cow (5–7). Total CLA and isomer concentrations in human milk depend on maternal diet, stage of lactation, and de novo synthesis (8–12). As humans
do not synthesize PUFA, concentrations depend exclusively on dietary fat intake (13). A study reporting CLA concentrations (c9,t11 isomer) of 5.8 mg/g fat in milk from mothers on conven-tional diets vs. 11.2 mg/g fat in Hare Krishna mothers hypothe-sized that the difference was due to the large amounts of butter, ghee, and cheese consumed by the latter (9). Chronic dietary c9,t11 18:2 intake is thought to increase milk 18:2 c9,t11 concen-trations (10). The proportions of partially hydrogenated oils and ruminant fats in the diet also determine trans 18:1 isomeric distri-bution (8), whereas maternal diet, i.e.. consumption of different products or amounts of milk and meat, has been shown to corre-late with differences in the CLA content of human milk (11).
Several effects of a high-CLA diet in animals and humans have been described. However, for the effect of most interest to us, that on neonatal development, only animal data are avail-able: in rats, increased milk CLA concentrations in dams on a high-CLA diet are associated with enhanced pup weight gain (14). Recent studies have also shown that individual isomers have different effects.
The aim of the present investigation as an essential prelimi-nary to an efficacy study was to quantify CLA isomers and FA concentrations in human milk from mothers consuming defined quantities of CLA-rich Alpine butter.
SUBJECTS, MATERIALS, AND METHODS
Subjects. Following approval from the Institutional Review Board of the Departments of Obstetrics and Urology at Zurich University Hospital, healthy lactating women (n = 20) from the Obstetrics Department were recruited on day (D) 2–4 postpar-tum with their written informed consent. The noninclusion cri-teria were pre-existing disease, medication other than vitamins or minerals, HIV, mastitis, vegan or similar extreme diet, sub-stance abuse (including alcohol), smoking, and inability to un-derstand conversational German. Subjects started the study from D20 postpartum when at home and healthy in lactation stage III.
Protocol. Dietary treatment was randomized in sealed opaque envelopes according to an open controlled two-period cross-over design in two parallel groups. Group 1 followed a normal diet at home to day 20 postpartum (= study D1). From D1 through D10 (period 1), women were invited to supplement their diet with 40 g/d (4 packages of 10 g per 24 h) margarine (M) (Becel®;
*To whom correspondence should be addressed at Frauenklinikstrasse 10, CH–8091 Zürich, Switzerland. E-mail: [email protected] Abbreviations: BMI, body mass index; CLA, conjugated linoleic acid; EFA, essential fatty acid; FA, fatty acid; GC, gas chromatograph(y).
Maternal Dietary Alpine Butter Intake Affects Human
Milk: Fatty Acids and Conjugated Linoleic Acid Isomers
Isabelle Bertschia, Marius Collombb, Lukas Ristc, Pius Eberhardb, Robert Sieberb, Ulrich Bütikoferb, Daniel Wechslerb, Gerd Folkersd, and Ursula von Mandacha,*
aDepartment of Obstetrics, Zurich University Hospital, CH–8091 Zurich, bAgroscope Liebefeld-Posieux, Swiss Federal
Research Station for Animal Production and Dairy Products (ALP), CH–3003 Berne, cParacelsus Hospital, CH–8805 Richterswil, and dInstitute of Pharmaceutical Sciences, Swiss Federal Institute of Technology Zurich, CH–8092 Zurich, Switzerland
25.7 g fat, 4.3 g water, and an average of 2.09 g CLA/100 g milk fat (equivalent to approximately 0.5 g CLA/d). The difference between the daily amount of M (30 g) and AB (40 g), respec-tively, should result in an equal daily fat intake from the study products. Group 2 women followed the same dietary schedule in reverse order (period 1: AB; period 2: M).
The Alpine butter originated from Alp Mutten (Graubün-den, Switzerland, 2100 m altitude) and consisted of a blend of five 2-kg portions that was produced between July 1 and 25, 2003, and stored at −20°C until use. The 10-g portions of this blend contained 8.6 g fat, 1.4 g water, and 180.0 mg total CLA (corresponding to 2.09 g total CLA/100 g milk fat). The pre-dominant CLA isomers were c9,t11, t11,c13, t7,c9, and t8,c10 18:2. The FA and CLA composition of the two supplements is shown in Table 1.
The women had to record the real daily intake of study prod-ucts (weight). No additional Alpine milk or ruminant meat products were allowed during the study.
Dietary diary. The subjects documented potential additional sources of CLA by recording every day the estimated intake (volume or weight) of milk and dairy products (yogurt, sour cream, cream, cheese, etc.) and meat (type). The amount of a consumed product was given in the database of the EBIS pro-gram (15), which transforms the consumed volume or weight of a product in consumed grams fat by considering the prod-uct’s specific percent fat. From the daily fat intake, the daily CLA intake (milligrams) was calculated using the values of Fritsche and Steinhart (16,17) for CLA amounts (grams CLA per gram fat) in different foods (German and others); for chicken or turkey the CLA values of Chin et al. (1) were used.
Milk sampling. On D1, D5, D10, D15, and D20, the subjects took milk samples at home according to a standardized proce-dure assisted by the principal investigator (IB): between 8:00 and 11:00 A.M. and 1–3 h after a continental breakfast, the
breast that was not actually used for infant feeding at the last feed was emptied completely using an electric pump (Lacti-naTMElectric plus; Medela AG, Baar, Switzerland) and the
vol-ume measured; 2 × 10-mL aliquots were transferred to plastic tubes, cooled at +4°C (cold box), and stored at −20°C until analysis. The remainder was fed to the baby.
Lipid extraction and analysis of FA. (i) Lipid extraction. Milk fat was obtained gravimetrically using the Roese-Gottlieb method, i.e., the fat globule membranes were disrupted with ammonia and ethanol, the fat was extracted with diethyl ether and petroleum ether, and the pure fat was stored at −20°C until analysis (18).
(ii) FA. The milk fat was dissolved in hexane, and the glyc-erides were transesterified to the corresponding FAME using a solution of potassium hydroxide in methanol (2 mol/L) as per ISO standard 15885. FA composition was determined using a gas chromatograph (GC; Agilent 6890, www.agilent.com) equipped with an on-column injector and FID (19). Nearly 70 FA were separated on a capillary column (100 m × 0.25 mm ×
FA Unit Margarine Alpine butter
14:0 g 0.83 6.99 15:0 g 0.02 1.29 16:0 g 10.83 19.88 17:0 g 0.04 0.78 18:0 g 3.75 11.25 18:1 c9 g 24.24 20.55 18:1 t6-8 g <0.01 0.16 18:1 t9 g <0.01 0.28 18:1 t12 g <0.01 0.18 18:1 t13-14 + c6-8 g 0.01 0.62 18:2 c9,c12 g 46.70 1.53 18:2 t7,c9 + t8,c10 + c9,t11 g <0.01 1.85 18:2 c9,c11 + t9,t11 + t11,c13 g <0.01 0.14 18:2 t12,t14 mg ND 20.4 18:2 t11,t13 mg ND 33.2 18:2 t10,t12 mg ND 2.8 18:2 t9,t11 mg ND 15.0 18:2 t8,t10 mg ND 1.7 18:2 t7,t9 mg ND 10.2 18:2 t6,t8 mg ND 4.7 18:2 c/t12,14 mg ND 5.3 18:2 t11,c13 mg ND 148.2 18:2 c11,t13 mg ND 3.4 18:2 t10,c12 mg ND 1.6 18:2 c9,t11 mg ND 1767.3 18:2 t8,c10 mg ND 29.5 18:2 t7,c9 mg ND 49.0 18:3 c9,c12,c15 g 0.12 1.24 Saturated FAc g 18.97 51.80 Monounsaturated FAd g 25.41 29.87 PUFAe g 47.72 6.72 18:1 transf g 0.03 5.94 Σ18:2 g 47.34 5.03
18:2 trans without trans CLAg g 0.08 1.45
18:2 trans with CLAh g 0.09 3.31 transFA without CLAi g 0.11 7.72 transFA with CLAj g 0.12 9.59
n-3k g 0.93 2.22
n-6l g 46.79 2.38
aValues are means, n = 3.
bA selected summation of FA that addresses specific points to the discussion
is presented. CLA isomers were analyzed by silver-ion HPLC and are ordered according to their retention time; ND, not detectable; ttNMID, trans,trans non-methylene interrupted diene; ccMID, cis,cis methylene interrupted diene.
cAB: 4:0, 5:0, 6:0, 7:0, 8:0, 10:0, 12:0, 12:0 iso, 12:0 aiso, 13:0 iso, 14:0, 14:0
iso, 14:0 aiso, 15:0, 15:0 iso, 16:0, 16:0 iso, 16:0 aiso, 17:0, 17:0 iso, 17:0 aiso, 18:0, 19:0, 20:0, 22:0; M: 8:0, 10:0, 12:0, 14:0, 15:0, 16:0, 16:0 aiso, 17:0, 17:0 aiso, 18:0, 20:0, 22:0, 24:0.
dAB: 10:1, 14:1 ct, 16:1 ct, 17:1 ct, 18:1 -t4, -t5, -t6-8, -t9, -t10-11, -t12,
-(t13-14 + c6-8), 20:1 t, 20:1 c5, 20:1 c9, 20:1 c11; M: 16:1 c, 18:1 -t10, -c9, -c11, 20:1 c11.
eAB: 18:2 [Σ ttNMID, t9,t12, c9,t13 + (t8,c12), c9,t12 + (ccMID + t8,c13), t11,c15
+ t9,c12), -c9,c12, -c9,c15, 18:3 -c6,c9,c12, -c9,c12,c15, 18:2-(c9,t11 + -t8,c10 + -t7,c9), -(t11,c13 + -c9,c11), -t9,t11, 20:2 cc n-6, 20:3n-6, 20:3n-3, 20:4n-6, 20:5n-3, 22:5n-3, 22:6n-3; M: 18:2 -(c9,t12 + ccMID + -t8,c13), -(t11,c15 +
t9,c12], -c9,c12, -c9,c15, 18:3 c9,c12,c15, 20:3n-3, 20:4n-6, 20:5n-3.
fAB: 18:1 t4 to t13-14; M: 18:1 -t10.
gAB: 18:2 trans [Σ ttNMID, t9,t12, c9,t13 + (t8,c12), c9,t12 + (ccMID +,t8c13, t11,c15 + t9,c12]; M: 18:2 -(c9,t12 + t8,c13), -(t11,c15 + t9,c12).
hAB: 18:2 t + CLA trans (Σ C18:2 t7,c9, t8,c10, c9,t11, t9,t11, t11,c13);
M: 18:2 -(c9,t12 + t8,c13), -(t11,c15 + t9,c12).
iAB: 14:1 t, 16:1 t, 17:1 t, 20:1 t, 18:1 trans and 18:2 trans (without CLA trans); M: 18:1 t10, 18:2 -(c9,t12 + t8,c13), -(t11,c15 + t9,c12).
jAB: 14:1 t, 16:1 t, 17:1 t, 20:1 t, 18:1 trans, 18:2 trans and CLA trans; M:
18:1 t10, 18:2 -(c9,t12 + t8,c13), -(t11,c15 + t9,c12).
kAB: 18:2 -c9,c15 + -t11,c15, 18:3 c9,c12,c15, 20:3, 20:5, 22:5, 22:6; M:
18:2 -c9,c15, -t11,c15, 18:3 c9,c12c15, 20:3, 20:5.
lAB: 18:1 -t12, -c12, 18:2 –t9,t12, -c9,t12, -c9,c12, 18:3 c6,c9,c12, 20:2cc,
0.20 µm, CP-Sil 88; www.varianinc.com) and quantified in ab-solute values (g FA/100 g fat) using nonanoic acid as internal standard.
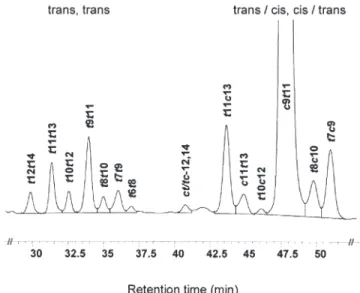
(iii) CLA isomers. CLA isomers were analyzed by silver-ion (Ag+) HPLC according to Rickert et al. (20), modified by Kraft et al. (21). The analysis was performed on an Agilent LC series 1100 equipped with a photodiode array detector (234 nm) using three ChromSpher Lipids columns in series (stainless steel, 250 × 4.6 mm, 5 µm particle size; Chrompack, Middleburg, The Netherlands). The solvent consisted of UV-grade hexane with 0.1% acetonitrile and 0.5% ethyl ether (flow rate 1 mL min−1), prepared fresh daily. Injection volumes were 10 µL, representing <250 µg lipid. The identification of CLA isomers was based on co-injection with commercial reference material and synthesized CLA. The methyl esters of c9,t11 (98%), t10,c12 (98%), and c9,t11 18:2 (75–78%) were obtained from Matreya Inc. (Pleas-ant Gap, PA). Other CLA isomers were synthesized by isomeri-zation of the commercially available reference (technical grade) with I2(22). The results were expressed as absolute values in mg per 100 g fat. Fourteen different CLA isomers were separated by this HPLC method (Fig. 1).
Statistical analysis. A power calculation was performed based on an expected difference in CLA human milk content of 30% between the two phases, Alpine butter (AB) and mar-garine (M). The power was 80% for n = 8/group (α = 0.5).
Data were entered into Excel, analyzed in Systat for Win-dows, version 10.2 (www.uic.edu/depts/accc/software), and ex-pressed as means ± SD. The Kolmogorov–Smirnov test was used for normality. Mean values were compared using the un-paired two-tailed t-test for cross-over design and a P value of <0.05. “Effect” refers to the differences between the two phases AB vs. M of group-pooled data, and “period” to the period ef-fect, i.e., the differences between the two phases AB and M of group 1 vs. group 2.
RESULTS
Subjects. Three women withdrew because of lactation failure and one developed diarrhea in response to Alpine butter, leav-ing eight subjects per group. The groups did not differ statisti-cally in age (27.8 ± 3.5 vs. 29.5 ± 5.6 yr, respectively), parity, gravidity, gestational age at delivery, or body mass index (BMI) during the study (Table 2).
Two group 2 women were excluded from the statistical analysis of the CLA isomers because of technical problems in the isomer analysis.
Study product intake and dietary diaries (Table 3). The mean daily intake of margarine was 29.75 g (group 1) and 30.25 g (group 2) and that of Alpine butter 22.0 g (group 1) and 23.75 g (group 2). Study product intake was thus below the re-quested level (margarine: up to 40.0 g; Alpine butter: up to 30.0 g). The higher intake of margarine than butter (P = 0.003) re-sulted in an equal daily fat intake in both groups (P = 0.25 dif-ferences between M and AB [effect] and difdif-ferences between the groups [period]). Fat intake was calculated from 60 g fat/100 g (margarine) and 85.8 g fat/100 g (Alpine butter) as specified in the Subjects, Materials, and Methods section.
Dietary nonsupplement CLA intake, calculated from the daily dietary records, also did not differ statistically (P = 0.52) between phases or groups. Extremely small or zero amounts of ruminant meat (beef) were recorded in both groups, as re-quested (data not shown).
Human milk. (i) Fat content. In neither group did fat con-tent of human milk differ significantly between margarine and butter phases (group 1: 3.3 ± 0.6 vs. 3.4 ± 1.6 g/100 mL milk; group 2: 2.9 ± 1.3 vs. 3.4 ± 1.1 g/100 mL milk) corresponding to a mean fat yield (g) per breast of 1.94 in the margarine and 1.90 in the butter phase (NS).
(ii) FA. The sum of saturated FA increased by 2.057 g/100 g fat during the pooled butter phases (P = 0.03), 18:1 trans FA by 0.428 g/100 g fat (P = 0.001), and trans FA with CLA by 0.178 g/100 g fat (P = 0.005) (all without period effects). There were significant pooled-group decreases in the butter phases in the sum of PUFA (3.502 g/100 g fat), 18:2 (3.252 g/100 g fat), n-6 FA (3.571 g/100 g fat) (all P = 0.001), and the sum of unsaturated FA (3.389 g/100 g fat; P = 0.02) (Table 4). The ratio of n-6/n-3 FA was lower in the butter than in the margarine phases (mean: 13.7 vs. 17.9, P < 0.01), but the
dif-FIG. 1. Silver-ion HPLC (Ag+-HPLC) separation of CLA methyl esters of human milk using three columns in series (peak t6,t8 tentatively as-signed according to Ref. 20).
TABLE 2
Population Demographic and Obstetric Dataa
Group 1 (n = 8) Group 2 (n = 8) Mean SD Mean SD Age (yr) 27.8 3.5 29.4 4.8 Parity (n) 1.6 0.5 1.8 0.7 Gravidity (n) 2.1 1.4 2.0 1.3 Gestational age (wk) at delivery 40.6 1.3 40.1 1.4 BMIb(kg/m2) 25.0 2.6 26.5 6.4
Days postpartum at study start 35.3 13.3 33.3 9.3
aValues between the groups do not differ.
bMean of the five body weight values measured on the five sampling days.
ference was only minimal if we consider a ratio of 1 vs. 50 in the corresponding study products (see Table 1).
The butter phases showed highly significant pooled-group differences (g/100 g fat; all P < 0.001) vs. margarine in the fol-lowing individual FA (Table 4): increases in C15(0.116 g), C16 (1.507 g), C17(0.072 g), C18(0.960 g), and t9,c12 + t11,c15 18:2 (0.043 g); decreases in c9,c12 18:2 (3.632 g), c,c20:2n-6 (0.056 g), and 20:3n-6 (0.062 g) FA.
CLA isomers. (i) At baseline. The overall baseline concen-tration (D1, after normal nonstandardized diet, n = 14) showed a predominance of the c9,t11 (277 ± 195 mg/100 g fat, range 77–800), t9,t11 (13 ± 7 mg/100 g fat, range 4–31), and t11,c13 (12 ± 10 mg/100 g fat, range 2–37) 18:2 isomers, and a total CLA concentration of 352 ± 229 mg/100 g fat (range 103–956).
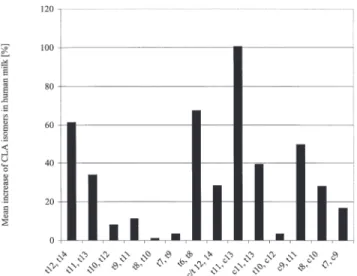
(ii) During the study. Analysis of the mean pooled study day values (D5 + D10 and D15 + D20, respectively), showed sig-nificant increases in t12,t14, t11,t13, t6,t8, c11,t13, t11,c13, c9,t11, and t8,c10 18:2 as well as in the sum of CLA isomers during Alpine butter intake of both groups (Table 4). There were no significant period effects. Pooled-group increases of the individual isomers, expressed per 100 g fat, are shown in Figure 2. The sum of CLA isomers increased by 129.4 mg (45.0%, P = 0.005) and the ratio of t11,c13 and t7,c9 18:2 iso-mers by 70.8% (P < 0.0001).
DISCUSSION
This study demonstrated that 10-d supplementation with Alpine butter, a natural CLA-rich product, affects the FA and CLA isomer content of human milk.
Butter significantly increased the concentrations of saturated FA. At study start (after a normal nonstandardized diet), 18 c9,t11 18:2 and total CLA concentrations in human milk were 277 ± 195 (range 7–800) and 352 ± 229 (range 103–956) mg/100 g fat, respectively. The isomers showing the highest increases in milk were t11,c13 (100.5%), t6,t8 (67.3 %), t12,t14 (61.3%), c9,t11 (49.7%), c11,t13 (39.6%), t11,t13 (34.0%), and t8,c10 (28.2%) (all P < 0.05).
Ethical limitations in standardization and compliance, which was not 100% in our study (Table 3), make human data inevitably more variable than their dairy counterparts. The women were allowed to consume their total supplement per 24 h in as many portions as they wished, and we could not control for the well-known differences in absorption relating to the amount of fat per portion (23). However, our study has certain advantages compared with others with human milk (9,10). The cross-over design excluded interindividual differences and dif-ferences due to lactation duration; all subjects consumed the same supplements with defined fat content and FA composi-tion; milk sampling was standardized (volume, time of day) to minimize the effect of differential fat absorption (23) and milk volume (24); dietary intake of other dairy and beef products was recorded daily throughout the study; BMI was calculated throughout; milk analysis was longitudinal, with two time points per period. Since no significant differences were found in compliance, BMI, dietary (nonsupplement) CLA intake, or total milk fat content between periods or groups, these factors can be excluded as accounting for the differential milk content of FA or CLA isomers in response to butter supplementation.
Our basal value in human milk for the predominant isomer (c9,t11 18:2) (0.25 g/100 g fat) is similar to those reported by Jensen et al. (0.19 and 0.18 g/100 g fat) (25,26), Park et al. (0.21 g/100 g fat) (10), and Ritzenthaler et al. (0.28 g/100 g total FA) (12) in lactating American mothers during the low-dairy periods (10,25,26) or in baseline (12). However, McGuire et al. (27) and Innis and King (28) recorded higher basal val-ues (0.4 g/100 g fat) in American mothers, matching those in German mothers (0.39 and 0.40 g/100 g fat) (29).
The increase in the predominant c9,t11 isomer in our study by 109.8 mg/100 g fat (49.7%) approximates that reported by Park et al. (10) (64.6%) from the low to the high CLA dairy period of their study and is higher than that reported by Ritzen-thaler et al. (12) (29.0%) from baseline to 4 wk of consump-tion of high-CLA cheese. Unlike us, earlier investigators into human milk CLA content could identify, in addition to the pre-dominant c9,t11 18:2 isomer, only t9,t11 (29), t10,c12 (12,27,29), t7,c9 (30), and t9,t11/t10,t12 18:2 (12). In milk
Group 1 (n = 8) Group 2 (n = 8)
M AB AB M Pa
Mean SD Mean SD Mean SD Mean SD Effectb Periodc
Study product intake
Amount (g/d) 29.75 10.91 22.00 7.67 23.75 6.81 30.25 8.05 0.003 NS Fatd(g/d) 17.85 6.55 18.88 6.58 20.38 5.85 18.15 4.83 NS NS
CLAe(mg/d) <2 379.4 132.3 409.6 117.6 <2 <0.001 NS
Dietary intake
CLAf(mg/d) 81.1 79.7 64.9 52.3 109.7 104.2 70.9 63.4 NS NS
aUnpaired two-tailed t-test for cross-over design: NS, nonsignificant. bEffect: overall (both groups) AB (Alpine Butter) vs. M (Margarine). cPeriod: AB vs. M of group 1 vs. group 2.
dCalculated from 85.8 g fat/100 g (AB) and 60 g fat/100 g (M). eC18:2 t7,c9 + t8,c10 + c9,t11 and C18:2 c9, c11 + t9,t11 + t11,c13.
from German women, c9,t11 18:2 accounted for no more than 0.39%, t9,t11 18:2 at most 0.04%, and t10,c12 18:2 at most 0.08% of total FA (29). For Yurawecz et al. (30), the t7,c9 18:2 isomer accounted for 5.5–9.9% of total CLA. In our study, the c9,t11, t9,t11, t7,c9, and t10,c12 isomers accounted for 0.380, 0.019, 0.018, and 0.002% of total FA and for 79, 3.9, 3.6, and 0.3% of total CLA; these values are consistent with those indi-cated above.
The distribution of other FA in milk during the study peri-ods reflects some but not all of the differences between supple-ments (Table 1). The 18:1 trans FA other than trans10-11,
which occur in low concentrations in both study products, also show low concentrations in human milk during both phases. This aspect could be of interest because in recent years atten-tion has been given to the potential impairment of EFA metab-olism to their long-chain metabolites by the trans-isomers in humans (31). It is therefore unlikely that the small amounts found in human milk in our study have any important negative effect on the newborn. The higher amounts of C15, C16, C17, and C18acids and the trans unsaturated octadecadienoic acids (t9,c12 + t11,c15 18:2) are likely to have resulted from their higher content in Alpine butter. C15and C17acids are
synthe-TABLE 4
FA and CLA Isomers in Human Milk (per 100 g human milk fat) During Maternal Supplementation with Margarine and Alpine Butter (pooled study days)
Group 1 (n = 8) Group 2 (n = 8b)
M AB AB M Pc
FAa Unit Mean SD Mean SD Mean SD Mean SD Effectd Periode
14:0 g 5.13 0.73 5.66 1.06 5.99 1.38 5.67 1.18 NS NS 15:0 g 0.31 0.05 0.42 0.07 0.49 0.13 0.37 0.13 <0.001 NS 16:0 g 20.28 1.96 20.62 2.14 22.22 2.87 19.55 3.45 <0.001 <0.05 17:0 g 0.29 0.04 0.36 0.06 0.39 0.08 0.32 0.09 <0.001 NS 18:0 g 6.04 1.05 6.83 1.16 7.38 1.04 6.25 1.05 <0.001 NS 18:1 c9 g 26.38 3.19 26.16 3.75 26.91 3.54 27.02 3.50 NS NS 18:1 t9 g 0.30 0.11 0.28 0.14 0.27 0.07 0.27 0.12 NS NS 18:2 c9,c12 g 14.64 3.60 12.41 6.06 7.96 2.72 13.00 2.99 <0.001 NS 18:2 t12,t14 mg 1.46 0.62 2.90 1.56 2.77 1.90 2.06 0.92 0.007 NS 18:2 t11,t13 mg 4.18 1.57 6.83 2.24 6.43 4.07 5.72 1.90 0.03 NS 18:2 t10,t12 mg 2.49 0.99 3.71 1.63 2.40 0.78 3.17 0.34 NS NS 18:2 t9,t11 mg 14.8 12.9 19.4 14.8 13.4 11.8 14.6 11.7 NS NS 18:2 t8,t10 mg 3.21 0.61 3.21 1.27 2.96 1.50 2.88 0.72 NS NS 18:2 t7,t9 mg 4.01 1.25 4.35 1.16 4.40 1.35 4.45 0.92 NS NS 18:2 t6,t8 mg 0.46 0.16 0.90 0.34 0.83 0.23 0.58 0.22 0.002 NS 18:2 ct/tc12,14 mg 0.86 0.50 1.22 0.56 1.15 0.64 0.98 0.35 NS NS 18:2 t11,c13 mg 6.2 3.1 15.6 6.1 17.1 10.9 10.1 5.0 0.001 NS 18:2 c11,t13 mg 3.26 1.19 5.14 2.16 5.99 3.13 4.71 1.69 0.02 NS 18:2 t10,c12 mg 1.31 1.07 1.94 1.58 0.90 0.27 1.44 0.59 NS NS 18:2 c9,t11 mg 176.0 75.6 309.5 120.7 351.6 212.0 265.6 114.7 0.005 NS 18:2 t8,c10 mg 6.6 1.8 9.6 3.8 10.7 5.4 9.2 2.5 0.04 NS 18:2 t7,c9 mg 10.4 4.0 13.7 6.0 16.0 7.1 14.9 4.3 NS NS ΣCLA mg 235.2 87.0 397.9 141.7 436.6 248.6 340.5 126.8 0.005 NS 18:3 c9,c12,c15 g 0.44 0.21 0.41 0.08 0.38 0.16 0.50 0.19 NS NS 20:3n-6 g 0.31 0.09 0.26 0.09 0.21 0.12 0.29 0.11 <0.001 NS 20:4n-6 g 0.32 0.12 0.29 0.12 0.19 0.09 0.26 0.06 <0.01 NS Saturated FAf g 37.27 1.84 40.64 4.13 38.77 3.96 38.03 3.84 <0.05 NS Monounsaturated FAg g 30.11 4.17 31.57 5.01 30.17 6.49 31.36 4.17 NS NS PUFAh g 16.28 4.17 14.77 6.30 9.35 3.64 14.84 3.43 <0.001 <0.05 18:1 transi g 1.31 0.21 1.85 0.49 1.72 0.56 1.40 0.52 <0.001 NS Σ18:2 g 14.69 3.69 13.30 6.10 8.19 3.20 13.30 3.14 <0.001 <0.05
transFA with CLAj g 2.04 0.32 2.91 0.67 2.62 0.93 2.26 0.73 <0.001 NS
n-6k/n-3l 19.8 5.21 15.38 6.64 11.95 3.33 15.98 3.52 <0.01 NS
aCLA isomers and CLA were analyzed by silver-ion HPLC and are ordered according to their retention time. bn= 6 for CLA isomers.
cUnpaired two-tailed t-test for cross-over design: NS, nonsignificant. dEffect: overall (both groups) AB (Alpine Butter) vs. M (Margarine). ePeriod: AB vs. M of group 1 vs. group 2.
.fFor footnote f see Table 1, footnote c. gFor footnote g see Table 1, footnote d. hFor footnote h see Table 1, footnote e. iFor footnote i see Table 1, footnote f. jFor footnote j see Table 1, footnote j. kFor footnote k see Table 1, footnote l. lFor footnote l see Table 1, footnote k.
sized by ruminant flora but not in humans owing to the uneven number of carbon atoms (32). They thus act as markers of a dairy fat diet (33,34). The highly significant decrease (3.63 g/100 g milk fat = 26.3%) in octadecadienoic acid (c9,c12 18:2) on butter vs. margarine is also probably due to its much lower content in butter than in margarine (1.53 g vs. 46.70 g/100 g fat). The n-6 FA that occur at high concentrations in margarine have an extremely low transfer into human milk.
Mothers can rapidly and easy modulate the fat composition of their milk by consuming Alpine butter (or related natural dairy products). This could have positive implications for the newborn. Several studies, most of them in animals, have indi-cated the potential impact of CLA-rich milk on the develop-ment of the newborn. One point could be the potential effect on body weight. In rats, the c9,t11 18:2 isomer increases body weight (14,35), whereas the t10,c12 18:2 isomer decreases it in both mice (35,36) and humans [loss of body fat in diabetics (37)]. Another point could be the protection of CLA-rich milk against development of atopy. In rats and mice, oral supple-mentation with 100 mg/kg CLA (isomer profile unknown) re-duces allergic anaphylaxis (by decreasing blood pressure), va-sodilatation, and scratching behavior in response to egg-white lysozyme (38). However, further studies in humans are neces-sary to confirm these effects and to show whether human milk with a special pattern of FA and CLA could be a functional food for newborns.
ACKNOWLEDGMENT
The authors would like to very sincerely thank the women and in-fants who participated in this study.
REFERENCES
1. Chin, S.F., Liu, W., Storkson, J.M., Ha, Y.L., and Pariza, M.W. (1992) Dietary Sources of Conjugated Dienoic Isomers of Linoleic Acid, a Newly Recognized Class of Anticarcinogens, J. Food Comp. Anal. 5, 185–197.
2. Kramer, J.K.G., Parodi, P.W., Jensen, R.G., Mossoba, M.M.,
3. Kepler, C.R., Hirons, K.P., McNeill, J.J., and Tove, S.B. (1966) Intermediates and Products of the Biohydrogenation of Linoleic Acid by Butyrivibrio fibrisolvens, J. Biol. Chem. 241, 1350–1354.
4. Griinari, J.M., Corl, B.A., Lacy, S.H., Chouinard, P.Y., Nurmela, K.V.V., and Bauman, D.E. (2000) Conjugated Linoleic Acid Is Synthesized Endogenously in Lactating Dairy Cows by ∆9-Desaturase, J. Nutr. 130, 2285–2291.
5. Lawless, F., Stanton, C., L’Escop, P., Devery, R., Dillon, P., and Murphy, J.J. (1999) Influence of Breed on Bovine Milk c9, t11-Conjugated Linoleic Acid Content, Livestock Prod. Sci. 62, 43–49.
6. Lawless, F., Murphy, J.J., Harrington, D., Devery, R., and Stan-ton, C. (1998) Elevation of Conjugated cis-9, trans-11-Octadec-adienoic Acid in Bovine Milk Because of Dietary Supplementa-tion, J. Dairy Sci. 81, 3259–3267.
7. Collomb, M., Bütikofer, U., Sieber, R., Jeangros, B., and Bos-set, J.O. (2002) Composition of Fatty Acids in Cow’s Milk Fat Produced in the Lowlands, Mountains and Highlands of Switzerland Using High-Resolution Gas Chromatography, Int. Dairy J. 12, 649–659.
8. Precht, D., and Molkentin, J. (1999) C18:1, C18:2 and C18:3 trans and cis Fatty Acid Isomers Including Conjugated cis ∆9,trans ∆11 Linoleic Acid (CLA) as Well as Total Fat Compo-sition of German Human Milk Lipids, Nahrung 43, 233–244. 9. Fogerty, A.C., Ford, G.L., and Svoronos, D. (1988)
Octadeca-9,11-dienoic Acid in Foodstuffs and in the Lipids of Human Blood and Breast Milk, Nutr. Rep. Int. 38, 937–944.
10. Park, Y., McGuire, M.K., Behr, R., McGuire, M.A., Evans, M.A., and Shultz, T.D. (1999) High-Fat Dairy Product Con-sumption Increases ∆9c,11t-18:2 (rumenic acid) and Total Lipid Concentrations of Human Milk, Lipids 34, 543–549.
11. Rist, L., Zweidler, R., and von Mandach, U. (2003) Biologische Ernährung und Gesundheit [Biological Diet and Health (Ger-man)], in Ökologischer Landbau der Zukunft [Prospects in Or-ganic Farming (German)] (Freyer, B., ed.), pp. 237–240, Uni-versität für Bodenkultur, Institut für Ökologischen Landbau/In-stitute for Organic Farming, Vienna,.
12. Ritzenthaler, K.L., McGuire, M.K., McGuire, M.A., Shultz, T.D., Koepp, A.E., Luedecke, L.O., Hanson, T.W., Dasgupta, N., and Chew, B.P. (2005) Consumption of Conjugated Linoleic Acid (CLA) from CLA-Enriched Cheese Does Not Alter Milk Fat or Immunity in Lactating Women, J. Nutr. 135, 422–430. 13. Francois, C.A., Connor, S.L., Wander, R.C., and Connor, W.E.
(1998) Acute Effects of Dietary Fatty Acids on the Fatty Acids of Human Milk, Am. J. Clin. Nutr. 67, 301–308.
14. Chin, S.F., Storkson, J.M., Liu, W., Albright, K.J., and Pariza, M.W. (1994) Conjugated Linoleic Acid (9,11- and 10,12-octa-decadienoic acid) Is Produced in Conventional but Not Germ-Free Rats Fed Linoleic Acid, J. Nutr. 124, 694–701.
15. Erhardt, J., and Bosch, R. (1995) Programm und Handbuch zur Ernährungsanamnese: EBIS; Ernährungsanamnese, Beratungs-und Informationssystem auf der GrBeratungs-undlage des BBeratungs-undeslebens- Bundeslebens-mittelschlüssels (BLS) [Dietary history programme and hand-book: EBIS (Dietary History—Counselling and Information System Based on the German Food Code [BLS]). Stuttgart Hos-pital and University of Hohenheim.
16. Fritsche. J., and Steinhart, H. (1998) Amounts of Conjugated Linoleic Acid in German Foods and Evaluation of Daily Intake, Z. Lebensm. Unters. Forsch. 201, 77–82.
17. Fritsche, J., and Steinhart, H. (1998) Analysis, Occurrence and Physiological Properties of trans Fatty Acids with Particular Emphasis on Conjugated Linoleic Acid Isomers, Fett/Lipid 100, 190–210.
FIG. 2. Mean increase (%) of CLA isomers in human milk during pooled
18. Collomb, M., Sieber, R., and Bütikofer, U. (2004) CLA Isomers in Milk Fat from Cows Fed Diets with High Levels of Unsatu-rated Fatty Acids, Lipids 39, 355–364.
19. Collomb, M., and Bühler, T. (2000) Analyse de la Composition en Acides Gras de la Graisse de Lait. I. Optimisation et Valida-tion d’une Méthode Générale à Haute RésoluValida-tion [Analysis of the Fatty Acid Composition of Milk Fat, I. Optimization and Validation of a General High Resolution Method (French)], Trav. chim. aliment. hyg. 91, 306–332.
20. Rickert, R., Steinhart, H., Fritsche, J., Sehat, N., Yurawecz, M.P., Mossoba, M.M., Roach, J.A.G., Eulitz, K., Ku,Y., and Kramer, J.K.G. (1999) Enhanced Resolution of Conjugated Linoleic Acid Isomers by Tandem-Column Silver-Ion High Per-formance Liquid Chromatography, J. High Resolut. Chro-matogr. 22, 144–148.
21. Kraft, J., Collomb, M., Möckel, P., Sieber, R., and Jahreis, G. (2003) Differences in CLA Isomer Distribution of Cow’s Milk Lipids, Lipids 38, 657–664.
22. Eulitz, K., Yurawecz, M.P., Sehat, N., Fritsche, J., Roach, J.A.G., Mossoba, M.M., Kramer, J.K.G., Adlof, R.O., and Ku, Y. (1999) Preparation, Separation, and Confirmation of the Eight Geometrical cis/trans Conjugated Linoleic Acid Isomers 8,10- through 11,13-18:2, Lipids 34, 873–877.
23. Ramirez, M., Amate, L., and Gil, A. (2001) Absorption and Dis-tribution of Dietary Fatty Acids from Different Sources, Early Hum. Dev. 65, S95–S101.
24. Mitoulas, R.L., Gurrin, L.C., Doherty, D.A., Sheriff, J.L., and Hartmann, P.E. (2003) Infant Intake of Fatty Acids from Human Milk over the First Year of Lactation, Br. J. Nutr. 90, 979–986. 25. Jensen, R.G., Lammi-Keefe, C.J., Hill, D.W., Kind, A.J., and
Henderson, R. (1998) The Anticarcinogenic Conjugated Fatty Acid, 9c, 11t-18:2, in Human Milk: Confirmation of Its Pres-ence, J. Hum. Lact. 14, 23–27.
26. Jensen, R.G., and Lammi-Keefe, C. (2001) The Anticarcino-genic Conjugated Fatty Acid c9, t11-c18:2, or Rumenic Acid, in Human Milk: Amounts and Effects, Adv. Exp. Med. Biol. 501, 153–156.
27. McGuire, M.K., Park, Y., Behre, R.A., Harrison, L.Y., Shultz, T.D., and McGuire, M.A. (1997) Conjugated Linoleic Acid Concentrations of Human Milk and Infant Formula, Nutr. Res. 17, 1277–1283.
28. Innis, S.M., and King, D.J. (1999) Trans Fatty Acids in Human Milk Are Inversely Associated with Concentrations of Essential
all-cis n-6 and n-3 Fatty Acids and Determine trans, but not n-6 and n-3, Fatty Acids in Plasma Lipids of Breast-Fed Infants, Am. J. Clin. Nutr. 70, 383–390.
29. Jahreis, G., Fritsche, J., Möckel, P., Schone, F., Möller, U., and Steinhart, H. (1999) The Potential Anticarcinogenic Conjugated Linoleic Acid, cis-9,trans-11 C18:2, in Milk of Different Species: Cow, Goat, Ewe, Sow, Mare, Woman, Nutr. Res. 19, 1541–1549.
30. Yurawecz, M.P., Roach, J.A.G., Sehat, N., Mossoba, M.M., Kramer, J.K.G., Fritsche, J., Steinhart, H., and Ku, Y. (1998) A New Conjugated Linoleic Acid Isomer, 7 trans, 9 cis-Octadeca-dienoic Acid, in Cow Milk, Cheese, Beef and Human Milk and Adipose Tissue, Lipids 33, 803–809.
31. Mojska, H. (2003) Influence of trans Fatty Acids on Infant and Fetus Development, Acta Microbiol. Pol. 52, (Suppl.), 67–74. 32. Wu, Z., and Palmquist, D.L. (1991) Synthesis and
Biohydro-genation of Fatty-Acids by Ruminal Microorganisms in vitro, J. Dairy Sci. 74, 3035–3046.
33. Smedman, A.E.M., Gustafsson, I.B., Berglund, G.T., and Vessby, B.O.H. (1999) Pentadecanoic Acid in Serum as a Marker for Intake of Milk Fat: Relations Between Intake of Milk Fat and Metabolic Risk Factors, Am. J. Clin. Nutr. 69, 22–29. 34. Wolk, A., Vessby, B., Ljung, H., and Barrefors, P. (1998)
Eval-uation of a Biological Marker of Dairy Fat Intake, Am. J. Clin. Nutr. 68, 291–295.
35. Pariza, M.W., Park, Y., and Cook, M.E. (2001) The Biologically Active Isomers of Conjugated Linoleic Acid, Prog. Lipid Res. 40, 283–298.
36. Loor, J.J., Lin, X.B., and Herbein, J.H. (2003) Effects of Dietary cis 9, trans 11-18:2, trans 10, cis 12-18:2 or Vaccenic Acid (trans 11-18:1) During Lactation on Body Composition, Tissue Fatty Acid Profiles, and Litter Growth in Mice, Br. J. Nutr. 90, 1039–1048.
37. Belury, M.A., Mahon, A., and Banni, S. (2003) The Conjugated Linoleic Acid (CLA) Isomer, t10c12-CLA, Is Inversely Associ-ated with Changes in Body Weight and Serum Leptin in Sub-jects with Type 2 Diabetes Mellitus, J. Nutr. 133, 257S–260S. 38. Ishiguro, K., Oku, H., Suitani, A., and Yamamoto, Y. (2002)
Ef-fects of Conjugated Linoleic Acid on Anaphylaxis and Allergic Pruritus, Biol. Pharm. Bull. 25, 1655–1657.