Methane-suppressing effect of myristic acid in sheep as affected
by dietary calcium and forage proportion
Andrea Machmu¨ller*, Carla R. Soliva and Michael Kreuzer
Institute of Animal Science, Animal Nutrition, Swiss Federal Institute of Technology Zurich, ETH Zentrum/LFW, CH-8092 Zurich, Switzerland
(Received 16 August 2002 – Revised 9 April 2003 – Accepted 13 May 2003)
The efficiency of myristic acid (14 : 0) as a feed additive to suppress CH4emissions of ruminants was evaluated under different dietary conditions. Six sheep were subjected to a 6 £ 6 Latin square arrangement. A supplement of non-esterified 14 : 0 (50 g/kg DM) was added to two basal diets differing in their forage:concentrate values (1 : 1·5 and 1 : 0·5), which were adjusted to dietary Ca contents of 4·2 and 9·0 g/ kg DM, respectively. Comparisons were made with the unsupplemented basal diets (4·2 g Ca/kg DM). The 14 : 0 supplementation decreased (P, 0·001) total tract CH4release depending on basal diet type (interaction, P, 0·001) and dietary Ca level (P, 0·05, post hoc test). In the concentrate-based diet, 14 : 0 suppressed CH4emission by 58 and 47 % with 4·2 and 9·0 g Ca/kg DM, respectively. The 14 : 0 effect was lower (22 %) in the forage-based diet and became insignificant with additional Ca. Myristic acid inhibited (P, 0·05) rumen archaea without significantly altering proportions of individual methanogen orders. Ciliate protozoa concentration was decreased (P, 0·05, post hoc test) by 14 : 0 only in combination with 9·0 g Ca/kg DM. Rumen fluid NH3concentration and acetate:pro-pionate were decreased (P, 0·05) and water consumption was lower (P, 0·01) with 14 : 0. The use of 14 : 0 had no clear effects on total tract organic matter and fibre digestion; this further illustrates that the suppressed methanogenesis resulted from direct effects against methanogens. The present study demonstrated that 14 : 0 is a potent CH4inhibitor but, to be effective in CH4mitigation feeding strategies, interactions with other diet ingredients have to be considered.
Methane: Myristic acid: Forage: Calcium
CH4is currently recognised as the second most important
greenhouse gas emitted from anthropogenic sources (Wuebbles & Hayhoe, 2002). With the Kyoto protocol,
there is a renewed interest to address mitigation of CH4
in animal agriculture. Annually worldwide, approximately
81 Tg CH4are emitted from the gastrointestinal tracts of
domestic ruminants and an additional 7 Tg CH4originate
annually from the manure of these animals (Johnson et al.
2000). Related to total anthropogenic CH4emissions, this
means that domestic ruminants are responsible for 25 %
of total anthropogenic CH4emission (Khalil, 2000).
Concerning the CH4 produced within the rumen, one
possible mitigation strategy is the use of dietary fats (Moss et al. 2000). It is known that medium-chain fatty acids (MCFA) have the potential to suppress rumen metha-nogenesis (Blaxter & Czerkawski, 1966) and methanogens (Henderson, 1973). Ruminant diets containing coconut oil, a fat rich in the MCFA lauric acid (12 : 0) and myristic acid
(14 : 0), decreased daily CH4emissions in vitro (up to 88 %
suppression; Dong et al. 1997) and in vivo (up to 73 % sup-pression; Machmu¨ller & Kreuzer, 1999); in vivo, coconut oil had no major adverse effects on nutrient digestion
and utilisation of dietary energy or protein. However, as
in vitro evaluations show, the extent of the CH4
-suppres-sing effect of MCFA seems to depend on the kind of diet used. Coconut oil had a lower efficacy in suppressing
CH4when the fibrous proportion of the diet was increased
(Machmu¨ller et al. 2001). Additionally, the CH4
-suppres-sing effect of non-esterified MCFA was lower when Ca was added to the diet (Machmu¨ller et al. 2002). Comparing the effects of various non-esterified MCFA (8 : 0, 10 : 0, 12 : 0, 14 : 0) in vitro, 12 : 0 and 14 : 0 were identified to be most effective against rumen methanogens and metha-nogenesis (Dohme et al. 2001a).
Based on these in vitro observations, the objective of the present study was to evaluate in vivo the effects of the
sup-plementation of a non-esterified MCFA on total tract CH4
emissions and digestion at varying dietary proportions of forage and Ca. Non-esterified MCFA 14 : 0 was chosen since 12 : 0 could result in a depression of feed intake (Blaxter & Czerkawski, 1966; Dohme et al. 2001b). The present investigation contributes knowledge useful in
developing effective feeding strategies to mitigate CH4
emissions from domestic ruminants.
* Corresponding author: Dr Andrea Machmu¨ller, fax þ 41 1 632 1128, email andrea.machmueller@alumni.ethz.ch
Abbreviations: ADF, acid-detergent fibre; MCFA, medium-chain fatty acids; NDF, neutral-detergent fibre; OM, organic matter; Td, dissociation temperature; VFA, volatile fatty acids.
Materials and methods
Animals and experimental design
Castrated male sheep of the Swiss White Hill breed (n 6),
aged 9 months with a mean live weight of 41·1 (SD2·2) kg
at the start of the experiment, were assigned to six dietary treatments in a 6 £ 6 Latin square arrangement. In six experimental periods, each sheep received a different sequence of diets. Two basal diet types were fed, which differed in forage : concentrate value (1 : 1·5 and 1 : 0·5). The basal diets were calculated to cover 1·3 times mainten-ance requirements (Swiss Federal Research Station of Animal Production, 1999). This meant daily quantities of either 290 g DM of hay and 413 g DM of concentrate (con-centrate-based diet type, Table 1) or 559 g DM of hay and 265 g DM of concentrate (forage-based diet type). The meadow hay was chopped (type SS110; Gruber Maschinen GmbH, Gaspoltshofen, Austria) to an average particle size
of 67 (SD43) mm. The two basal diets were combined with
two levels of pure non-esterified 14 : 0 (0 and 50 g/kg DM) and two levels of dietary Ca (4·2 and 9·0 g/kg DM, the latter only in combination with the 14 : 0-supplemented diets). The purity of the 14 : 0 used was $ 98 % (Edenor C 14 98 – 100; Cognis Deutschland GmbH, Du¨sseldorf, Germany) and the level of supplementation was the same as in the in vitro study of Dohme et al. (2001a). The pro-portion of dietary Ca was chosen to obtain a Ca:14 : 0 molar value of either 1 : 2 (4·2 g Ca/kg DM) or 1 : 1 (9·0 g Ca/kg DM). To increase the dietary Ca level, cal-cium carbonate was used. The dietary Ca content of 4·2 g/kg DM was within the range recommended for
sheep (2·4 to 3·0 g Ca/d; Agricultural Research Council, 1980; Swiss Federal Research Station of Animal Pro-duction, 1999). With the increased dietary Ca content of 9·0 g/kg DM, the Ca : P was 2·4 : 1 on average. The diets were offered in two equal portions at 08.00 and 16.00 hours. In each experimental period, the sheep were adapted to the respective experimental diet for 14 d, and then sub-jected to 8 d of complete and separate collection of faeces
and urine, and 2 d of quantitative measurement of CH4
emission in respiratory chambers. Animals were housed individually in pens (1·3 m £ 1·9 m) fitted with automatic drinking bowls except in the 10 d measurement periods,
when they were kept in metabolism cages
(0·6 m £ 1·1 m). In the cages, water troughs were filled twice daily with 5 litres fresh tap water. In the barn there was daylight and additional artificial light from 08.00 until 18.00 hours. At the end of the experiment, the
mean live weight of the sheep was 49·1 (SD 1·9) kg. The
experiment was carried out in accordance with Swiss guidelines for animal welfare.
Sampling procedures and measurements
The sheep were weighed before the morning feeding at the beginning of each collection period and after each respirat-ory measurement. Feed intake was recorded daily and refusals were removed before the next respective feeding time. Daily water consumption was measured when the animals were in the metabolism cages. Samples of hay and concentrates were collected during each experimental period. For subsequent chemical analysis, feed refusals
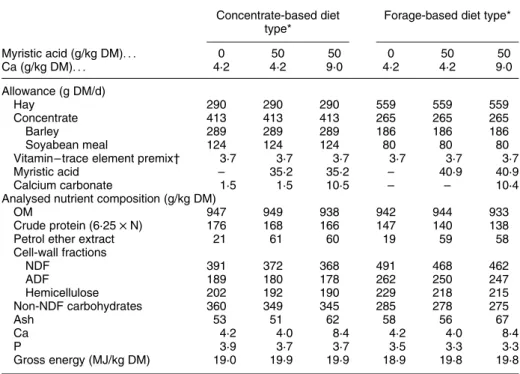
Table 1. Allowance and composition of the experimental diets Concentrate-based diet
type*
Forage-based diet type*
Myristic acid (g/kg DM). . . 0 50 50 0 50 50 Ca (g/kg DM). . . 4·2 4·2 9·0 4·2 4·2 9·0 Allowance (g DM/d) Hay 290 290 290 559 559 559 Concentrate 413 413 413 265 265 265 Barley 289 289 289 186 186 186 Soyabean meal 124 124 124 80 80 80
Vitamin – trace element premix† 3·7 3·7 3·7 3·7 3·7 3·7
Myristic acid – 35·2 35·2 – 40·9 40·9
Calcium carbonate 1·5 1·5 10·5 – – 10·4
Analysed nutrient composition (g/kg DM)
OM 947 949 938 942 944 933
Crude protein (6·25 £ N) 176 168 166 147 140 138
Petrol ether extract 21 61 60 19 59 58
Cell-wall fractions NDF 391 372 368 491 468 462 ADF 189 180 178 262 250 247 Hemicellulose 202 192 190 229 218 215 Non-NDF carbohydrates 360 349 345 285 278 275 Ash 53 51 62 58 56 67 Ca 4·2 4·0 8·4 4·2 4·0 8·4 P 3·9 3·7 3·7 3·5 3·3 3·3 Gross energy (MJ/kg DM) 19·0 19·9 19·9 18·9 19·8 19·8
OM, organic matter; NDF, neutral-detergent fibre; ADF, acid-detergent fibre.
* The diet types differed in forage:concentrate. Value 1:1·5 for the concentrate-based diet type and 1:0·5 for the forage-based diet type.
† Contained (per kg) Na 100 g; Cu 1·5 g; Se 15 mg; lysine 5 g; vitamin A 600 mg; vitamin D35 mg; vitamin E
and samples of all dietary components were milled through a 0·75 mm screen. Complete faeces and urine were col-lected separately in the 8 d periods twice daily and stored at 2 208C immediately after collection. In the metabolism
cages, urine was acidified by 3M-H2SO4 to avoid
N losses. At the end of the collection periods, proportionate samples of faeces and urine were taken and stored at 2 208C until chemical analysis. Part of the faeces was lyophilised for 48 h and milled through a 0·75 mm screen. Contents of DM, ash, neutral-detergent fibre (NDF), acid-detergent fibre (ADF) and, subsequent to hydrolysis with 4M-HCl, petrol ether extract in feed and lyophilised faeces were determined according to standard methods (Naumann & Bassler, 1997). For DM and ash, an automatic analyser was used (Thermogravimetric determinator, TGA-500; Leco Corporation, St Joseph, MI, USA). Values of NDF and ADF were corrected for ash content, and a-amylase was used for NDF determination as recommended by Van Soest et al. (1991). The DM content of the urine was esti-mated from the urine density ðDM ðkg=lÞ ¼ ðdensity 2 1Þ £ 2·6Þ as suggested by Hinsberg (1953). N content was measured in feed, non-lyophilised faeces and acidified urine with an automatic C/N analyser (type FP-2000; Leco Instrumente GmbH, Kirchheim, Germany) by the Dumas method. Ca and P contents were determined photometrically according to standard methods (Naumann & Bassler, 1997) using an autoanalyser (Skalar SANplus; Skalar, Breda, The Netherlands). Gross energy content of feed and lyophilised faeces was assessed by an adiabatic combustion calorimeter (C 7000 Calorimeter; IKA-Werke GmbH & Co. KG, Stau-fen, Germany).
On the last day of each experimental period, rumen fluid samples were taken from each sheep 5 h after the morning feeding, using a flexible stomach tube inserted via the oeso-phagus. Immediately after collection, rumen fluid samples were strained through four layers of compress gauze (aver-age pore size of 1000 mm, type 17; MedPro Novamed AG,
Flawil, Switzerland). Thereafter, rumen fluid pH and NH3
concentration were measured using a pH meter (model 632; Metrohm, Herisau, Switzerland) equipped with the respective electrodes. Ciliate protozoa and bacteria were enumerated microscopically in rumen fluid samples using 0·1 mm and 0·02 mm depth Bu¨rker counting chambers
(Blau Brandw, Wertheim, Germany), respectively. Holotrich
and entodiniomorphid ciliate protozoa were counted separ-ately. Samples for determination of volatile fatty acids
(VFA) were stabilised with 0·046M mm-HgCl2 solution
(200 ml/1·8 ml rumen fluid) and frozen (2 208C) until analy-sis. Concentrations of VFA were determined by GC using a GC Star 3400 CX (Varian, Sugarland, TX, USA) equipped with a glass column (2 m £ 2 mm, 10 % SP-1200/1 %
H3PO4 on 80/100 Chromosorb W AW, Cat. no. 11965;
Supelco, Bellefonte, PA, USA) at the following conditions:
N2 carrier (30 ml/min); injector temperature 2508C; oven
temperature 1208C; detector temperature 3008C. Rumen fluid osmolality was measured using a freezing point osm-ometer (Multi-Osmette; Precision Systems Inc., Natwick, MA, USA). For the enumeration of methanogens, samples
of rumen fluid were frozen in liquid N2 and stored at
2 708C. The fluorescence in situ hybridisation technique was applied in general as outlined by Stahl et al. (1995).
Cells were fixed with 4 % (w/v) sterile paraformaldehyde – PBS (pH 7·2) for 3 h at 48C. Mild sonication (two times for 30 s) was done to avoid the formation of clusters and to opti-mise homogenisation of the samples (Sandaa et al. 1999). Thereafter, 3 ml of the suspensions were spotted onto gela-tine-coated slides, air-dried and dehydrated sequentially in 50, 80 and 100 % (v/v) ethanol for 3 min each. Oligonucleo-tide probes were purchased from Microsynth (Microsynth GmbH, Balgach, Switzerland) with reactive fluorescent
dye Cy3 at the 50end. The spotted slides were hybridised
in 8 ml hybridisation buffer, containing 0·1 % (w/v) sodium dodecyl sulfate and 25 ng of the respective probe. Forma-mide was used to standardise the hybridisation temperature
at 378C. For 18C decrease of dissociation temperature (Td)
of the oligonucleotide, 2 % (v/v) formamide was added to the hybridisation buffer. After hybridisation, the slides were washed for 20 min at 378C with the hybridisation buffer and mounted with an antifade reagent (Fluoro Guarde; Bio Rad, Hercules, CA, USA). Labelled samples were examined with an epifluorescence microscope (BX-60; Olympus Optical AG, Volketswil, Switzerland) and pictures were recorded by a 3CCD colour video camera. Individual cells were counted using image analysis software (analySIS, version 3.1; Soft Imagine System GmbH, Uster, Switzerland). Two replicates were prepared per sample, and twenty fields of view were counted per replicate. To characterise the methanogens inhabiting the rumen, five oli-gonucleotide probes were used as suggested by Raskin et al. (1994) and Lin et al. (1997): one domain-specific probe targeting total rumen archaea, i.e. all methanogens
(S-D-Arch-0915-a-A-20; Td 568C); four order-specific probes
(S-F-Mbac-0310-a-A-22 (Td578C) for Methanobacteriales,
S-F-Mcoc-1109-a-A-20 (Td 558C) for Methanococcales,
S-O-Mmic-1200-a-A-21 (Td538C) for Methanomicrobiales,
S-O-Msar-0860-a-A-21 (Td608C) for Methanosarcinales).
CH4 release was measured continuously with a dual
chamber as elements of an open-circuit indirect respiration
calorimetry system. The chambers (5·44 m3volume each)
were aluminium – glass constructions, allowing sight
contact between sheep, and were air-conditioned
(ambient temperature 17·4 (SD 0·5)8C, relative humidity
60·8 (SD 11·1) %, air flow 8·2 (SD 0·1) m3/h, atmospheric
pressure 959 (SD 9) hPa). In-line electronic flow meters
(type 8GD-LRM; Fluid Inventor AB, Stockholm, Sweden) continuously recorded the air volume leaving the chambers.
Daily CH4emission data were based on two consecutive
days measuring 22·5 h each. The CH4 detector used
was a Binos 1001 (Fisher-Rosemount, Baar-Walterswil, Switzerland). The detector was calibrated manually before each measurement period. Within each interval of 90 min,
one automatic calibration, four measurements of the CH4
concentrations in the air flowing into the chambers and
twenty-four measurements of the CH4 concentrations in
the outgoing air from each chamber were performed. Calculations and statistical analysis
Crude protein content was calculated as 6·25 £ N content. Hemicellulose was computed by the difference between NDF and ADF (Van Soest et al. 1991). Non-NDF carbohydrates were defined as the organic matter (OM)
not incorporated in crude protein, petrol ether extract and NDF. The apparent total tract digestibility of OM and nutri-ents was calculated from the total dietary intake and the total excretion via faeces during the 8 d collection periods (intake minus excretion in relation to intake). The formula of
Brouwer (1965) was used for calculation of CH4energy loss.
Data were statistically analysed using the general linear model procedure of SAS (version 6.12; SAS Institute Inc., Cary, NC, USA). ANOVA was carried out regarding diet type (n 2), supplementation (n 3), diet type £ sup-plementation, animal (n 6) and experimental period (n 6). The tables give the mean values for the six experimental diets (n 6), the overall mean values for the three supplemen-tation groups (n 12), the standard errors of means and the P values for treatment effects and the interaction. All multiple comparisons among means were performed with Tukey’s studentised range post hoc test considering P# 0·05 to be significant. Pearson’s correlation coefficients were calcu-lated between rumen microbial counts. Fig. 1 gives the
mean diurnal pattern of CH4release for the six
experimen-tal diets (n 6) and, at every 4 h, standard deviations. Results
The different forage:concentrate values of the two basal diets resulted in differences in the analysed contents of
crude protein, cell-wall fractions and non-NDF carbo-hydrates (Table 1). The contents of petrol ether extract and gross energy were increased with 14 : 0 supplemen-tation and, likewise, the addition of calcium carbonate increased the contents of ash and Ca.
Supplementing the basal diets with 14 : 0 decreased (P, 0·001) rumen fluid pH from 7·0 to 6·6 (Table 2).
The NH3concentration in rumen fluid was also decreased
by 14 : 0 supplementation (P, 0·01) but this effect was more pronounced in the concentrate-based diet type (inter-action, P, 0·05). The basal diet type and extra Ca had no
effects on pH and NH3 concentration. In VFA
concen-trations and profile, no significant treatment interaction between diet type and supplementation occurred. Supple-menting 14 : 0 resulted in an increase (P, 0·01) in the con-centrations of acetate, propionate and total VFA. This was not reflected in acetate proportion but in propionate pro-portion (P, 0·01) of total VFA. Acetate : propionate was decreased (P, 0·05, post hoc test) with 14 : 0 supplemen-tation when the dietary Ca level was 4·2 g/kg. Additionally, with 14 : 0 supplementation the proportions of butyrate (P, 0·001) and isovalerate (P, 0·01) were depressed. Compared with the concentrate-based diet, the forage-based diet resulted in decreased (P, 0·01) concentrations of total VFA, acetate, propionate and valerate (P, 0·05). This did not affect the molar VFA proportions. Extra Ca
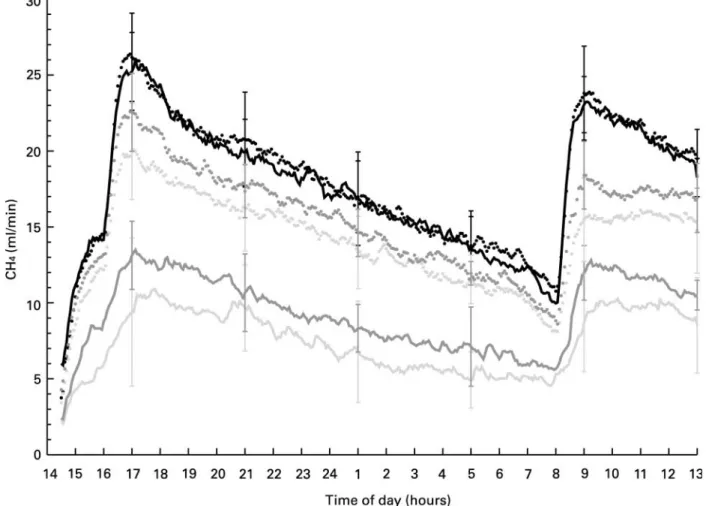
Fig. 1. Diurnal pattern of CH4release from sheep fed either a concentrate- (-, -,-) or a forage- (†, †,-) based diet type combined with either 0 g 14 : 0/kg DM and 4·2 g Ca/kg DM (-, †) or 50 g 14 : 0/kg DM and 4·2 g Ca/kg DM (-,†) or 50 g 14 : 0/kg DM and 9·0 g Ca/kg DM (-,†). The vertical bars indicate standard deviations at selected times.
Ta ble 2. Effect of myr istic acid on rume n fluid pro perties * (M ean valu es and standa rd errors of the means ) C oncentr ate-bas ed diet type Forag e-based diet type Supp lementat ion M yristic acid (g/kg DM) .. . 0 5 0 5 0 0 50 50 0 5 0 5 0 P values C a (g/ kg DM) .. . 4 ·2 4 ·2 9·0 4 ·2 4·2 9 ·0 4 ·2 4 ·2 9·0 n .. . 6 6 6 6 6 6 12 12 12 SE M DS D £ S pH 7·00 a 6·62 ab 6·37 b 7· 0 4 a 6·56 ab 6·70 ab 7·02 A 6·59 B 6·53 B 0·109 0·27 0·0004 0·21 NH 3 (mmol/ l) 10·99 a 5·36 b 4·90 b 7· 8 7 ab 5·85 b 7·12 ab 9·43 A 6·01 B 5·60 B 1·030 0·87 0·0024 0·050 VF A conce ntrat ion (mm ol/l) Ac etate 47·4 ab 60·4 a 61·3 a 41 ·2 b 53 ·1 ab 49 ·6 ab 44·3 B 56 ·7 A 55·5 A 3·20 0·0045 0·0015 0·67 Pro pionate 13·0 bc 25·2 a 23·1 ab 10 ·4 c 18 ·3 abc 15 ·9 abc 11·7 B 21 ·8 A 19·5 A 2·36 0·0093 0·0010 0·56 Buty rate 6·7 5 ·9 6·4 6 ·5 5·1 5 ·7 6·6 5 ·5 6·1 0 ·54 0·21 0·17 0·89 Isob utyrat e 0 ·4 0·1 0 ·2 0 ·4 0 ·2 0·3 0 ·4 0·2 0 ·3 0·12 0·61 0·25 0·77 Val erate 0·9 1 ·0 1·0 0 ·6 0·8 0 ·8 0·7 0 ·9 0·9 0 ·12 0·030 0·30 0·97 Isova lerate 0·7 0 ·4 0·4 0 ·5 0·5 0 ·6 0·6 0 ·5 0·6 0 ·08 0·87 0·20 0·14 To tal VFA 69·0 b 93·0 a 92·4 a 59 ·5 b 78 ·0 ab 73 ·0 ab 64·3 B 85 ·5 A 82·7 A 5·22 0·0026 0·0011 0·64 M olar pro portion (%) Ac etate 68·4 64·9 66·4 68 ·6 68 ·2 68 ·3 68·5 66 ·6 67·4 1·53 0·16 0·45 0·60 Pro pionate 19·0 b 26·9 a 25·0 ab 18 ·1 b 23 ·2 ab 21 ·0 ab 18·5 B 25 ·0 A 23·0 A 1·73 0·054 0·0040 0·62 Buty rate 9·8 ab 6·5 b 6·8 b 10 ·9 a 6·7 b 8·2 ab 10·3 A 6·6 B 7·5 B 0·85 0·21 0·0008 0·75 Isob utyrat e 0 ·6 0·1 0 ·3 0 ·5 0 ·3 0·4 0 ·5 0·2 0 ·3 0·15 0·47 0·10 0·79 Val erate 1·3 1 ·1 1·1 1 ·1 1·1 1 ·2 1·2 1 ·1 1·1 0 ·15 0·79 0·77 0·51 Isova lerate 1·0 a 0·5 b 0·4 b 0· 9 ab 0·6 ab 0·8 ab 0·9 A 0·5 B 0·6 B 0·11 0·15 0·0058 0·073 A: P ratio 3·9 2 ·4 2·8 4 ·0 3·0 3 ·4 3·9 A 2·7 B 3·1 AB 0·37 0·18 0·011 0·65 Os mola lity (mOsm /kg) 252 265 27 3 2 4 2 260 268 247 B 263 AB 271 A 7·2 0 ·27 0·013 0·95 D, diet type; S, supplementation; D £ S, interaction (diet type £ supplementation); VFA, volatile fatty acids; A:P, acetate:propionate. a,b,c Mean values within a row with unlike superscript lower case letters were significantly different (P , 0 ·05). A,B Mean values within a row with unlike s uperscript c apital letters were significantly different (P , 0 ·05). * For details of diets and procedures, s ee Table 1 and p. 531.
Table 3. Effe ct of myri stic acid on microb ial counts in rum en fluid* (M ean valu es and standa rd errors of the means ) Conce ntrate-b ased diet type Forag e-based diet type Supplem entatio n M yristic acid (g/kg DM) .. . 0 5 0 5 0 0 50 50 0 5 0 5 0 P valu es C a (g/ kg DM) .. . 4·2 4 ·2 9·0 4 ·2 4·2 9 ·0 4·2 4 ·2 9·0 n .. . 666666 1 2 1 2 1 2 SE M DS D £ S Ba cteria (£ 10 9/ml) 12·3 11·6 11·6 11·1 10·0 8·5 1 1·7 1 0·8 1 0 ·1 1 ·8 0 0 ·2 0 0 ·6 5 0 ·87 C iliate pro tozo a (£ 10 5 /ml) Ento diniomo rphids 3·51 4·94 1·32 6·93 3·63 2·29 5·22 4·29 1·81 1 ·7 1 0 ·4 7 0 ·1 5 0·40 H olotrich s 2 ·36 0·09 0·00 0·17 0·00 0·04 1·27 0·04 0·02 0 ·9 4 0 ·3 4 0 ·3 3 0·43 To tal cilia te protozo a 5 ·87 5·03 1·32 7·10 3·63 2·33 6·49 A 4·33 AB 1·83 B 1· 8 4 0· 8 5 0· 0 6 1 0 ·7 3 M ethanog ens (£ 10 8/ml) To tal archae a 1 0·55 9·20 10·00 11·67 8·92 9·68 11·11 A 9·06 B 9·84 AB 0 ·6 8 6 0 ·7 6 0 ·0 23 0·50 Met hanob acteria les 2·93 2·22 2·26 3·19 2·51 2·35 3·06 2·37 2·30 0 ·4 1 2 0 ·5 4 0 ·1 5 0 ·97 Met hanoco ccales 3·12 3·48 3·55 4·20 3·97 3·51 3·66 3·73 3·53 0 ·4 5 6 0 ·1 9 0 ·9 1 0 ·48 Met hanomi crobiale s 1 ·68 1·73 1·65 2·18 1·84 1·63 1·93 1·78 1·64 0 ·3 4 2 0 ·5 0 0 ·7 0 0 ·74 Met hanosa rcinales 2·23 1·44 1·47 2·11 1·52 1·10 2·17 1·48 1·29 0 ·4 6 4 0 ·7 2 0 ·1 6 0 ·89 Pro portion of th e diffe rent orders (%) Met hanob acteria les 28·7 25·1 25·8 27·9 25·8 27·7 28·3 25·4 26 ·7 1 ·7 5 0 ·6 6 0 ·2 8 0·75 Met hanoco ccales 31·8 38·8 38·9 39·2 40·3 40·0 35·5 39·5 39 ·5 2 ·8 8 0 ·1 8 0 ·3 0 0·49 Met hanomi crobiale s 1 7·1 1 9·9 1 8·8 1 7·4 1 8·2 1 9·3 1 7·2 1 9·0 1 9 ·0 1 ·7 2 0 ·8 2 0 ·4 9 0 ·79 Met hanosa rcinales 22·4 16·2 16·5 15·5 15·8 13·0 18·9 16·0 14 ·7 2 ·4 6 0 ·0 8 7 0 ·2 4 0 ·44 D, diet type; S, supplementation; D £ S, interaction (diet type £ supplementation). A,B Mean values within a row with unlike superscript c apital letters were significantly different (P , 0 ·05). * For details of diets and procedures, s ee Table 1 and p. 531.
generally had little effect on VFA concentrations and
profiles. The average rumen fluid osmolality was
247 mOsm/kg when feeding the basal diets and increased (P, 0·05, post hoc test) to 271 mOsm/kg with 14 : 0 and Ca addition, parallel to VFA concentration.
Neither basal diet type nor supplementation significantly affected counts of bacteria, entodiniomorphid or holotrich ciliate protozoa (Table 3). On average, concentrations
were 10·9 £ 109/ml, 3·8 £ 105/ml and 0·4 £ 105/ml for
bacteria, entodiniomorphid and holotrich ciliate protozoa, respectively. For total ciliate protozoa concentration, the mean value of the groups supplemented with 14 : 0 and extra dietary Ca was lower (P, 0·05, post hoc test) than that of the unsupplemented groups. Myristic acid sup-plementation decreased (P, 0·05) archaea concentration in rumen fluid but only in combination with 4·2 g Ca/kg DM. The counts of the four individual methanogenic orders were not significantly affected by 14 : 0 supplemen-tation. The basal diet type neither altered counts nor proportion of rumen methanogen orders. On average, the methanogenic population was composed of 27 % Methano-bacteriales, 38 % Methanococcales, 18 % Methanomicro-biales and 17 % Methanosarcinales. The sum of the counts of the four different order-specific probes was
9·6 £ 107(SD3·3) £ 107/ml equivalent to 97 (SD 28) % of
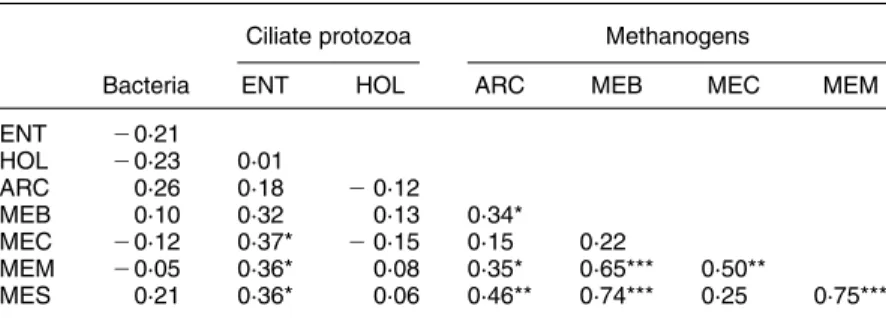
the average counts using the Archaea domain-specific probe, illustrating that the order-specific 16S rRNA oligo-nucleotide probes used were appropriate to characterise the rumen methanogenic population. Counts of Methanococ-cales, Methanomicrobiales and Methanosarcinales were positively correlated (P, 0·05) with counts of entodinio-morphid ciliate protozoa (Table 4). The counts of total rumen archaea were positively correlated with counts
of Methanobacteriales (P, 0·05), Methanomicrobiales
(P, 0·05) and Methanosarcinales (P, 0·01) but not with counts of Methanococcales. Accordingly, a correlation (P, 0·001) was found between counts of Methanobacter-iales, Methanomicrobiales and Methanosarcinales. Counts of Methanococcales only were positively correlated
(P, 0·01) with counts of Methanomicrobiales. No
significant correlation occurred between total counts of bacteria and counts of the other rumen microbes.
Depending on the basal diet, the average DM intake differed among treatment groups (Table 5). Feed refusals
occurred in the case of two animals (2 and 24 % of DM allowance) when fed the concentrate-based diet type supplied with 14 : 0 at 4·2 g Ca/kg DM. The animals ingested 0·09 to 0·10 kg water/d with the feed. The intake of tap water was decreased (P, 0·01) when 14 : 0 was sup-plied, especially in combination with the concentrate-based diet type (interaction, P, 0·05). The effects on water excretion via urine corresponded with the intake of tap water. The daily excreted amount of faecal water was not affected but that of faecal OM was. With the forage-based diet type, more (P, 0·001) OM was excreted with faeces than with the concentrate-based diet type. Indepen-dent of dietary Ca level, 14 : 0 supplementation increased (P, 0·01) OM excretion via faeces. The total tract OM digestibility remained unchanged by the treatments and averaged at 0·69. On average, the digestibilities of non-NDF carbohydrates, non-NDF and ADF were 0·93, 0·49 and 0·27 for the concentrate-based diet and 0·87, 0·59 and 0·52 for the forage-based diet. The 14 : 0 supplementation did not significantly affect digestibility of NDF and ADF, but hemicellulose digestibility was reduced (P, 0·01). The effect on hemicellulose degradation was smaller with the extra Ca supply. The combined supplementation of 14 : 0 and Ca decreased (P, 0·05, post hoc test) the digest-ibility of non-NDF carbohydrates, but only in the concen-trate-based diet type (interaction, P, 0·05).
The two unsupplemented basal diets resulted in a similar
CH4release of about 25 litres/d. Adding 50 g 14 : 0/kg feed
DM to the concentrate-based diet type resulted in a
signifi-cant reduction of daily CH4release by up to 58 %, and this
was not significantly changed by additional dietary Ca. When the same dietary percentage of 14 : 0 was added to
the forage-based diet type, the reduction in CH4 release
was only 22 % and the difference compared with the
unsupplemented diet became insignificant with the
increased dietary Ca level. The diurnal pattern of CH4
release (Fig. 1) showed that CH4 production was always
similar throughout the day with the two unsupplemented basal diets. The supplementation of 14 : 0 decreased both the highest and lowest values measured throughout the day. Concerning the diurnal pattern, extra dietary Ca had similar effects in the concentrate-based and in the
forage-based diet type. Relating the daily CH4 release to
gross energy intake and OM digested (Table 5) further
Table 4. Relationships between rumen microbial counts (n 36) (Pearson’s correlation coefficients)
Ciliate protozoa Methanogens
Bacteria ENT HOL ARC MEB MEC MEM
ENT 20·21 HOL 20·23 0·01 ARC 0·26 0·18 20·12 MEB 0·10 0·32 0·13 0·34* MEC 20·12 0·37* 20·15 0·15 0·22 MEM 20·05 0·36* 0·08 0·35* 0·65*** 0·50** MES 0·21 0·36* 0·06 0·46** 0·74*** 0·25 0·75***
ENT, entodiniomorphid ciliates; HOL, holotrich ciliates; ARC, Total archaea; MEB, Methanobac-teriales; MEC, Methanococcales, MEM, Methanomicrobiales; MES, Methanosarcinales. * P, 0·05; ** P, 0·01; *** P, 0·001.
Ta ble 5. Effect of myr istic acid on intake, excr etion, total tra ct nutrien t digest ibility and methan e emiss ion* (M ean valu es and standa rd errors of the means ) C oncent rate-b ased diet type Fo rage-b ased diet typ e Suppl ementa tion M yristic acid (g/kg DM) .. . 0 5 0 5 0 0 50 50 0 5 0 5 0 P valu es C a (g/ kg DM) .. . 4·2 4 ·2 9·0 4 ·2 4·2 9 ·0 4 ·2 4 ·2 9·0 n .. . 6 6 6 6 6 6 12 12 12 SE M DS D £ S Fe ed DM (kg/ d) Allowa nce 0·707 0·743 0·752 0·828 0 ·8 6 9 0 ·880 0·768 0·806 0·816 Inta ke 0·707 b 0·711 b 0·752 b 0·828 a 0· 8 6 9 a 0·880 a 0·768 B 0·790 AB 0·816 A 0·0117 0·000 1 0 ·0024 0·26 W ater inta ke (kg/d) Ta p wat er 7·78 a 5·80 ab 5·09 b 7·22 ab 5· 5 7 ab 7·16 ab 7·50 A 5·68 B 6·12 B 0·539 0·34 0·0081 0·049 Fe ed 0·09 0·09 0·09 0·10 0 ·1 0 0·10 0·10 0·09 0·10 0·002 0·000 1 0 ·36 0·34 Ex creti on (kg/d) U rine wat er 6·56 a 4·24 b 3·40 b 5·62 ab 3· 8 4 b 5·47 ab 6·09 A 4·04 B 4·43 B 0·518 0·57 0·0018 0·020 Fa ecal water 0·38 0·40 0·41 0·39 0 ·4 6 0·43 0·38 0·43 0·42 0·035 0·33 0·33 0·75 Fa ecal OM 0·19 c 0·21 bc 0·22 bc 0·24 ab 0· 2 7 a 0·27 a 0·21 B 0·24 A 0·24 A 0·007 0·000 1 0 ·0018 0·77 To tal tra ct nutrien t digest ibility OM 0·716 0·690 0·694 0·696 0 ·6 7 5 0 ·675 0·706 0·683 0·685 0·0107 0·056 0·075 0·97 C ell-wall fra ctions ND F 0 ·492 b 0·467 b 0·508 ab 0·593 a 0· 5 2 5 ab 0·530 ab 0·543 0·496 0·519 0·0194 0·001 1 0 ·079 0·15 ADF 0·272 c 0·284 c 0·328 bc 0·520 a 0· 4 3 2 ab 0·433 ab 0·396 0·358 0·381 0·0295 0·000 1 0 ·46 0·066 Hemice llulose 0·697 a 0·639 ab 0·676 ab 0·678 ab 0· 6 2 9 b 0·640 ab 0·688 A 0·634 B 0·658 AB 0·0146 0·081 0·0055 0·68 N on-ND F C H 0 ·929 a 0·894 ab 0·880 b 0·871 b 0· 8 7 7 b 0·867 b 0·900 A 0·886 AB 0·874 B 0·0089 0·000 6 0 ·026 0·037 CH 4 emiss ion Litre s/d 25·1 a 10 ·5 c 13·2 c 25 ·5 a 19 ·8 b 21·8 ab 25 ·3 A 15·2 C 17 ·5 B 0·86 0·000 1 0 ·0001 0·0001 kJ/ MJ GE inta ke 74·0 a 29 ·4 c 35·1 c 64 ·5 a 45 ·6 b 49·4 b 69 ·2 A 37·5 B 42 ·2 B 2·21 0·000 9 0 ·0001 0·0001 g/kg OM digest ed 37·8 a 16 ·1 d 19·4 d 33 ·7 ab 25 ·8 c 28·2 bc 35 ·7 A 21·0 B 23 ·8 B 1·38 0·000 4 0 ·0001 0·0001 D, diet type; S, supplementation; D £ S, interaction (diet type £ supplementation); OM, organic matter; NDF, neutral-detergent fibre; ADF, acid-detergent fibre; CH, carbohydrates; GE, gross energy. a,b,c,d Mean values within a row with unlike s uperscript lower case letters were significantly different (P , 0 ·05). A,B,C Mean values within a row with unlike superscript c apital letters were significantly different (P , 0 ·05). * For details of diets and procedures, s ee Table 1 and p. 530.
documented that the high efficacy of the 14 : 0 supplemen-tation depended on the basal diet type (interaction, P, 0·001). The mean values for the unsupplemented basal diets were not significantly different.
Discussion
Effects of the basal diet type
Feeding strategies for ruminants, which achieve a
signifi-cant CH4 suppression, are limited (Moss et al. 2000).
Methanogenesis is an important terminal step in the anaero-bic fermentation of OM within the rumen. Carbohydrates are the main energy source for the rumen microbes and
the production of CH4is closely related to their
fermenta-tion (Czerkawski, 1969). Compared with structural carbo-hydrates (for example, cellulose), it was observed that the
fermentation of non-structural carbohydrates (starch,
sugars) results in less CH4per unit of substrate fermented
(Hungate, 1966). Thus, increasing the dietary proportion of concentrate, i.e. the proportion of easily fermentable carbohydrates, appears to be an effective feeding strategy in decreasing rumen methanogenesis (for example, Van Nevel & Demeyer, 1996). However, when studying the relationship between diet composition, intake level and
CH4 production, Moe & Tyrrell (1980) revealed that the
nature of the carbohydrates digested (i.e. cellulose, hemicel-lulose or soluble residues) is less important at feed intake levels below 1·5 times maintenance. This is also supported by data of Blaxter & Clapperton, (1965), which showed that at maintenance level, independent of the type of diet, i.e. forage or mixed diets, the percentage of gross energy
converted to CH4increases with increasing digestibility of
the dietary energy. This relationship will be negative only at an intake level exceeding twice the maintenance require-ments. In the present study, the feed was provided at
1·3 times maintenance requirements (Swiss Federal
Research Station of Animal Production, 1999). This
explains why almost equal levels of CH4 were produced
per unit of apparently digested OM with both unsupplemen-ted basal diets although the composition of the OM digesunsupplemen-ted was different.
The effect of feeding level on the expression of diet type
differences in CH4release may be the result of associated
changes in passage rate. Okine et al. (1989) demonstrated
that the overall relationship between CH4 production and
passage rate of ruminal particulate matter is negative and that ruminal passage rate explained at least 28 % of the
variation in CH4 production of steers. Additionally, at a
low feeding level only weak effects of concentrate proportion on rumen fluid pH and VFA profile are expected (Zhao et al. 1993), which was confirmed by the present study. Rumen methanogenesis was shown to be a pH-dependent process (Van Kessel & Russell, 1996).
Overall, this illustrates that the CH4-suppressing effect of
an increased concentrate proportion cannot be regarded as a general phenomenon.
Effects of myristic acid supplementation
In the present experiment, the 14 : 0 supplementation was 50 g/kg DM, resulting in daily supplies of either 35·2 or
40·9 g, depending on the basal diet type. This decreased
daily CH4emission of the animals by 40 % on average. At
the same time 14 : 0 had only small effects on total tract digestibility of OM and fibre. Accordingly, the greatest difference between the treatments with and without 14 : 0
supplementation still remained (2 41 %) when CH4release
was related to the apparently digested feed OM. These effects of 14 : 0 are in line with previous results using 14 : 0 in vitro (Dohme et al. 2001a) or coconut oil in vivo (Machmu¨ller & Kreuzer, 1999). Nevertheless, with 14 : 0 supplementation there might have been a shift of fibre fer-mentation from the rumen to the hindgut as was found by Sutton et al. (1983) in sheep fed coconut oil. Since hindgut fermentation differs from rumen fermentation in producing
substantially lower amounts of CH4 (Immig, 1996), this
would have only marginally counteracted the suppressing effect of 14 : 0 on rumen methanogenesis.
It has been shown that the growth of rumen microbial species of all three domains of life, Archaea, Eucarya and Bacteria, could be directly affected by non-esterified MCFA. In a pure culture study, the growth of Methanobre-vibacter ruminantium was found to be inhibited by adding 10 : 0, 12 : 0 or 14 : 0 at concentrations of 0·05, 0·25 or 0·50 g/l medium (Henderson, 1973). Matsumoto et al. (1991) showed that rumen ciliates are suppressed by MCFA, particularly by 10 : 0 and 12 : 0. In an in vitro screening test some species of Gram-positive bacteria were also inhibited by MCFA, whereas Gram-negative bacteria seemed to be less sensitive (Galbraith et al. 1971). The latter indicates that probably the cell-wall structure of the microbes will determine their sensitivity against the MCFA. Kabara (1978) assumed that fatty acids inhibit microbes by affecting their lipid membranes, thus changing the permeability of the cell membrane. Among the four rumen methanogen orders there are also differences in the Gram staining. Methanobacteriales are Gram positive, Methanosarcinales are Gram variable, and Methanococcales and Methanomicrobiales are Gram nega-tive (Boone et al. 1993).
In the present study, 14 : 0 supplementation significantly decreased the rumen archaeal population but showed rela-tively weak effects on other microbial counts. However, when 14 : 0 was fed, the animals significantly decreased tap water intake by 24 % on average compared with the unsupplemented diet. With decreased water consumption, the expansion of rumen volume following drinking will be small (Warner & Stacy, 1968) and the rumen fluid dilution rate will decrease (Rogers & Davis, 1982). There-fore, in the present study, all concentrations measured in the rumen fluid have to be interpreted carefully since they may not reflect the effects on total production (Rogers & Davis, 1982). This is not only valid for rumen microbial counts but also for the related traits concerning
microbial metabolism, i.e. concentration of NH3 and
VFA. Assuming a lower rumen fluid volume and a lower rumen fluid dilution rate with the 14 : 0 supplementation would mean that: (i) the inhibiting effect of 14 : 0 on archaea and ciliate protozoa was more pronounced;
(ii) the decrease in total NH3 quantity was even larger;
(iii) the increase in VFA production (particularly acetate and propionate) was smaller than apparent.
In contrast, alterations in the correlation coefficients between the rumen microbial counts and in the molar proportions of VFA will not be affected by variations in water intake and rumen fluid volume. In the present study, there was no obvious relationship between counts of holotrich ciliates and methanogens, whereas counts of entodiniomorphid ciliates were positively correlated with
counts of Methanococcales, Methanomicrobiales and
Methanosarcinales. This presumably reflects the symbiotic relationship between rumen methanogens and ciliate proto-zoa (Williams & Coleman, 1997). With the exception of the Methanococcales, all other counts of methanogen orders were significantly correlated to total archaeal counts and intercorrelated. The population of the Methano-coccales might therefore actually be less sensitive to 14 : 0 compared with the other methanogen orders. The Methano-microbiales seem to take an intermediate position as they were the only order showing a correlation with Methano-coccales counts. Concerning the molar proportions of VFA, a lower acetate:propionate value was found with 14 : 0 supplementation. This suggests a decreased capacity
of the archaea to produce CH4as it reflects a shift from the
hydrogen-consuming process of methanogenesis towards propionate production (Whitelaw et al. 1984).
As presumed additional consequences of the decreased water intake with the 14 : 0 supply, the average rumen pH was lower and the actual 14 : 0 concentration in the rumen fluid was higher than would have been the case without suppressed water consumption. These two aspects contributed to the high efficiency of the 14 : 0 supplemen-tation against methanogenesis since they are known to increase the antimicrobial activity of 14 : 0 (Galbraith & Miller, 1973; Henderson, 1973). The reduced pH was also accompanied by an increasing rumen osmolality (respectively osmotic pressure). The physiological mech-anism that decreased water intake of the animals when con-suming 14 : 0 is as yet unknown. To our knowledge it is the first time that such a relationship between lipid intake and ad libitum tap water intake has been described.
Interactions between myristic acid supplementation and diet composition
As mentioned earlier, the effects of 14 : 0 supplementation on rumen microbes will depend on the concentration of non-esterified fatty acids in the medium, as was shown by Henderson (1973) for the inhibition of methanogens. Galbraith et al. (1971) concluded that, to exert antimicrobial activity, non-esterified fatty acids have to be in solution and have to remain sufficiently lipophilic to permit adsorption on to the cell surface of the microbes. Therefore, dietary com-ponents that influence the concentration of free 14 : 0
in rumen fluid will be decisive for the extent of its CH4
-sup-pressing effect. In this context, in vitro investigations with MCFA revealed two important interactions: (i) with the fibre content of the diet (Machmu¨ller et al. 2001); (ii) with the dietary Ca content (Machmu¨ller et al. 2002).
Harfoot et al. (1974) demonstrated that fatty acids might attach either to rumen microbes or to feed particles. Thus, for the present study two basal diets were prepared differing in their forage:concentrate value, which is associated with
differences in feed particle structure and inertness. Highly significant interactions between these basal diets and
supplementation were found in the CH4 emissions of the
animals, which is in line with previous in vitro findings (Dong et al. 1997; Machmu¨ller et al. 2001). In the present
study, with the forage-based diet the decrease in CH4
emis-sions by 14 : 0 was less than half the decrease achieved with the concentrate-based diet. Since the two basal diets did not affect average rumen pH, it can be assumed that this was mainly a result of the different amount and structure of the dietary particulate matter. With the forage-based diet, prob-ably more 14 : 0 was attached to the feed particles and less to the methanogens than with the concentrate-based diet. The use of the forage-based diet also decreased the effects of
14 : 0 on rumen fluid NH3, water intake and water excretion,
whereas other variables, such as pH, VFA and archaeal counts, seemed to be unaffected by the combinations of basal diet type and 14 : 0.
In the rumen, non-esterified fatty acids could also chelate with cations, especially with the alkaline earth metal Ca, resulting in insoluble and inactive complexes (El Hag & Miller, 1972). The formation of Ca soaps is known to alter the effects of fatty acids on rumen fermentation (for example, Jenkins & Palmquist, 1982). Concerning methano-genesis, significant interactions between supplementation of 12 : 0 and Ca was recorded in vitro (Machmu¨ller et al. 2002). Accordingly, in the present study, increasing the dietary Ca content from 4·2 and 9·0 g/kg DM significantly decreased the
effect of the 14 : 0 supplementation on CH4release from the
animals and even reversed the effect of 14 : 0 on other traits such as rumen archaea, acetate:propionate and hemicellu-lose digestion. However, although the Ca:14 : 0 molar value was increased from 1 : 2 to 1 : 1, the reversal of the
CH4-suppressing effect of 14 : 0 was incomplete. There are
three reasons why Ca probably had this limited effect. First, the process of saponification is directly related to rumen pH (Palmquist et al. 1986) with the highest rates found at a pH of 7. Therefore, the decrease in pH, which accompanied 14 : 0 supplementation, could have limited soap formation. Second, calcium carbonate, a common Ca source but known to have a low solubility in rumen fluid (Keyser et al. 1985), was used to increase the Ca content of the diets. Third, nothing is known about the Ca availability from the other dietary components (i.e. hay, soyabean meal and barley). However, the effect of Ca on methanogenesis did not differ noticeably between the two basal diets, suggesting that the Ca ions will interact with free 14 : 0 even when a proportion of 14 : 0 is inactivated by attachment to the feed particles.
Conclusions
The present results demonstrate that 14 : 0 is a promising
feed additive to suppress CH4 emissions from ruminants,
with decreases of up to 58 %. However, 14 : 0 seems to be less effective in diets with a high forage proportion, a common diet type in many agricultural systems worldwide. Concerning dietary Ca level, a high efficacy of 14 : 0 is guaranteed only when the Ca supply does not exceed the actual requirements of the animals. A favourable side effect of supplementing diets with 14 : 0 is a decreased
water consumption, which is particularly interesting in regions with water scarcity. Generally, the present results show that, because of the impact of the animal, in vivo
verifications of CH4mitigation strategies are indispensable
and that in vivo the concentrations of rumen microbes involved in methanogenesis, i.e. methanogens or ciliate protozoa, are not reliable as indicators for the success of a strategy.
Acknowledgements
The authors gratefully acknowledge the technical assist-ance of R. H. Razminowicz and S. J. Dule˛ba in animal care and laboratory analysis and acknowledge B. Jo¨rg for technical support in matters concerning the respiratory chambers.
References
Agricultural Research Council (1980) The Nutrient Requirements of Ruminant Livestock. Slough, UK: Commonwealth Agricul-tural Bureaux.
Blaxter KL & Clapperton JL (1965) Prediction of the amount of methane produced by ruminants. Br J Nutr 19, 511 – 522.
Blaxter KL & Czerkawski J (1966) Modifications of the methane production of the sheep by supplementation of its diet. J Sci Food Agric 17, 417 – 421.
Boone DR, Whitman WB & Rovie`re P (1993) Diversity and taxonomy of methanogens. In Methanogenesis: Ecology, Physiology, Biochemistry & Genetics, pp. 35 – 80 [JG Ferry, editor]. New York, NY: Chapman & Hall.
Brouwer E (1965) Report of sub-committee on constants and factors. In Energy Metabolism, pp. 441 – 443 [KL Blaxter, editor]. London: Academic Press.
Czerkawski JW (1969) Methane production in ruminants and its significance. In World Review of Nutrition and Dietetics, vol. 11, pp. 240 – 282 [GH Bourne, editor]. Basel, Switzerland: S Karger.
Dohme F, Machmu¨ller A, Wasserfallen A & Kreuzer M (2001a) Ruminal methanogenesis as influenced by individual fatty acids supplemented to complete ruminant diets. Lett Appl Microbiol 32, 47 – 51.
Dohme F, Sutter F, Machmu¨ller A & Kreuzer M (2001b) Methane formation and energy metabolism of lactating cows receiving individual medium-chain fatty acids. In Energy Metabolism in Animals. Proceedings of the 15th Symposium on Energy Metabolism in Animals, 2000, pp. 369 – 372 [A Chwalibog and K Jabobsen, editors]. Wageningen, The Netherlands: Wageningen Pers.
Dong Y, Bae HD, McAllister TA, Mathison GW & Cheng KJ (1997) Lipid-induced depression of methane production and digestibility in the artificial rumen system (RUSITEC). Can J Anim Sci 77, 269 – 278.
El Hag GA & Miller TB (1972) Evaluation of whisky distillery by-products VI. The reduction in digestibility of malt distiller’s grains by fatty acids and the interaction with calcium and other reversal agents. J Sci Food Agric 23, 247 – 258.
Galbraith H & Miller TB (1973) Effect of metal cations and pH on the antibacterial activity and uptake of long chain fatty acids. J Appl Bacteriol 36, 635 – 646.
Galbraith H, Miller TB, Paton AM & Thompson JK (1971) Antibacterial activity of long chain fatty acids and the reversal
with calcium, magnesium, ergocalciferol and cholesterol. J Appl Bacteriol 34, 803 – 813.
Harfoot CG, Crouchman ML, Noble RC & Moore JH (1974) Competition between food particles and rumen bacteria in the uptake of long chain fatty acids and triglycerides. J Appl Bacteriol 37, 633 – 641.
Henderson C (1973) The effects of fatty acids on pure cultures of rumen bacteria. J Agric Sci 81, 107 – 112.
Hinsberg K (1953) Untersuchung der Organe, Ko¨rperflu¨ssigkeiten und Ausscheidungen. 2. Harn. (Investigation of the organs, body fluids and excreta 2. Urine). In Handbuch der Physiolo-gisch- und PatholoPhysiolo-gisch-chemischen Analyse, 10th ed., vol. 5, pp. 181 – 300 [K Lang and E Lehnnartz, editors]. Berlin, Germany: Springer-Verlag.
Hungate RE (1966) The Rumen and its Microbes. New York, NY: Academic Press Inc.
Immig I (1996) The rumen and hindgut as source of ruminant methanogenesis. Environ Monit Assess 42, 57 – 72.
Jenkins TC & Palmquist DL (1982) Effect of added fat and calcium on in vitro formation of insoluble fatty acid soaps and cell wall digestibility. J Anim Sci 55, 957 – 963.
Johnson DE, Johnson KA, Ward GM & Branine ME (2000) Ruminants and other animals. In Atmospheric Methane: Its Role in the Global Environment, pp. 112 – 133 [MAK Khalil, editor]. Berlin, Germany: Springer-Verlag.
Kabara JJ (1978) Fatty acids and derivatives as antimicrobial agents. A review. In The Pharmacological Effect of Lipids, pp. 1 – 14 [JJ Kabara, editor]. Champaign, IL: The American Oil Chemists’ Society.
Keyser RB, Noller CH, Wheeler LJ & Schaefer DM (1985) Characterization of limestones and their effects in vitro and in vivo in dairy cattle. J Dairy Sci 68, 1376 – 1389. Khalil MAK (2000) Atmospheric methane: an introduction.
In Atmospheric Methane: Its Role in the Global Environment, pp. 1 – 8 [MAK Khalil, editor]. Berlin, Germany: Springer-Verlag.
Lin C, Raskin L & Stahl DA (1997) Microbial community structure in gastrointestinal tracts of domestic animals: comparative analyses using rRNA-targeted oligonucleotide probes. FEMS Microbiol Ecol 22, 281 – 294.
Machmu¨ller A, Dohme F, Soliva CR, Wanner M & Kreuzer M (2001) Diet composition affects the level of ruminal methane suppression by medium-chain fatty acids. Aust J Agric Res 52, 713 – 722.
Machmu¨ller A & Kreuzer M (1999) Methane suppression by coconut oil and associated effects on nutrient and energy balance in sheep. Can J Anim Sci 79, 65 – 72.
Machmu¨ller A, Soliva CR & Kreuzer M (2002) In vitro ruminal methane suppression by lauric acid as influenced by dietary calcium. Can J Anim Sci 82, 233 – 239.
Matsumoto M, Kobayashi T, Takenaka A & Itabashi H (1991) Defaunation effects of medium-chain fatty acids and their derivatives on goat rumen protozoa. J Gen Appl Microbiol 37, 439 – 445.
Moe PW & Tyrrell HF (1980) Methane production in dairy cows. In Energy Metabolism. Proceedings of the 8th Symposium on Energy Metabolism, 1979, pp. 59 – 62 [LE Mount, editor]. London: Butterworths.
Moss AR, Jouany JP & Newbold J (2000) Methane production by ruminants: its contribution to global warming. Annal Zootech 49, 231 – 253.
Naumann K & Bassler R (1997) Methodenbuch. Band III. Die Chemische Untersuchung von Futtermitteln, 4th ed. Darmstadt, Germany: VDLUFA-Verlag.
Okine EK, Mathison GW & Hardin RT (1989) Effects of changes in frequency of reticular contractions on fluid
and particulate passage rates in cattle. J Anim Sci 67, 3388 – 3396.
Palmquist DL, Jenkins TC & Joyner AE Jr (1986) Effect of dietary fat and calcium source on insoluble soap formation in the rumen. J Dairy Sci 69, 1020 – 1025.
Raskin L, Stromley JM, Rittmann BE & Stahl DA (1994) Group-specific 16S rRNA hybridization probes to describe natural communities of methanogens. Appl Environ Microbiol 60, 1232 – 1240.
Rogers JA & Davis CL (1982) Rumen volatile fatty acid production and nutrient utilization in steers fed a diet supplemented with sodium bicarbonate and monensin. J Dairy Sci 65, 944 – 952.
Sandaa RA, Enger Ø & Torsvik V (1999) Abundance and diversity of Archaea in heavy-metal-contaminated soils. Appl Environ Microbiol 65, 3293 – 3297.
Stahl DA, Amann RI, Poulsen LK, Raskin L & Capman WC (1995) Use of fluorescent probes for determinative microscopy of methanogenic Archaea. In Archaea: Methanogens: A Laboratory Manual, pp. 111 – 121 [KR Sowers and HJ Schreier, editors]. New York, NY: Cold Spring Harbor Laboratory Press. Sutton JD, Knight R, McAllan AB & Smith RH (1983) Digestion and synthesis in the rumen of sheep given diets supplemented with free and protected oils. Br J Nutr 49, 419 – 432.
Swiss Federal Research Station of Animal Production (1999) Fu¨t-terungsempfehlungen und Na¨hrwerttabellen fu¨r Wiederka¨uer,
4th ed. Zollikofen, Switzerland: Landwirtschaftliche Lehrmittel-zentrale.
Van Kessel JAS & Russell JB (1996) The effect of pH on ruminal methanogenesis. FEMS Microbiol Ecol 20, 205 – 210. Van Nevel CJ & Demeyer DI (1996) Control of rumen
methanogenesis. Environ Monit Assess 42, 73 – 97.
Van Soest PJ, Robertson JB & Lewis BA (1991) Methods for dietary fiber, neutral detergent fiber, and nonstarch polysac-charides in relation to animal nutrition. J Dairy Sci 74, 3583 – 3597.
Warner ACI & Stacy BD (1968) The fate of water in the rumen 2. Water balances throughout the feeding cycle in sheep. Br J Nutr 22, 389 – 410.
Whitelaw FG, Eadie JM, Bruce LA & Shand WJ (1984) Methane formation in faunated and ciliate-free cattle and its relationship with rumen volatile fatty acid productions. Br J Nutr 52, 261 – 275.
Williams AG & Coleman GS (1997) The rumen protozoa. In The Rumen Microbial Ecosystem, pp. 73 – 139 [PN Hobson and CS Stewart, editors]. London: Chapman & Hall.
Wuebbles DJ & Hayhoe K (2002) Atmospheric methane and global change. Earth-Sci Rev 57, 117 – 210.
Zhao JY, Shimojo M & Goto I (1993) The effects of feeding level and roughage/concentrate ratio on the measurement of protein degradability of two tropical forages in the rumen of goats, using the nylon bag technique. Anim Feed Sci Technol 41, 261 – 269.