Effects of carbohydrate sugars and artificial sweeteners on appetite
and the secretion of gastrointestinal satiety peptides
Robert E. Steinert*, Florian Frey, Antonia To
¨pfer, Ju
¨rgen Drewe and Christoph Beglinger
Division of Gastroenterology, Department of Biomedicine, Clinical Research Center, University Hospital Basel, CH-4031 Basel, Switzerland
(Received 25 May 2010 – Revised 9 November 2010 – Accepted 10 November 2010 – First published online 24 January 2011)
Abstract
In vitro, both carbohydrate sugars and artificial sweeteners (AS) stimulate the secretion of glucagon-like peptide-1 (GLP-1). It has been suggested that the gut tastes sugars and AS through the same mechanisms as the tongue, with potential effects on gut hormone release. We investigated whether the human gut responds in the same way to AS and carbohydrate sugars, which are perceived by lingual taste as equisweet. We focused on the secretion of gastrointestinal (GI) satiety peptides in relation to appetite perception. We performed a placebo-controlled, double-blind, six-way, cross-over trial including twelve healthy subjects. On separate days, each subject received an intragastric infusion of glucose, fructose or an AS (aspartame, acesulfame K and sucralose) dissolved in 250 ml of water or water only (control). In a second part, four subjects received an intragastric infusion of the non-sweet, non-metabolisable sugar analogue 2-deoxy-D-glucose. Glu-cose stimulated GLP-1 (P¼ 0·002) and peptide tyrosine tyrosine (PYY; P¼ 0·046) secretion and reduced fasting plasma ghrelin (P¼ 0·046), whereas fructose was less effective. Both carbohydrate sugars increased satiety and fullness (albeit not significantly) compared with water. In contrast, equisweet loads of AS did not affect gastrointestinal peptide secretion with minimal effects on appetite. 2-Deoxy-D-glucose increased hunger ratings, however, with no effects on GLP-1, PYY or ghrelin. Our data demonstrate that the secretion of GLP-1, PYY and ghrelin depends on more than the detection of (1) sweetness or (2) the structural analogy to glucose.
Key words:Satiety peptides: Artificial sweeteners: Carbohydrate sugars: Intestinal chemosensitivity: Gut taste receptors
There is strong evidence that taste-signalling mechanisms identified in the oral epithelium also operate in the gut. It has been suggested that open-type enteroendocrine cells directly sense nutrients via G-protein-coupled receptors to modulate the secretion of gastrointestinal (GI) peptides(1 – 5). One example supporting this idea is that a much greater insu-lin response occurs after an oral glucose load, i.e. after direct contact of glucose with the intestinal lumen, than after intravenous injection of an identical glucose load(6). The so-called ‘incretin effect’ is attributed to glucagon-like peptide-1 (GLP-1) and glucose-dependent insulinotropic peptide (GIP); both are released from enteroendocrine K and L cells in the proximal and distal gut. In addition to this incretin effect, GLP-1 and other GI peptides including cholecystokinin and peptide tyrosine tyrosine (PYY) delay gastric emptying and dose-dependently reduce food intake in animals and humans(7 – 9). For GLP-1, long-acting analogues are already clinically available (exenatide and liraglutide) for the treat-ment of type 2 diabetes mellitus. In some of these studies, it
has been shown that subcutaneous injections of exenatide, a stable GLP-1 receptor agonist, to patients with type 2 diabetes are associated with a gradual and linear weight loss with no signs of impaired efficacy with time(10). The question, there-fore, is whether it is possible to increase the secretion of these peptides from endogenous stores using specific stimuli. In this regard, Jang et al.(2) demonstrated that glucose-stimulated GLP-1 and GIP secretion is impaired in knockout mice lacking a-gustducin (a taste-specific G-protein subunit) or T1R3 (part of the sweet-taste receptor heterodimer T1R2/ T1R3)(2). In addition, in vitro, both carbohydrate sugars and artificial sweeteners (AS) were capable of stimulating GLP-1 and GIP release from enteroendocrine cell lines (GLUTag, NCI-H716)(2,4). It is, therefore, currently concluded that the gut directly senses glucose or other sweet compounds by sweet-taste G-protein-coupled receptors and gustducin and that this leads to GLP-1 release from enteroendocrine cells(11). We, therefore, sought to investigate whether carbohydrate sugars and AS (aspartame, acesulfame K and
* Corresponding author: R. E. Steinert, fax þ 41 612655352, email [email protected]
Abbreviations: 2DG, 2-deoxy-D-glucose; AS, artificial sweetener; AUC, area under the plasma concentration – time curve; GI, gastrointestinal; GIP, glucose-dependent insulinotropic peptide; GLP-1, glucagon-like peptide-1; PYY, peptide tyrosine tyrosine.
qThe Authors 2011
British
Journal
of
sucralose), which are perceived by lingual taste as equisweet, have equivalent effects on the release of GI peptides and appetite perception in human subjects.
Subjects and methods Subjects
The study included twelve healthy, non-smoking, volunteers (six males and six females, mean age 23·3 (SEM 0·7; range 19 – 29) years). Body weight of all subjects was in the normal range for age, sex and height and stable for at least 3 months (mean BMI 23·0 (SEM0·5; range 20·5 – 24·7) kg/m2). The criteria for exclusion were smoking, substance abuse, chronic medical or psychiatric illness, and any abnormalities detected on physical examination or screening blood tests. None of the subjects had a history of food allergies or dietary restrictions. The study was conducted according to the guidelines laid down in the Declaration of Helsinki, and all procedures involving human subjects were approved by the State Ethical Committee of Basel. Written informed consent was obtained from all subjects.
Study design
Administration of artificial sweeteners or carbohydrate sugars. The study was performed as a randomised, placebo-controlled, double-blind, six-way cross-over trial. The six treatments were separated by at least 3 – 5 d. Subjects were instructed to abstain from alcohol, caffeine and strenuous exercise for 24 h before each treatment. On each test day, sub-jects reported to the research unit at 08.00 hours after a 10 h overnight fast. After arrival at the research unit, a radio-opaque polyvinyl feeding tube (external diameter 8 French) was inserted into the stomach through an anaesthetised nos-tril. Its intragastric position was confirmed by rapid injection of 10 ml of air and auscultation of the upper abdomen. The feeding tube was firmly attached to the skin behind the ear to prevent further progression during the treatment. An intra-venous cannula was inserted into a forearm vein for blood sample collection. A baseline blood sample was taken, before each subject received an intragastric infusion of 250 ml of the test solution over 2 min (t ¼ 0 – 2 min). Solutions were equated for sweetness intensity with each other in preliminary psychophysical tests. Healthy volunteers rated the sweetness of different test solutions and equated them with a standard 50 g of glucose solution (positive control).
The results largely confirmed previous estimates by Rogers et al.(12)and Bellisle & Drewnowski(13), and the concentrations were comparable with the amounts found in commercially available beverages and soft drinks (Table 1).
The control solution was 250 ml of tap water only. Solutions were freshly prepared each morning of the study and were at room temperature when administered. The feeding tube was removed directly after the infusion was completed, and blood was drawn at regular time intervals at 5, 10, 15, 20, 30, 45, 60, 75, 90 and 120 min. Blood samples were collected on ice into tubes containing EDTA (6 mmol/l), aprotinin (500 kIU/l; 0·07 mg aprotinin/ml blood) and a dipeptidyl pep-tidase IV inhibitor. After centrifugation at 48C, plasma samples were processed into different aliquots and kept frozen at 2708C until analysis. The appetite profile (hunger, satiety and fullness) was assessed using visual analogue scales, 100 mm (or 10 cm) in length with words anchored at each end, expressing the most positive and most negative rating(14,15). For example, a score of 0 for hunger indicated that the subject was not hungry at all, 2 indicated slightly hungry, 5 indicated moderately hungry, 8 indicated very hungry and 10 indicated absolutely ravenous. Subjects had no exposure to food cues during evaluation, and they were allowed to talk, relax and read with the exception that they could not discuss or compare their ratings. Vital signs (blood pressure and heart rate) were continuously measured while subjects were sitting in a comfortable armchair.
Administration of 2-deoxy-D-glucose. In an additional experiment, four subjects (two males and two females) received an intragastric infusion of 2-deoxy-D-glucose (2DG), a non-sweet, non-metabolisable structural analogue of glucose. In total, 3·75 g of 2DG were dissolved in 250 ml of tap water; the same experimental set-up was used, and the effects on GI peptide secretion, appetite and glucose homeostasis were compared with the data of the first exper-iment. Blood samples were collected before and 30, 60 and 120 min after intragastric infusion. The appetite profile was assessed using visual analogue scales, and vital signs were continuously measured.
Laboratory analysis
Active GLP-1 was measured, as has been described recently(16), using a commercially available ELISA kit (Linco Research, Inc., St Charles, MO, USA). This kit is for non-radioactive quantification of biologically active forms of
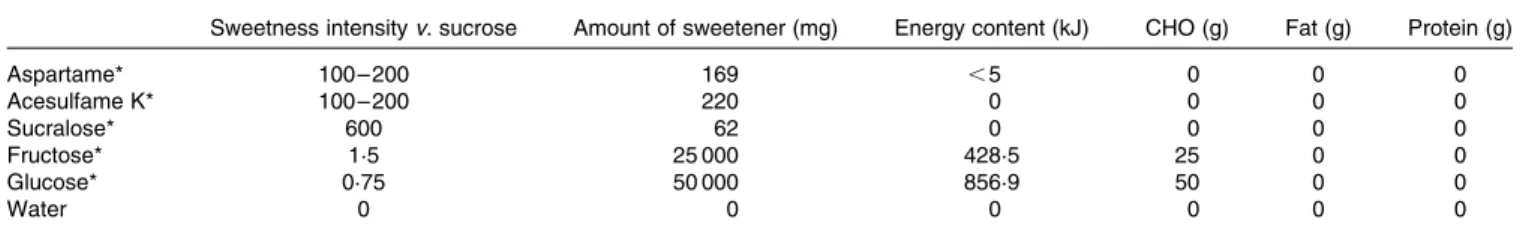
Table 1. Nutritional composition/sweetening power of the test solutions
Sweetness intensity v. sucrose Amount of sweetener (mg) Energy content (kJ) CHO (g) Fat (g) Protein (g)
Aspartame* 100 – 200 169 ,5 0 0 0 Acesulfame K* 100 – 200 220 0 0 0 0 Sucralose* 600 62 0 0 0 0 Fructose* 1·5 25 000 428·5 25 0 0 Glucose* 0·75 50 000 856·9 50 0 0 Water 0 0 0 0 0 0 CHO, carbohydrates.
* Amount of each sweetener was dissolved in 250 ml of tap water.
British
Journal
of
GLP-1 (i.e. 7 – 36 amide and 7 – 37) in the plasma and other biological media. Total PYY, total ghrelin, insulin and gluca-gon were measured with commercially available RIA kits (Linco Research, Inc.; Cisbio International, Bagnols, France; Siemens Medical Solution Diagnostics, Los Angeles, CA, USA); the methods have been described recently in more detail(16). Blood glucose was measured using the glucose oxidase method.
Materials
Glucose monohydrate and fructose were purchased at Ha¨nse-ler (Herisau, Switzerland); aspartame was purchased at Fagron (Barsbuettel, Germany); sucralose and 2DG were purchased at Sigma-Aldrich (Buchs, Switzerland). Acesulfame K was a friendly gift of Merisant Company (Neuchatel, Switzerland).
Statistical analysis
Descriptive statistics was used for demographic variables such as age, weight, height and BMI. Individual hormone concentrations v. time data were used to obtain GLP-1, PYY and ghrelin metrics, including maximum/minimum plasma concentrations (Cmax/Cmin), the time of maximal/minimal pep-tide occurrence (Tmax/Tmin) and the area under the plasma concentration – time curve (AUC) calculated by the trapezoidal method. Differences between water and either carbohydrate sugars or AS were assessed using the non-parametric Fried-man test due to non-normal data distribution. In the case of significant differences, pairwise comparison was performed using the Wilcoxon signed-rank test, followed by Bonferroni’s correction to account for multiple comparisons. Visual ana-logue scales were analysed by calculating return to baseline values (interception with the y-axis) using linear interpolation; differences between water v. single treatment groups were assessed using the non-parametric Friedman test due to dis-tinct data variation and non-normal distribution. All statistical analyses were done using SPSS for Windows software (version 15.0; SPSS, Chicago, IL, USA). Differences were considered to be significant with P, 0·05. Data are presented as means with their standard errors.
Results
Administration of artificial sweeteners or carbohydrate sugars
Plasma glucagon-like peptide-1. A marked increase in plasma GLP-1 was seen after the glucose load, with Cmax¼ 9·7 (SEM 3·2) pmol/l at 22·9 (SEM 2·7) min. The AUC was significantly increased (P¼ 0·002) compared with water. The equisweet load of fructose only slightly elevated plasma GLP-1 concentrations, with Cmax¼ 2·8 (SEM 0·5) pmol/l at 20·8 (SEM 4·1) min; however, the AUC was not significantly
increased compared to water. No increase in plasma GLP-1 concentrations was seen after the administration of sucralose, aspartame or acesulfame K, and no significant difference was observed compared with water (Fig. 1(a) and Table 2).
Plasma peptide tyrosine tyrosine. A similar trend was observed for plasma PYY concentrations with elevated con-centrations after glucose (Cmax¼ 187·4 (SEM32·9) pg/l at 27·9 (SEM 3·7) min; P¼ 0·005) and to a lesser extent after fructose
administration (Cmax¼ 154·8 (SEM 13·0) pg/l at 37·9 (SEM 6·6) min; P¼ 0·004). The AUC was, however, only significantly increased after the glucose load (P¼ 0·046). No effect was observed with fructose and AS (Fig. 1(b) and Table 2).
Plasma ghrelin. After the glucose and fructose load, fasting plasma ghrelin concentrations were reduced; a significant reduction in the AUC was only observed for glucose
12 (b) (a) (c) 10 GLP -1 (pmol/l) 8 6 4 2 0 240 200 PYY (pg/ml) 160 120 80 40 0 1000 900 Ghrelin (pg/ml) 800 700 600 500 400 300 200 Time (min) Time (min) Time (min) –15 0 15 30 45 60 75 90 105 120 –15 0 15 30 45 60 75 90 105 120 –15 0 15 30 45 60 75 90 105 120
Fig. 1. (a) Glucagon-like peptide-1 (GLP-1), (b) peptide tyrosine tyrosine (PYY) and (c) ghrelin release in response to an intragastric load of water ( – X–) or carbohydrate sugars (glucose (–W–) and fructose (–e–)) or artificial sweeteners (aspartame (· · ·S· · ·), sucralose (· · ·A· · ·) or acesulfame K (· · ·f· · ·)). Values are means, with their standard errors represented by error bars.
British
Journal
of
(P¼ 0·046). In contrast, sucralose, aspartame or acesulfame K did not affect plasma ghrelin concentrations (Fig. 1(c) and Table 2).
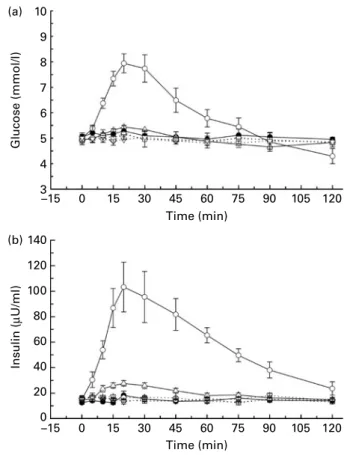
Blood glucose. After the intragastric infusion of glucose, blood glucose concentrations were significantly increased from 5·0 (SEM0·1) mmol/l at baseline to 8·6 (SEM0·4) mmol/l at
30·0 (SEM4·6) min (P¼ 0·002) compared to water (Fig. 2(a)).
Thereafter, blood glucose concentrations decreased progress-ively and fell below baseline at 90 min. With fructose adminis-tration, blood glucose concentrations were slightly elevated to 5·7 (SEM0·2) mmol/l at 24·2 (SEM4·2) min (P¼ 0·047) (Fig. 2(a)). The AS did not affect blood glucose concentrations.
Plasma insulin. Plasma insulin after glucose (Cmax¼ 127·4 (SEM 19·2) mU/ml; P¼ 0·002) and fructose (Cmax¼ 32·3 (SEM 2·0) mU/ml; P¼ 0·002) administration significantly increased compared with water (Fig. 2(b)). No significant insulin response was observed when sucralose, aspartame or acesul-fame K was administered.
Plasma glucagon. Glucagon secretion was slightly sup-pressed when glucose was administered; the effect was albeit not significant. No effect on plasma glucagon was detected with fructose and AS (data not shown).
Appetite profile. The appetite profile revealed that the (energy-containing) carbohydrate sugar loads induced the longest-lasting increase in fullness ratings above baseline, which was prolonged for fructose 108·4 (SEM 6·1) min and for glucose 90·5 (SEM11·2) min. In contrast, water (74·0 (SEM
13·4) min) and the AS acesulfame K (65·6 (SEM 15·8) min),
aspartame (83·1 (SEM 15·9) min) and sucralose (65·3 (SEM
14·1) min) induced shorter augmented fullness above initial ratings. However, due to the large data variability, these differ-ences did not reach statistical significance (Fig. 3(c) and Table 3). Satiety and hunger ratings showed similar trends, however, with generally smaller differences. Overall, the AS increased satiety and fullness and reduced hunger ratings to an amount that was intermediate between the carbohydrate sugars and the water control.
Side effects. No side effects were reported when glucose, fructose or the AS was administered.
Administration of 2-deoxy-D-glucose
Plasma glucagon-like peptide-1, peptide tyrosine tyrosine and ghrelin. Administration of 2DG did not stimulate the secretion of GLP-1 and PYY; also circulating ghrelin was not affected (data not shown).
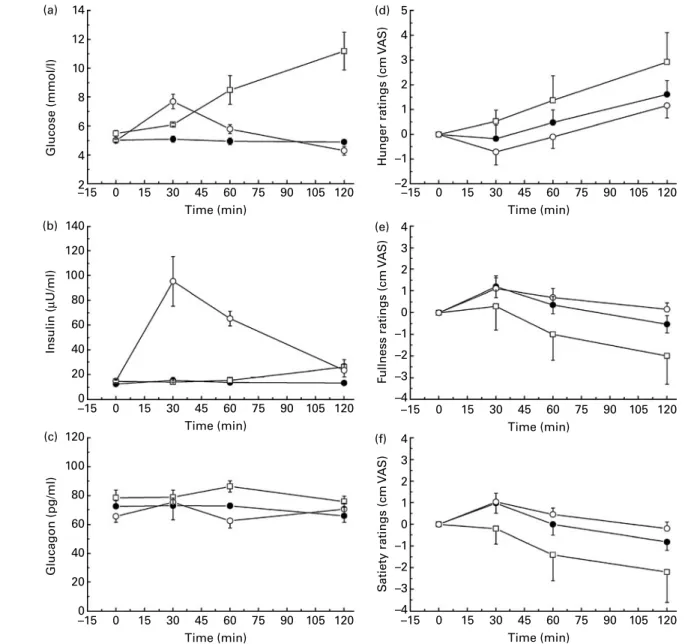
Plasma glucose, glucagon and insulin. 2DG administration markedly increased blood glucose from baseline concen-trations of (5·5 (SEM 0·2) mmol/l) to peak concentrations of
11·2 (SEM1·3) mmol/l at 120 min. Minor effects were observed
for plasma insulin with a small increase at 120 min. Plasma glucagon appeared to slightly increase at 60 min compared with water and glucose loads (Fig. 4(a) – (c)). Due to the small number of subjects, no formal statistical comparison was performed.
Appetite profile. After administration of 2DG, hunger rat-ings were clearly increased compared to water, in contrast, glucose visibly reduced hunger ratings from 30 to 120 min.
Table 2 . Secretion of glucagon-like peptide-1 (GLP-1), peptide tyrosine tyrosine (PYY) and g hrelin in response to carbohydrate sugars or artificial sweeten ers (Mean values with their standard errors and medians) Water Gluco se Fructose Aspartame Acesulfame K Sucral ose Mean SE M Medi an Mean SE M Me dian P Mea n SE M Median P Mean SE M Me dian P Me an SE M Media n P Mean SE M Median P GLP-1 AUC (0 – 120 pmo l£ min/l) 180 ·3 16 ·6 164·0 427 ·9 120·4 2 1 3 ·3 0 ·002 195·5 17 ·8 181·4 0·705 164 ·0 8·0 1 53 ·9 1 ·0 1 9 8 ·2 20 ·8 161·1 1 ·0 200·1 26 ·5 170 ·3 0·836 Cmax (pmol/l) 1 ·9 0 ·3 1·5 9 ·7 3 ·2 4 ·1 0 ·002 2·8 0 ·5 2 ·1 0 ·133 1 ·9 0 ·3 1·4 0 ·611 1·9 0 ·2 1·5 0 ·834 1 ·9 0 ·3 1 ·6 1·0 Tmax (min) N A 2 2 ·9 2 ·7 2 0 ·0 20·8 4 ·1 1 7 ·5 N A N A N A PYY AUC (0 – 120 pg £ min /l) 12 595 1146 12 7 1 3 1 7 296 2952 1 3 432 0 ·046 15 0 2 8 1196 15 139 0·170 13 034 120 4 1 2 858 1 ·0 1 2 611 860 ·6 12 60 7 1 ·0 12 552 1371 12 282 1·0 Cmax (pg/l) 117 ·3 10 ·2 123·0 187 ·4 32 ·9 1 5 2 ·3 0 ·005 154·8 13 ·0 159·4 0·004 123 ·4 11·2 1 2 0 ·0 1 ·0 11 8 ·3 7 ·3 116·9 0 ·791 123·0 12 ·2 125 ·3 1·0 Tmax (min) N A 2 7 ·9 3 ·7 2 0 ·0 37·9 6 ·6 3 0 ·0 N A N A N A Ghrelin AUC (0 – 6 0 pg £ min /ml) 41 498 3080 43 3 8 2 3 6 187 2921 3 5 622 0 ·046 38 9 9 5 2779 41 920 0·170 42 295 301 8 4 1 947 1 ·0 4 0 900 2865 44 76 2 1 ·0 41 852 3366 38 290 0·910 Cmin (pg/ml) 650 ·5 45 ·7 665·0 540 ·6 46 ·2 5 0 9 ·5 0 ·007 592·7 42 ·5 643·5 0·137 672 ·3 46·0 6 6 9 ·5 0 ·904 65 1 ·5 4 6 ·8 716·0 0 ·791 662·7 53 ·0 605 ·5 1·0 Tmin (m in ) N A 6 4· 2 1 0· 6 6 0· 0 7 5 1 0· 1 6 0· 0 N A N A N A AUC, area under the c on centration – time curve; Cmax , maximum p eak pl asma con centration; Tmax , time to maximum peak plasma concentration; Cmin , m inimum peak plasma concentration; Tmin , tim e to m inimum peak plasma concentration; NA, not applicable. Mean values were s ignificantly different compared with those of water (P , 0· 0 5 ).
British
Journal
of
Nutrition
Feelings of fullness and satiety showed similar trends, with glucose triggering increased fullness and satiety, whereas 2DG clearly reduced fullness and satiety ratings compared to water (Fig. 4(d) – (f)). Due to the small number of subjects, no formal statistical comparison was performed.
Side effects. No nausea or abdominal discomfort was reported when 2DG was administered; also blood pressure and heart rate were not significantly affected. However, between 30 and 120 min, all subjects reported distinct feelings of warmth and mild dizziness; two subjects sweated visibly.
Discussion
GLP-1 and PYY have important metabolic functions; both have been shown to reduce food intake in humans(17). GLP-1 also directly stimulates pancreatic b-cells; the so-called incretin effect accounts for approximately 50 – 70 % of the total insulin secretion after a meal(18). In addition, obese subjects have attenuated plasma concentrations of both peptides, suggesting major changes in regulatory functions(19,20). For GLP-1, long-acting analogues are already clinically available (exenatide and liraglutide) for the treatment of type 2 diabetes and, interestingly, subcutaneous injections of exena-tide to patients with type 2 diabetes are associated with a gradual and linear weight loss with no signs of impaired
efficacy with time. In view of this great therapeutic success, the focus is now shifted towards intestinal endocrine cells that naturally produce GLP-1 and PYY. The question is whether it is possible to increase the secretion of these pep-tides from endogenous stores using specific stimuli. However, mechanisms by which carbohydrates, fats and proteins in the gut lumen stimulate the release of GI peptides from enteroen-docrine cells are only insufficiently understood. Regarding the detection of carbohydrates in the gut, sweet taste receptors (T1R2 þ T1R3), a-gustducin, and several other proteins com-prising a full signalling machinery similar to that found in the mouth have been identified in enteroendocrine cells of the rodent(21) and human small intestine and colon(2,22). Several studies have shown co-localisation of taste receptors
3 (b) (a) 2 Hunger ratings (cm V A S) S atiety ratings (cm V A S) 1 0 –1 –2 3 2 1 0 –1 –2 (c) F ullness ratings (cm V A S) 3 2 1 0 –1 –2 Time (min) –15 0 15 30 45 60 75 90 105 120 Time (min) –15 0 15 30 45 60 75 90 105 120 Time (min) –15 0 15 30 45 60 75 90 105 120
Fig. 3. Effect of the intragastric infusion of water ( – X–) or carbohydrate sugars (glucose ( – W –) and fructose (–e–)) or artificial sweeteners (aspar-tame (· · ·S· · ·), sucralose (· · ·A· · ·) or acesulfame K (· · ·f· · ·)) on (a) hunger, (b) satiety and (c) fullness ratings shown as mean changes from the initial rating. Values are means, with their standard errors represented by error bars. VAS, visual analogue scale.
(b) (a) 10 Glucose (mmol/l) 8 6 4 3 5 7 9 140 120 Insulin ( µ U/ml) 100 80 60 40 20 0 –15 –15 0 15 30 45 60 75 90 105 120 0 15 30 60 Time (min) Time (min) 90 120 45 75 105
Fig. 2. (a) Blood glucose and (b) plasma insulin concentrations in response to an intragastric load of water ( – X–) or carbohydrate sugars (glucose ( – W–), fructose (–e–)) or artificial sweeteners (aspartame (· · ·S· · ·), sucralose (· · ·A· · ·) or acesulfame K (· · ·f· · ·)). Values are means, with their standard errors represented by error bars.
British
Journal
of
with GLP-1, GIP, PYY and cholecystokinin(2,3,22). In addition, studies in mice using knockout models for a-gustducin (a-gust 2 /2 ) or T1R3 (T1R3 2 /2 ) have revealed impaired glucose-stimulated incretin secretion(2). In vitro, both carbo-hydrate sugars and the AS sucralose were capable of stimulat-ing GLP-1 and GIP release from enteroendocrine cell lines (GLUTag, NCI-H716); more importantly, lactisole, a sweet receptor antagonist, blocked the secretion of GLP-1(2,4). Based on these studies, it has been suggested that the gut directly senses glucose or other sweet compounds by taste-signalling elements expressed in L cells and that this leads to GLP-1 release from these same cells(11).
Here, we have investigated in healthy human subjects whether sweetness-matched carbohydrate sugars and AS have equivalent effects on the release of GI satiety peptides, glucose homeostasis and appetite feelings. The data reveal that mainly glucose, and to a small extent fructose, stimulated GLP-1 and PYY release and reduced ghrelin secretion; both also affected appetite with (albeit not significantly) increased satiety and fullness compared with water. The equisweet AS loads did not affect GI peptide secretion with minimal effects on appetite compared with water. These findings correspond to human studies also reporting a lack of effect of AS on incretin release, plasma glucose, C-peptide and gastric
empty-ing(23 – 25); however, the data are in contrast to the
above-mentioned in vitro studies. This may be due to the simple fact that cell culture-based in vitro experiments do only model human physiology, whereas in vivo, the regulatory interface of the GI tract is much more complex and modulated by multiple homeostatic and non-homeostatic factors. In addition, studies in mice and rats have indicated that the majority of incretin-expressing cells in the duodenum and jejunum do not co-localise with a-gustducin(26,27), suggesting that the taste receptor pathway is not the only one involved in signal transduction and subsequent GI peptide secretion. Other, non-taste receptor-mediated mechanisms might be involved in the induction of GI peptide release. Several studies have suggested that the secretion of incretins is also dependent on actively absorbed carbohydrate sugars: in rats, glucose-stimulated GIP secretion was markedly sup-pressed not only by gymnemic acid (a potent blocker of sweet taste) but also by phlorizin, which inhibits the active transport of glucose by the Na-dependent glucose co-transporter 1(28). In addition, in vitro studies using the enter-oendocrine GLUTag cell line have shown that GLP-1 release was impaired when glucose absorption was blocked with phlorizin(29). Further studies by Ritzel et al.(30) have shown that when the non-sweet, non-metabolisable sugar-ana-logues, 3-O-methylglucose (absorbed via passive and active glucose transport systems) and 2DG (absorbed only via passive glucose transport systems) were perfused into the rat ileum, 3-O-methylglucose induced the secretion of GLP-1, whereas 2DG did not, suggesting that the release of GLP-1 is independent of intracellular metabolism but dependent on active cellular uptake.
In this regard, we performed an experiment to test whether an intragastric load of 2DG affects GLP-1, PYY or ghrelin secretion. The data show that 2DG does not affect peptide
Table 3 . Appetite profile expressed a s return to baseline values (in min) after intragastric loads o f water, c arbohydrate sugars or artificial sweeteners (Mean values with their standard errors and medians) Water Glucose Fructose Aspartame Acesulfame K Sucralose Mean SE M Median Mean SE M Median M ean SE M Median Mean SEM Median Mean SE M Median Mean SE M Median Hunger Return to baseline (min) 45 ·2 13 ·0 28 ·3 54 ·8 14 ·8 60·2 70 ·7 10·7 74 ·6 50·2 15·0 50 ·0 52·0 17 ·2 42 ·6 65 ·2 16 ·0 71 ·3 Satiety Return to baseline (min) 55 ·3 11 ·8 46 ·3 82 ·8 13 ·7 103 ·0 9 4 ·0 9 ·3 106 ·8 7 1·2 1 7·0 9 0 ·0 7 5·7 1 6 ·0 9 2 ·5 7 9 ·4 1 3 ·0 7 5 ·0 Fullness Return to baseline (min) 74 ·0 13 ·4 62 ·1 90 ·5 11 ·2 105 ·0 108 ·4 6 ·1 1 20 ·0 83·1 15·9 112 ·9 6 5·6 1 5 ·8 7 3 ·9 6 5 ·3 1 4 ·1 6 7 ·5 No significant differences were detected compared with water.
British
Journal
of
Nutrition
secretion, confirming previous animal and in vitro data for humans and extending the findings to PYY and ghrelin secretion. 2DG is known to reduce intracellular glucose utilisation by competitively inhibiting hexokinase activity and glucose membrane carrier systems. The resulting intra-cellular glucoprivation induces counter-regulatory mechan-isms leading to hyperglycaemia(31,32). The almost linear rise in blood glucose concentrations in the present study reflects these metabolic effects; although blood glucose concen-trations are high, cellular utilisation of glucose at cerebral and peripheral glucosensitive sites did not occur. The observed side effects (heat flushes and sweating) further suggest sympathetic activation. In parallel, we observed a marked increase in hunger feelings. 2DG has been demon-strated to augment food intake and thirst in mammalian species including rats, pigs, monkeys and humans due to
the functional hypoglycaemic state(32). Our data, therefore, support the basic concept of decreasing blood glucose as a metabolic correlate of hunger, namely ‘the glucostatic theory’(33). As mentioned above, the increase in hunger was, however, not reflected by increased plasma ghrelin concen-trations or alterations in plasma GLP-1 or PYY.
Fructose infusions (25 g) did not affect GLP-1, PYY and ghrelin plasma concentrations to the same extent as the equis-weet loads of glucose (50 g); however, fructose induced plasma levels much closer to those observed after glucose infusions than the AS. It is arguable that the different molar load may have affected peptide secretion differentially; how-ever, previous human data document that GLP-1 secretion in response to equal doses (75 g) of either fructose or glucose is less for fructose(34). The relationship between the molecular structure of carbohydrate sugars and their ability to stimulate 14 (a) 12 Glucose (mmol/l) 10 8 6 4 2 140 (b) 120 Insulin ( µ U/ml) 100 80 60 40 20 0 (c) 120 Glucagon (pg/ml) 100 80 60 40 20 0 5 (d) 4 Hunger ratings (cm V A S) 3 2 1 0 –1 –2 (e) 4 F ullness ratings (cm V A S) 3 2 1 0 –1 –2 –3 –4 (f) 4 S atiety ratings (cm V A S) 3 2 1 0 –1 –2 –3 –4 Time (min) –15 0 15 30 45 60 75 90 105 120 Time (min) –15 0 15 30 45 60 75 90 105 120 Time (min) –15 0 15 30 45 60 75 90 105 120 Time (min) –15 0 15 30 45 60 75 90 105 120 Time (min) –15 0 15 30 45 60 75 90 105 120 Time (min) –15 0 15 30 45 60 75 90 105 120
Fig. 4. Effect of the intragastric infusion of 2-deoxy-D-glucose ( – A–) on (a) blood glucose, (b) plasma insulin, (c) plasma glucagon and (d) hunger ratings, (e) fullness ratings and (f) satiety ratings in comparison to intragastric water ( – X–) and glucose (–W–) loads. Values are means, with their standard errors represented by error bars. VAS, visual analogue scale.
British
Journal
of
the release of GLP-1 or GIP has been investigated in detail(35,36). Sirinek et al.(36) demonstrated that only glucose and, to a lesser extent, galactose (C-4 epimer), but not fructose (C-2 keto sugar), mannose (C-2 epimer) or sorbitol (reduced alcohol of glucose), can stimulate the release of GIP. Based on these observations, it has been proposed that a special sugar sensor with specific steric requirements is necessary to directly stimulate incretin release(36).
The finding that AS have less effect on satiety, fullness and hunger ratings compared with carbohydrate sugars confirms the lack of post-ingestive mechanisms and supports recent findings in rats, suggesting that the consumption of AS might lead to increased body weight and obesity(37). However, correlations between appetite ratings and amount of food con-sumed are quite small, and we did not directly measure food intake. The observed satiating effects of fructose in compari-son with the effects of glucose, together with the rather small effects of fructose on peptide levels, suggest that additional mechanisms must operate to terminate a meal and/or to determine inter-meal satiety. Initial studies by Blundell et al.(38 – 40) and a few other studies have reported energy compensation in humans when energy-containing sugars were replaced by AS. A large number of subsequent studies could, however, not show an effect of AS on appetite and food intake(41 – 43).
Conclusions
Sweet taste detection via T1R2 þ T1R3 is suggested to be one potential mechanism by which glucose is sensed in gut enteroendocrine cells to trigger peptide secretion. Here, we demonstrate that equisweet solutions of either glucose, fruc-tose or AS have different effects on gut peptide secretion: only glucose potently stimulates the secretion of GLP-1 and PYY and decreases ghrelin; in contrast, fructose is much less effective and AS have no effect. We infer from these obser-vations that sweetness per se is not sufficient to stimulate the secretion of these peptides in humans. Additional chemosen-sory mechanisms directed towards the structural integrity of the glucose molecule (as one of the major fuels for the body) must exist including active transport systems. Finally, potential energy-sensing mechanisms or energy thresholds might exist for the secretion of GLP-1 and PYY, although it is unlikely that the release is directly related to the energetic load in a dose – response manner.
Our experimental approach was based on equisweet sol-utions, so we cannot exclude that different molar loads and osmolarities would have affected peptide secretion differen-tially. Also, we cannot rule out that under certain conditions, AS may enhance GLP-1 release when mixed with glucose, as it has been suggested that AS might indirectly contribute to GIP and GLP-1 release by modulating the expression of Na-dependent glucose co-transporter 1. These considerations are questions for future research; they are based, at least in part, on the present findings showing that the stimulation of gut sweet taste receptors per se is not sufficient to produce relevant regulatory peptide responses.
Acknowledgements
We thank the team of the Clinical Research Center Mrs Claudia Bla¨si, Sylvia Ketterer and Gerdien Gamboni for their expert technical assistance. The study was supported by a grant of the Swiss National Science Foundation (grant no. 320000-118330). The authors have no conflict of interest. R. E. S. and C. B. designed the research; F. F. and A. T. conducted the research; R. E. S. and J. D. performed statistical analysis; R. E. S. and C. B. wrote the manuscript. C. B. had primary responsibility for the final content. All authors read and approved the final manuscript.
References
1. Theodorakis M, Carlson O, Michopoulos S, et al. (2006) Human duodenal enteroendocrine cells: source of both incretin peptides, GLP-1 and GIP. Am J Physiol Endocrinol Metab 290, E550 – E559.
2. Jang H, Kokrashvili Z, Theodorakis M, et al. (2007) Gut-expressed gustducin and taste receptors regulate secretion of glucagon-like peptide-1. Proc Natl Acad Sci U S A 104, 15069 – 15074.
3. Rozengurt E & Sternini C (2007) Taste receptor signaling in the mammalian gut. Curr Opin Pharmacol 7, 557 – 562. 4. Margolskee R, Dyer J, Kokrashvili Z, et al. (2007) T1R3 and
gustducin in gut sense sugars to regulate expression of Naþ-glucose cotransporter 1. Proc Natl Acad Sci U S A 104, 15075 – 15080.
5. Dyer J, Salmon K, Zibrik L, et al. (2005) Expression of sweet taste receptors of the T1R family in the intestinal tract and enteroendocrine cells. Biochem Soc Trans 33, 302 – 305. 6. Creutzfeldt W (1980) Insulinotropic factors of the gut – the
broadening incretin concept. Gastroenterology 78, 1631 – 1632.
7. Woods S (2004) Gastrointestinal satiety signals I. An over-view of gastrointestinal signals that influence food intake. Am J Physiol Gastrointest Liver Physiol 286, G7 – G13. 8. Degen L, Oesch S, Casanova M, et al. (2005) Effect of
pep-tide YY3-36 on food intake in humans. Gastroenterology 129, 1430 – 1436.
9. Gutzwiller JP, Goke B, Drewe J, et al. (1999) Glucagon-like peptide-1: a potent regulator of food intake in humans. Gut 44, 81 – 86.
10. Schmitz O (2008) The GLP-1 concept in the treatment of type 2 diabetes – still standing at the gate of dawn? J Clin Endo-crinol Metab 93, 375 – 377.
11. Kokrashvili Z, Mosinger B & Margolskee R (2009) T1r3 and alpha-gustducin in gut regulate secretion of glucagon-like peptide-1. Ann N Y Acad Sci 1170, 91 – 94.
12. Rogers P, Carlyle J, Hill A, et al. (1988) Uncoupling sweet taste and calories: comparison of the effects of glucose and three intense sweeteners on hunger and food intake. Physiol Behav 43, 547 – 552.
13. Bellisle F & Drewnowski A (2007) Intense sweeteners, energy intake and the control of body weight. Eur J Clin Nutr 61, 691 – 700.
14. Flint A, Raben A, Blundell JE, et al. (2000) Reproducibility, power and validity of visual analogue scales in assessment of appetite sensations in single test meal studies. Int J Obes Relat Metab Disord 24, 38 – 48.
15. Raben A, Tagliabue A & Astrup A (1995) The reproducibility of subjective appetite scores. Br J Nutr 73, 517 – 530.
British
Journal
of
16. Steinert RE, Poller B, Castelli MC, et al. (2009) Orally admi-nistered glucagon-like peptide-1 affects glucose homeostasis following an oral glucose tolerance test in healthy male sub-jects. Clin Pharmacol Ther 86, 644 – 650.
17. Cummings D & Overduin J (2007) Gastrointestinal regulation of food intake. J Clin Invest 117, 13 – 23.
18. Vilsbøll T, Krarup T, Madsbad S, et al. (2001) No reactive hypoglycaemia in Type 2 diabetic patients after subcu-taneous administration of GLP-1 and intravenous glucose. Diabet Med 18, 144 – 149.
19. le Roux CW, Batterham RL, Aylwin SJ, et al. (2006) Attenu-ated peptide YY release in obese subjects is associAttenu-ated with reduced satiety. Endocrinology 147, 3 – 8.
20. Verdich C, Toubro S, Buemann B, et al. (2001) The role of postprandial releases of insulin and incretin hormones in meal-induced satiety – effect of obesity and weight reduction. Int J Obes Relat Metab Disord 25, 1206 – 1214. 21. Ho¨fer D, Pu¨schel B & Drenckhahn D (1996) Taste
receptor-like cells in the rat gut identified by expression of alpha-gustducin. Proc Natl Acad Sci U S A 93, 6631 – 6634. 22. Rozengurt N, Wu S, Chen M, et al. (2006) Colocalization of
the alpha-subunit of gustducin with PYY and GLP-1 in L cells of human colon. Am J Physiol Gastrointest Liver Physiol 291, G792 – G802.
23. Gregersen S, Jeppesen P, Holst J, et al. (2004) Antihyper-glycemic effects of stevioside in type 2 diabetic subjects. Metabolism 53, 73 – 76.
24. Ma J, Bellon M, Wishart J, et al. (2009) Effect of the artificial sweetener, sucralose, on gastric emptying and incretin hor-mone release in healthy subjects. Am J Physiol Gastrointest Liver Physiol 296, G735 – G739.
25. Mezitis N, Maggio C, Koch P, et al. (1996) Glycemic effect of a single high oral dose of the novel sweetener sucralose in patients with diabetes. Diabetes Care 19, 1004 – 1005. 26. Sutherland K, Young R, Cooper N, et al. (2007) Phenotypic
characterization of taste cells of the mouse small intestine. Am J Physiol Gastrointest Liver Physiol 292, G1420 – G1428. 27. Fujita Y, Wideman R, Speck M, et al. (2009) Incretin release from gut is acutely enhanced by sugar but not by sweeteners in vivo. Am J Physiol Endocrinol Metab 296, E473 – E479.
28. Fushiki T, Kojima A, Imoto T, et al. (1992) An extract of Gym-nema sylvestre leaves and purified gymnemic acid inhibits glucose-stimulated gastric inhibitory peptide secretion in rats. J Nutr 122, 2367 – 2373.
29. Gribble F, Williams L, Simpson A, et al. (2003) A novel glucose-sensing mechanism contributing to glucagon-like
peptide-1 secretion from the GLUTag cell line. Diabetes 52, 1147 – 1154.
30. Ritzel U, Fromme A, Ottleben M, et al. (1997) Release of glucagon-like peptide-1 (GLP-1) by carbohydrates in the perfused rat ileum. Acta Diabetol 34, 18 – 21.
31. Rezek M & Kroeger E (1976) Glucose antimetabolites and hunger (theoretical article). J Nutr 106, 143 – 157.
32. Welle S, Thompson D, Campbell R, et al. (1980) Increased hunger and thirst during glucoprivation in humans. Physiol Behav 25, 397 – 403.
33. Mayer J (1953) Glucostatic mechanism of regulation of food intake. N Engl J Med 249, 13 – 16.
34. Kong M, Chapman I, Goble E, et al. (1999) Effects of oral fructose and glucose on plasma GLP-1 and appetite in normal subjects. Peptides 20, 545 – 551.
35. Shima K, Suda T, Nishimoto K, et al. (1990) Relationship between molecular structures of sugars and their ability to stimulate the release of glucagon-like peptide-1 from canine ileal loops. Acta Endocrinol (Copenh) 123, 464 – 470. 36. Sirinek K, Levine B, O’Dorisio T, et al. (1983) Gastric inhibitory polypeptide (GIP) release by actively transported, structurally similar carbohydrates. Proc Soc Exp Biol Med 173, 379 – 385.
37. Swithers S & Davidson T (2008) A role for sweet taste: calorie predictive relations in energy regulation by rats. Behav Neurosci 122, 161 – 173.
38. Foltin R, Fischman M, Moran T, et al. (1990) Caloric compen-sation for lunches varying in fat and carbohydrate content by humans in a residential laboratory. Am J Clin Nutr 52, 969 – 980.
39. Blundell J & Hill A (1986) Paradoxical effects of an intense sweetener (aspartame) on appetite. Lancet 1, 1092 – 1093. 40. Rogers P & Blundell J (1989) Separating the actions of
sweet-ness and calories: effects of saccharin and carbohydrates on hunger and food intake in human subjects. Physiol Behav 45, 1093 – 1099.
41. Canty D & Chan M (1991) Effects of consumption of caloric vs noncaloric sweet drinks on indices of hunger and food consumption in normal adults. Am J Clin Nutr 53, 1159 – 1164.
42. Rolls B, Kim S & Fedoroff I (1990) Effects of drinks swee-tened with sucrose or aspartame on hunger, thirst and food intake in men. Physiol Behav 48, 19 – 26.
43. Drewnowski A, Massien C, Louis-Sylvestre J, et al. (1994) Comparing the effects of aspartame and sucrose on motiva-tional ratings, taste preferences, and energy intakes in humans. Am J Clin Nutr 59, 338 – 345.