Cerebral Cortex August 2010;20:1878--1890 doi:10.1093/cercor/bhp254
Advance Access publication November 25, 2009
Top-Down Activation of Fusiform Cortex
without Seeing Faces in Prosopagnosia
Ruthger Righart1,2, Fre´de´ric Andersson1, Sophie Schwartz1,3, Euge`ne Mayer4and Patrik Vuilleumier1,2,3
1
Laboratory for Neurology and Imaging of Cognition, Department of Neurosciences and Clinic of Neurology, University of Geneva, 1211 Geneva, Switzerland,2Swiss Center for Affective Sciences, University of Geneva, 1205 Geneva, Switzerland,3Geneva Neuroscience Center, University of Geneva, 1211 Geneva, Switzerland and4Neuropsychology Unit, Department of Neurology, Geneva University Hospital, University of Geneva, 1211 Geneva, Switzerland
Face processing can be modified by bottom-up and top-down influences, but it is unknown how these processes interact in patients with face-recognition impairments (prosopagnosia). We investigated a prosopagnosic with lesions in right occipital and left fusiform cortex but whose right fusiform gyrus is intact and still activated during face-processing tasks. P.S., a patient with a well-established and selective agnosia for faces, was instructed to detect the presence of either faces or houses in pictures with different amounts of noise. The right fusiform face area (FFA) showed reduced responses to face information when visual images were degraded with noise. However, her right FFA still activated to noise-only images when she was instructed to detect faces. These results reveal that fusiform activation is still selectively modulated by task demands related to the anticipation of a face, despite severe face-recognition deficits and the fact that no reliable stimulus-driven response is evoked by actual facial information. Healthy controls showed stimulus-driven responses to faces in fusiform, and in right but not left occipital cortex, suggesting that the latter area alone might provide insufficient facial information in P.S. These results provide a novel account for residual activation of the FFA and underscore the importance of controlling task demands during functional magnetic resonance imaging.
Keywords: face processing, fMRI, fusiform face area, occipital face area, prosopagnosia
Introduction
The brain is amazingly well-tuned to interpret sensory inputs from the visual world, even when not all information is available. When viewing conditions are impoverished, prior knowledge and expectations can support the detection or recognition of faces. For example, if faces are concealed from viewing, a mental representation of the face may facilitate identification (Bruce and Young 1986). Accordingly, top-down processes may interact with bottom-up sensory analysis to guide visual recognition.
The perception of faces activates an area in the lateral fusiform gyrus (Sergent et al. 1992; Haxby et al. 1994; Kanwisher et al. 1997; McCarthy et al. 1997) known as the fusiform face area (FFA) (Kanwisher et al. 1997), and an area in the inferior occipital gyrus (Kanwisher et al. 1997; Haxby et al. 1999; Gauthier et al. 2000) known as the occipital face area (OFA) (Gauthier et al. 2000). These ventral visual areas may have distinct roles in face recognition, although their re-spective contribution is still uncertain (Haxby et al. 2000; Grill-Spector et al. 2004; Rotshtein et al. 2005).
Severe deficits in face recognition, a rare disorder termed ‘‘prosopagnosia,’’ can result from focal damage to extrastriate visual areas occurring after unilateral or bilateral lesions in occipito-temporal cortex (Damasio et al. 1982). The lesions are usually found in the right hemisphere (Whiteley and Warrington 1977; Landis et al. 1986; Sergent and Signoret 1992; Wada and Yamamoto 2001; Barton et al. 2002; Rossion et al. 2003; Farah 2004), predominantly in the right inferior occipital lobe (Bouvier and Engel 2006), although additional lesions in the left hemisphere also are frequently reported (Meadows 1974; Rossion et al. 2003; Steeves et al. 2006). Prosopagnosic patients typically fail at recognizing faces of colleagues, friends, and family members and often use nonfacial cues like clothes, hair, posture, and voice to identify others (Bruce and Young 1986; Sergent and Signoret 1992; Wada and Yamamoto 2001; Farah 2004; Steeves et al. 2006). They also perform poorly on tests that require matching different pictures of unfamiliar faces (Benton and Van Allen 1972; Whiteley and Warrington 1977; Rossion et al. 2003; Steeves et al. 2006), especially when faces are shown in different views (Benton and Van Allen 1972). However, prosopagnosia patients are usually able to tell a face from a nonface object (Damasio et al. 1982; Gauthier et al. 1999; Rossion et al. 2003; Farah, 2004; Schiltz et al. 2006), indicating that they can still extract certain visual cues that are specific to faces.
Consistent with lesion studies showing that prosopagnosia often follows lesions encroaching on the fusiform cortex (Wada and Yamamoto 2001; Barton et al. 2002), some neuro-imaging studies reported a lack of face-selective responses in the fusiform cortex in prosopagnosic patients (Hadjikhani and de Gelder 2002; Bentin et al. 2007). However, strikingly, several other recent studies have reported that some prosopagnosics may not only have a structurally intact fusiform cortex but also show preserved activation to faces in this area during standard functional magnetic resonance imaging (fMRI) paradigms (developmental prosopagnosia: Hasson et al. 2003; Avidan et al. 2005; acquired prosopagnosia: Marotta et al. 2001; Rossion et al. 2003; Steeves et al. 2006). It is however possible that these residual activations may (at least partly) be caused by top-down biases due to anticipation of a face stimulus (Kleinschmidt and Cohen 2006), given that preserved FFA activation has frequently been observed during blocked fMRI designs (e.g., Marotta et al. 2001; Hasson et al. 2003; Rossion et al. 2003). Thus, impairment in the FFA response might be shown when stimuli are seen in randomized and nonpredict-able paradigms (e.g., Schiltz et al. 2006; Dricot et al. 2008). Accordingly, even though normal FFA responses have been shown in prosopagnosia, adaptation effects for repetition of face identity have been shown to be impaired (Schiltz et al.
2006). However, it is unlikely that preserved FFA activation in prosopagnosia can be explained only by differences in task demands, because both passive viewing paradigms (Marotta et al. 2001; Hasson et al. 2003; Steeves et al. 2006) and more active one-back tasks (Rossion et al. 2003) have shown preserved activation.
Here, we investigated whether neural activity in the FFA and/or other visual areas might be modulated by preserved top-down biases due to the instruction to detect a face. We hypothesized that FFA activation may still be observed in prosopagnosia when a face is anticipated but not physically presented. Such top-down biases might be plausible because these patients have an intact representation of facial features and can usually generate mental images of faces (Barton and Cherkasova 2003).
A number of imaging and electroencephalography studies in healthy participants have already shown that visual activations for faces are modulated by top-down factors, that is, preexisting knowledge or expectations (Dolan et al. 1997; Bentin et al. 2002; Cox et al. 2004; Mechelli et al. 2004; Wild and Busey 2004). For example, impoverished pictures of faces that could not be recognized initially were recognized after a learning phase and were accompanied by enhanced activations in the FFA (Dolan et al. 1997; see also George et al. 1999). Even blurred dots without facial cues may enhance FFA activation when they are interpreted as faces, based on the surrounding context (Cox et al. 2004). Thus, FFA activity seems not only dependent on bottom-up processing of the physical stimulus but also on top-down processing (Mechelli et al. 2004; Summerfield et al. 2006). However, a distinction between these 2 factors has not been established in previous imaging studies of prosopagnosia, precluding a better understanding of the functional significance of preserved FFA activation in patients.
An important question is therefore whether the FFA, and perhaps the OFA, is still activated when a face is expected even though facial cues are not actually presented. This can be investigated by adding noise to face images, up to a degree in which noise-only (NO) is present, precluding FFA activation from facial information. Indeed, in healthy participants, significant FFA responses have been found for noise images in which participants anticipated a face (Zhang et al. 2008). Further, faces occluded by an opaque screen still induced as much FFA activation as visible faces, presumably due to the mental representation held in mind during the occlusion (Hulme and Zeki 2007). Taken together, these data suggest that face-selective areas can be reliably activated by preexisting representations of faces even when there are no facial cues in visual input.
In our study, we investigated P.S., a patient with a well-established and selective agnosia for faces, to determine any preserved effects of top-down modulation on the FFA. P.S. has a profound deficit in face recognition, whereas her recognition of nonface objects is preserved even at a subordinate level (Rossion et al. 2003). P.S. shows, despite her face recognition problems, normal FFA activation for faces relative to nonface objects (Rossion et al. 2003; Schiltz et al. 2006; Sorger et al. 2007; Dricot et al. 2008). Because P.S. is deeply aware of her deficit and highly trained to compensate for it, she probably has strong top-down biases in conditions requiring attention to faces.
Here, we used a decision task in which pictures of faces or houses with different amounts of noise were presented in separate blocks along with blocks containing NO images (without any face or house feature). The task demand was
biased by instructions to report either whether a face was present (yes/no) or whether a house was present (yes/no). We chose pictures of houses as a control condition, because a distinct region in the parahippocampal gyrus has been identified for this category (known as the parahippocampal place area [PPA]; Epstein and Kanwisher 1998; Epstein et al. 1999). To examine bottom up (stimulus-driven) processing, activations to high-noise (HN) or low-noise (LN) images, in which faces (or houses) were degraded but still visible, were compared with activations to NO images, in which none of the stimulus cues were present. To investigate top-down (task-dependent) processing, NO images for which instructions required the detection of faces (face-task blocks) were compared with identical noise images for which instructions required the detection of houses (house-task blocks).
We hypothesized that if FFA activation is principally influenced by top-down signals, it should increase equally in all conditions when a face is expected, irrespective of the amount of noise in the stimulus and even when images contain only noise. Conversely, if FFA activation is mainly determined by bottom-up input, it should increase in proportion with image visibility but decrease during NO images. Alternatively, if bottom-up and top-down effects coexist, FFA activation may be not only greater for LN and HN images of faces as compared with NO images, because of increased stimulus-driven inputs, but also greater for NO images when participants need to detect a face compared with a house.
Materials and Methods
Participants
P.S. is a 56-year-old woman (born in 1950, right handed) who sustained a closed head injury in 1992 due to a bus accident. MRI scans have revealed lesions in the lateral part of the occipital and temporal lobes, bilaterally, as well as in the left cerebellum. The right hemisphere lesions extend from the posterior part of the inferior occipital gyrus to the posterior fusiform gyrus. Lesions in the left hemisphere extend from the fusiform gyrus to the lower part of the temporal lobe (Rossion et al. 2003). P.S. has been investigated extensively with neuropsycho-logical tests (Rossion et al. 2003) and functional neuroimaging (Rossion et al. 2003; Schiltz et al. 2006; Sorger et al. 2007; Dricot et al. 2008). She is severely impaired on tasks requiring identification and comparison of individual face identities (see Rossion et al. 2003).
Sixteen normal healthy volunteers (11 females, mean age 27.1 years) were recruited as control participants. One of the subjects was removed because of recording problems. Young participants were tested mainly for practical reasons. It should be noted that there is no evidence for age-related differences of brain activation at least for the areas investigated here (Brodtmann et al. 2003; Schiltz et al. 2006). All participants gave informed consent for participation according to the regulations of the Geneva University Hospital Ethics Committee. The study conformed to the Declaration of Helsinki principles.
Stimuli and Procedure
Photographs of 10 neutral faces and 10 houses were used. Faces were from the Ekman series (Ekman and Friesen 1976). Face and house stimuli had 2 levels of noise added to the original pictures, with either low (Face-LN, House-LN) or high (Face-HN, House-HN) noise levels. Gaussian noise was added to the pictures by using Adobe Photoshop. In addition, we created a set of 10 images that contained NO (with an equal average luminance for faces and houses) and were presented in either a face or house condition (Face-NO, House-NO). Importantly, no face- or house cues were present in the NO stimuli, and they were identical for the face- and house blocks (Fig. 1).
A mixed design was used in order to induce sustained activations due to the task demands, while preventing order effects and predictability of the trials (Donaldson and Buckner 2001). Our main goal was to investigate whether strong expectations of either faces or houses induced by the task demand to detect a face or a house evokes activity in category-selective regions. There were 3 types of blocks that could contain stimuli with LN, HN, or NO. Each block contained either faces or houses with different noise levels, although the order of these blocks was mixed. Each block begun with the task instruction, followed by 6 stimuli presented in a pseudorandomized order. LN blocks contained 4 trials with an LN image and 2 trials with an HN image. HN blocks contained 4 images with a high level of noise and 2 images with complete noise. NO blocks contained 6 trials of complete noise images. Thus, the NO blocks allowed us to probe for top-down effects on brain activation because neural responses in this condition were solely based on the expectations of the particular stimulus category while the visual
input was in fact identical (NO images) in both conditions. All stimuli were presented centrally for 2000 ms, with an interstimulus interval jittered between 2000 and 3500 ms.
The 3 block types (low-, high-, and noise-only) occurred in 2 different task conditions. In the face blocks, images with either degraded faces (HN or LN) or NO were presented, and subjects were asked whether or not a face was present, whereas in the house blocks, images with either degraded houses (HN or LN) or NO were presented, and subjects were asked whether or not a house was present. Critically, blocks with NO images contained identical stimuli and differed only by task demands. These 6 types of active blocks alternated with 6 baseline blocks, during which subjects were asked to fixate a fixation cross. fMRI Scanning
The MRI data were acquired on a 3.0-T Siemens Trio Tim whole-body scanner of the Lemanic Center for Biomedical Imaging (CIBM) at Geneva University Hospital. For anatomical images, a T1-weighted sequence was used (time repetition [TR]/time echo [TE]: 2200 ms/3.45 ms). For functional images, a T2*-weighted gradient echo sequence was used (TR/TE: 2200 ms/30 ms/field of view=235 mm). Thirty-six slices were acquired (descending) in each volume. Three hundred and thirty volumes were acquired in each session.
Each set of functional images was realigned to the first functional volume (Friston et al. 1995). A mean image was created using the realigned volumes, to which the structural images were coregistered. The functional images were corrected for slice timing (to the 18th reference slice) and spatially normalized to the Montreal Neurological Institute (MNI) template provided in SPM2 (resampled to a voxel size of 3 mm). Coordinates are reported in Talairach space after a nonlinear transformation from MNI space was applied (Brett et al. 2002). For P.S., analyses were performed on both nonnormalized and normalized data to allow comparison with healthy control participants. MRI data were carefully matched for potential differences that may result from normalizing lesioned brains (Ashburner and Friston 2007). Activation patterns were similar for nonnormalized and normalized images. Smoothing was performed using a Gaussian filter set at 8-mm full width at half maximum. A high-pass filter of 128 s was applied, and serial autocorrelation between scans was used. Functional images of the control group were projected on the anatomy of a single subject. Statistical Analyses
Behavioral data were analyzed to assess identification performance using repeated-measures analysis of variance (ANOVA) on the probability of responding ‘‘yes’’ for faces or houses during blocks with LN, HN, and NO stimuli. Response times (RTs) were analyzed for all trials in each block type as the distribution of yes/no responses differed across blocks. Greenhouse--Geisser epsilon was applied to correct for degrees of freedom when the assumption of sphericity was not met. Behavioral data from 5 healthy subjects were lost because of recording problems. The probability of correct responses and RTs of P.S. were compared with the control group by converting her data into z-scores using the mean and standard deviation of the control group. The cutoff for normal performance was set at z=–1.65, which is equal to the lowest 5% of the control group (Howell 2002). In addition, statistical significance was confirmed with the modified t-test of Crawford and Howell (1998).
Statistical analyses of brain-imaging data were performed by using the general linear model implemented in SPM2 (www.fil.ion.ucl.ac.uk/ spm). Face blocks and house blocks of different noise levels were modeled as epochs by separate regressors and convolved with a canonical hemodynamic response function. Movement parameters (3 translation directions and 3 rotations) were determined from the realignment corrections and entered as regressors of no interest.
Statistical parametric maps were generated from linear contrast between conditions for each participant. A second-level random-effects analysis was performed for the healthy control participants using one-sample t-tests on the contrast images. Whole-brain analyses were performed to identify activations related to bottom-up processing for faces (Face-LN>Face-NO; Face-HN >Face-NO) or houses (House-LN> House-NO; House-HN >House-NO) and related to top-down processing for faces (Face-NO >House-NO) or houses (House-NO > Face-NO). Bottom-up effects were analyzed separately for LN and HN images to Figure 1. Experimental paradigm. Stimuli were images with LN, HN, and NO. LN and
HN stimuli could display either faces or houses. (A) The LN and HN faces as well as NO stimuli were shown in face blocks (top row); (B) the LN and HN houses as well as NO stimuli were shown in house blocks (bottom row). In face blocks, participants were instructed to indicate whether a face was present or not. In house blocks, participants were instructed to indicate whether a house was present or not. Critically, NO stimuli were identical for face and house blocks (i.e., with NO). Images with LN and HN were compared with NO to investigate bottom-up activation driven by veridical visual features, for both faces and houses. Images with NO were compared between face blocks and house blocks to determine top-down effects.
analyze the unique effects and to be sure that the effects would not be biased by one of the noise levels. An exclusive mask of results from the control group with a liberal threshold (P < 0.5) was computed to determine brain areas where P.S. showed larger activations as compared with the control group and was used for the critical comparisons of NO images (Face-NO>House-NO and House-NO >Face-NO). P values are reported for peak voxels and are uncorrected for multiple comparisons. To further test for differential effects due to task or stimulus factors, regions of interest (ROIs) were determined from individual data to take into account interindividual differences in the location of the FFA (Kanwisher et al. 1997; Rossion et al. 2003), OFA (Gauthier et al. 2000; Rossion et al. 2003), and PPA (Epstein and Kanwisher 1998). Our design allowed us to define ROIs using an internal localizer (see Friston et al. 2006; Saxe et al. 2006). Contrasts were performed between faces and houses (Face >House) to determine the left and right FFAs and the left and right OFAs and between houses and faces (House > Face), to determine the right PPA for each subject separately. To ensure that any potential response differences to NO images were not due to a selection bias, we used all task conditions to determine the FFA and PPA (Haxby et al. 1999). Due to different signal-to-noise ratios in individual participants, we used a variable threshold (ranging between P <0.05 and P < 0.00001) to define ROIs in different subjects. In addition, to confirm activations previously observed in P.S., an auxiliary face localizer was performed for her, which contrasted a series of faces with a series of scenes. This localizer revealed significant activations in the right fusiform gyrus (39,–62,–12) and left inferior occipital gyrus (–42,–79,–6), consistent with the results reported by Rossion et al. (2003), Schiltz et al. (2006), and Sorger et al. (2007). Parameter estimates of neural activity (beta values) were extracted for each condition using the ROI cluster defined for each subject and were then mean corrected and normalized by dividing by the standard deviation across conditions to allow for direct comparisons between individual subjects.
Bottom-up responses were analyzed by planned t-tests measuring activations to stimuli with veridical face information in FFA and OFA (Face-LN >Face-NO; Face-HN >Face-NO) and stimuli with veridical house information in PPA (House-LN>House-NO; House-HN> House-NO). Top-down effects were analyzed by planned t-tests measuring activations to NO images in the FFA and OFA when participants had to report faces (Face-NO >House-NO) and in the PPA when participants had to report houses (House-NO>Face-NO). For comparisons with the control group, beta values of P.S. were converted to z-scores using a cutoff of z=1.65 (one-tailed) to test the a priori hypothesis that she would present deficits in bottom-up processing and z=1.96 (2-tailed) to test whether top-down processing was preserved. Modified t-tests were also reported for these comparisons (Crawford and Howell 1998). Results
Behavior
Identification Accuracy
Probabilities for responding that a face or house was present were computed for each condition and analyzed using a 233 repeated-measures ANOVA with Stimulus category (Face,
House) and Noise level (LN, HN, and NO) as factors. Both healthy control participants and P.S. were highly accurate in indicating that a face/house was present in LN and HN images (yes responses) and that it was not present in NO images (‘‘no’’ responses). A main effect was found for stimulus category, F1,10=8.01, P <0.05 as the probability of reporting a face was slightly higher than reporting a house across all 3 image types. A main effect was also found for Noise level, F2,20 = 143.14, P<0.001, as the probability of reporting a face or a house was significantly higher for LN than HN images, t10=2.24, P <0.05 and for the latter conditions compared with the NO condition, t10=13.07, P <0.001 and t10=13.36, P <0.001, respectively. No significant interaction was found between Stimulus category and Noise level, F1.25;12.53=1.37, P >0.05. P.S. showed a similar profile as the control group, all z <1.65 (Table 1).
Response Times
Latencies of correct responses were analyzed using a 2 3 3 repeated-measures ANOVA as aforementioned. An interaction between Stimulus Category and Noise was found, F1.42;14.21= 7.21, P <0.05, due to shorter RTs to faces than houses with LN levels, t10 = 2.44, P < 0.05 but longer RTs in the face compared with the house condition for NO, t10=3.43, P <0.01.
Differences between faces (mean = 810 ms) and houses
(mean = 865 ms) with HN levels were not significant, t10 = 1.33, P=0.21.
P.S. showed longer RTs than the control group for all conditions, but her responses were significantly different only during Face-HN (z= 2.30, t10=2.20, P < 0.05) and marginally different during the Face-NO condition (z=1.73, P <0.05; t10= 1.66, P >0.05). These behavioral data indicate that P.S. needed more time to decide whether a face was presented in HN or NO images, consistent with her prosopagnosia (although this difference might also be partly accounted for by the age difference between P.S. and controls). Nevertheless, despite her deficit, she performed the task accurately and was still able to report when a face was presented or not, without any abnormal response biases.
fMRI: Whole-Brain Analyses
Faces
Significant activations for the main contrasts of interest are reported in Table 2 and Figure 2. Comparing all face blocks with all house blocks (main effect of category-specific re-sponse, Face >House) demonstrated a large significant cluster comprised of 2 nearby peaks (Table 2) in the right fusiform gyrus in the control group (Fig. 2B), along with significant
Table 1 Behavioral results
Face-LN Face-HN Face-NO House-LN House-HN House-NO
Probability Control group 0.92 (0.16) 0.90 (0.11) 0.14 (0.32) 0.89 (0.15) 0.72 (0.24) 0.04 (0.11) P.S. 1.00 0.97 0.02 1.00 0.89 0.04 z 5 0.53, t105 0.51 z 5 0.60, t105 0.57 z 5 0.36, t105 0.35 z 5 0.73, t105 0.70 z 5 0.68, t105 0.65 z 5 0, t105 0 RTs Control group 650 (123) 810 (163) 909 (182) 711 (124) 865 (184) 854 (195) P.S. 776 1186 1225 787 992 1082 z 51.02, t105 0.98 z 5 2.30*, t105 2.20 z 5 1.73, t105 1.66 z 5 0.61, t105 0.59 z 5 0.69, t105 0.68 z 5 1.17, s105 1.12
Note: Probability of a yes response (i.e., reporting that the task-relevant stimulus is present in the image) and RTs (in milliseconds) to faces and houses, for LN, HN, and NO conditions. Z-scores and modified t-test statistics for P.S. are displayed, *indicates a significant difference (Z [ 1.96). P.S. and control participants were similarly accurate in detecting faces/houses in LN and HN images and made only a few false alarms in the NO conditions. As expected, RTs were longer, for HN and NO images, especially for P.S. Standard deviations of the control group are in parentheses.
activation in the right inferior occipital gyrus. Both regions have frequently been reported in neuroimaging studies of face recognition (Haxby et al. 2000). A significant response of the right fusiform gyrus to faces also was seen in P.S., just anterior to her lesion in the right inferior occipital gyrus (Fig. 2A). This replicates previous results in the same patient (Rossion et al. 2003; Schiltz et al. 2006; Sorger et al. 2007; Dricot et al. 2008). To examine bottom-up activation to faces, blocks containing faces with LN and HN were compared with blocks containing NO images (Face-LN >Face-NO and Face-HN >Face-NO). For the RFX (random effects) analysis in controls, a significant cluster was found for LN images in the right fusiform gyrus (45,–70,–4; Z=4.40, k=112 voxels, P <0.001), and a similar cluster was observed (36,–73,–12; Z=4.98, k=350 voxels, P < 0.001) for HN images. In addition, and consistent with the main effect reported above, we observed a second more anterior peak in the right fusiform gyrus for both LN images (39,–42,–21; Z=4.55, P <0.001) and HN images (34,–44,–26; Z=4.35, P < 0.001), together with an activation in the left inferior occipital cortex for LN images (–45,–73,–4; Z=4.05, k=51 voxels, P < 0.001), and in the left fusiform gyrus for HN images (–30,–56,–16; Z = 3.87, k =54 voxels, P < 0.000). For P.S., only LN images elicited a weak activation in the right fusiform gyrus (36,–59,–12; Table 2
Whole-brain analysis
Face [ House Side Area Coordinate Z Score
P.S. Right Fusiform gyrus 39, 62, 12 5.13
Left Frontal superior medial gyrus 12, 64, 8 5.45 Left Anterior cingulate gyrus 6, 44, 9 4.96
Left Middle temporal gyrus 50, 63, 17 4.51
Control group Left Fusiform gyrus 42, 64, 7 3.24
Right Fusiform gyrus 42, 47, 13 3.42
42, 59, 10 3.65 Right Inferior occipital gyrus 39, 82, 6 3.28
Left Orbitofrontal cortex 6, 25, 16 3.70
Left Inferior parietal gyrus 59, 39, 38 3.96
Left Amygdala 27, 2, 18 3.36
House [ Face
P.S. Left Superior occipital gyrus 18, 91, 35 3.28
Right Cuneus 15, 86, 24 3.17 *
Control group Left Parahippocampal gyrus 27, 53, 10 2.97 *
Right Parahippocampal gyrus 30, 41, 8 2.87 *
Right Precuneus 27, 51, 22 3.55
Left Lingual gyrus 18, 78, 4 3.24
Right Lingual gyrus 27, 67, 1 3.11
Right Cuneus 12, 98, 16 2.88 *
Note: Regions significantly activated for the Face [ House and House [ Face contrast are reported. Peak coordinates with P \ 0.001 (uncorrected) are reported, except for * indicating P \ 0.01. Note that for the Face [ House contrast in the control group, 2 peaks were found in the right fusiform cortex. Coordinates are reported in Talairach space.
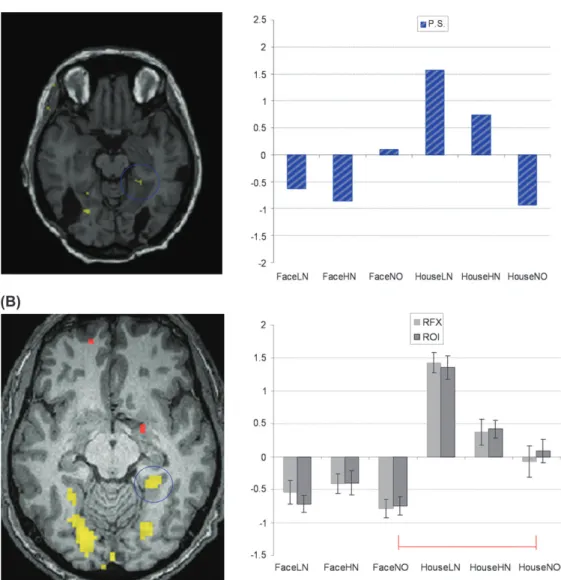
Figure 2. Activation of the right fusiform gyrus. (A) In P.S., the Face [ House contrast (all conditions collapsed) shows a significant cluster just anterior to the lesion in the right inferior occipital gyrus. The Face-NO [ House-NO shows a significant cluster that overlaps with the Face [ House cluster. Both contrasts are shown at threshold P \ 0.001, superimposed on the nonnormalized T1-weighted MRI of P.S. The barplot shows average beta values for each condition. (B) In healthy participants, the Face [ House contrast (random-effects analysis) shows a significant cluster in the right fusiform gyrus. The Face-NO [ House-NO contrast also reveals a similar fusiform activation. Both contrasts are shown with P \ 0.01 for illustration purpose, superimposed on a T1-weighted MRI of one subject. The barplot shows average beta values extracted from the cluster defined by RFX Analysis and from individual ROIs. In both P.S. and controls, the FFA is significantly activated by the task instruction to detect a face while NO images are shown. FFA activation was also significantly larger for Face-NO than House-NO when individual differences were taken into account by the individual ROI analysis.
Z=2.42, k=32 voxels, P <0.01), whereas HN images revealed no significant fusiform activation, even when using a very liberal threshold of P <0.05, suggesting that the FFA of P.S. was poorly responsive to veridical facial information.
Next, to determine top-down effects, blocks with NO images during which participants were instructed to detect a face versus a house, that is, conditions were compared with the exact same visual inputs (Face-NO >House-NO). In controls, the group RFX analysis showed activation in the right fusiform gyrus (39,–47,–13; Z = 2.77, k = 17 voxels, P < 0.01) that
overlapped with the main category-selective response
(Fig. 2B). For P.S., a similar activation was also found in the right fusiform gyrus (Z=3.88, k=91 voxels, P <0.001), which also overlapped with her response in the fusiform gyrus observed in the Face >House contrast (Fig. 2A). These results show that FFA activity was biased by top-down influences, due
to the task demands of detecting a face, without any visual face information being present in the image. Critically, such influences were still preserved in P.S.
In addition to the fusiform gyrus, our analysis of top-down effects (Face-NO >House-NO) revealed a strong activation in the precuneus for P.S. (Fig. 4A) when she had to detect faces in these images (0,–56,36; Z=4.49, P=0.001). This effect was not observed in control participants and remained highly signifi-cant when we directly compared P.S. with the control group using an exclusive mask of the same contrast from the control group (with a liberal P value to rule out any similar trend, Face-NO >House-NO, P <0.5; Fig. 4B).
Houses
Significant activations for the main contrasts of interest are reported in Table 2 and Figure 3. Comparing all house blocks to
Figure 3. Activation of the right parahippocampal gyrus. (A) In P.S., the House [ Face contrast showed no significant activation at conventional threshold, although a small cluster was observed at P 5 0.10. No clusters were found for the House-NO [ Face-NO contrast. The barplot shows beta values for each condition with a similar profile for nonnormalized and MNI normalized data. (B) In healthy control participants, the House [ Face contrast (random effects analysis) shows a significant cluster in the right parahippocampal gyrus. The barplot shows beta values extracted from a cluster that was defined by RFX Analysis and from individual ROIs. Although no activation is seen for the House-NO [ Face-NO contrast in the RFX group data, a significantly larger activation for House-NO than Face-NO was demonstrated by the individual ROI analyses.
all face blocks in the control group (main category-specific effect House > Face) showed activations in precuneus and cuneus, lingual gyri, and parahippocampal gyrus (Table 2). For P.S., significant responses were found in the superior occipital gyrus and cuneus (Table 2), but there was no differential increase of activation in the parahippocampal gyrus (even at a threshold of P = 0.05). Activations in the same parieto-occipital regions have previously been reported in response to house stimuli (Bentley et al. 2003; Committeri et al. 2004).
Our analysis of bottom-up responses to houses revealed a large cluster for House-LN >House-NO (k=321) and
House-HN > House-NO (k = 160) with peaks in the right medial
fusiform gyrus (33,–59,–17; Z=5.12, P <0.001; 28,–50,–24; Z= 3.47, P <0.01, respectively) and right parahippocampal gyrus (30,–41,–8; Z=4.43, P <0.001; 23,–41,–16; Z=3.12, P <0.001, respectively) for control participants. Increases were also observed in the left medial fusiform gyrus for LN (–30,–51,–9; Z=4.42, P <0.001) and HN images (–25,–67,–22; Z=2.50, P < 0.01). For P.S., bottom-up responses to houses in LN and HN images (House-LN >House-NO; House-HN >House-NO) were also observed in the medial fusiform gyrus (33,–54,–9; Z=2.95, P <0.01; 31,–50,–24; Z=2.95, P <0.01), precuneus (6,–65,36; Z=3.56, P <0.001; 10,–41,27; Z=4.17, P<0.001 respectively), left superior occipital gyrus (–24,–92,29; Z = 3.67, P < 0.001; –14,–90,8; Z=3.01, P <0.001 respectively), and right superior occipital gyrus (33,–86,29; Z=4.45, P <0.001; 20,–94,11; Z= 2.43, P <0.01 respectively).
Finally, when testing for top-down effects due to the house detection task (House-NO >Face-NO), we found no significant cluster along the ventral visual cortical areas in neither the control participants nor in P.S. (but see below for significant results based on individual ROI analyses).
fMRI: ROI Analyses
To take individual differences in functional anatomy into account, we performed additional analyses using an ROI approach and further examined both bottom-up and top-down effects in predefined regions that responded to faces (FFA and OFA) or houses (PPA) in each participant (Friston et al. 2006; Saxe et al. 2006).
FFA
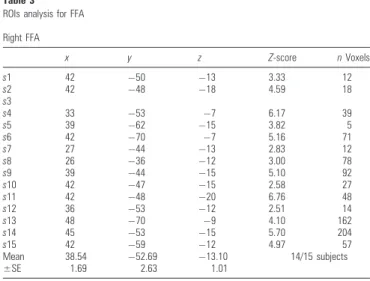
An activation cluster corresponding to the right FFA (Face > House) was found for 14/15 subjects from the control group. The average coordinates of these individually defined peaks (38,–53,–13) are consistent with previous studies using ROI analyses for individual subjects (Kanwisher et al. 1997; Rossion et al. 2003) (see Table 3).
Repeated-measures ANOVA was performed on beta values extracted from these individual FFA ROIs with the factors Stimulus category (Face, House) and Noise level (LN, HN, and NO). This confirmed a significant main effect of Stimulus category, F1,13 = 257.68, P < 0.001, in that the right FFA re-sponses were higher in face blocks than house blocks. There was also a significant main effect for Noise level, F2,26=35.41, P < 0.001, which was qualified by a significant interaction between stimulus category and noise level, F1.80;23.40=3.64, P< 0.05, reflecting a different impact of noise for FFA responses to faces and houses. Differences were significant between all noise levels for face and house images but not between low- and HN levels for face images (Fig. 2B).
Our planned analysis of bottom-up effects in the control group (Table 4) confirmed that activations were significantly higher for faces with LN compared with NO (Face-LN > Face-NO), as well as for faces with HN compared with NO (Face-HN > Face-NO). Top-down effects (Face-NO > House-NO) were also highly significant in control participants, with stronger activation to blocks of NO images when they had to report a face, relative to blocks when they saw the same images but had to report a house (mean difference =0.91, standard error [SE]=0.16).
Like controls, P.S. showed a reliable activation in the right fusiform gyrus for face blocks as compared with house blocks (as already described in the previous section, see Fig. 2A). Moreover, the fusiform cluster identified by this Face >House contrast in our main experiment was exactly overlapping with the right FFA location as determined in P.S. by a separate face-localizer scan (39,–62,–12; see Materials and Methods) using a different set of stimuli. Bottom-up and top-down effects in her right FFA were converted to z-scores for comparison with
Table 3 ROIs analysis for FFA Right FFA x y z Z-score n Voxels s1 42 50 13 3.33 12 s2 42 48 18 4.59 18 s3 s4 33 53 7 6.17 39 s5 39 62 15 3.82 5 s6 42 70 7 5.16 71 s7 27 44 13 2.83 12 s8 26 36 12 3.00 78 s9 39 44 15 5.10 92 s10 42 47 15 2.58 27 s11 42 48 20 6.76 48 s12 36 53 12 2.51 14 s13 48 70 9 4.10 162 s14 45 53 15 5.70 204 s15 42 59 12 4.97 57 Mean 38.54 52.69 13.10 14/15 subjects ±SE 1.69 2.63 1.01
Note: Coordinates of the FFA were defined for each participant in the control group by using the main contrast Face [ House. Coordinates are reported in Talairach space.
Table 4
Statistical results of ROI analysis of control participants
Left FFA Right FFA
Bottom-up effects
Face-LN versus Face-NO t65 4.63, P\ 0.01 t135 7.70, P\ 0.001
Face-HN versus Face-NO t65 3.53, P\ 0.05 t135 5.71, P\ 0.001
Top-down effects
Face-NO verss House-NO t65 3.52, P\ 0.05 t135 5.80, P\ 0.001
Left OFA Right OFA
Bottom-up effects
Face-LN versus Face-NO t85 0.95, P[ 0.05 t85 2.66, P\ 0.05
Face-HN versus Face-NO t85 0.91, P[ 0.05 t85 2.10, P 5 0.07
Top-down effects
Face-NO versus House-NO t85 8.76, P\ 0.01 t85 3.48, P\ 0.01
Left PPA Right PPA
Bottom-up effects
House-LN versus House-NO t95 3.76, P\ 0.01 t95 5.17, P\ 0.001
House-HN versus House-NO t95 0.87, P[ 0.05 t95 1.21, P[ 0.05
Top-down effects
House-NO versus Face-NO t95 2.95, P\ 0.05 t95 3.37, P\ 0.01
control participants. For bottom-up effects, small increases were observed in P.S. for LN relative to NO images (Fig. 2A), but the difference for Face-LN minus Face-NO was below that of the control group (z = –0.94, P > 0.05, t = –0.90, P > 0.05). Furthermore, unlike in normals, there was virtually no difference between Face-HN and Face-NO (z = –1.47, P < 0.10, t = –1.42, P > 0.10). To examine whether these effects were specific for faces, bottom-up effects for faces were also compared with houses (i.e., Face-HN–Face-NO vs. House-HN– House-NO). This comparison showed a marked difference for P.S. relative to the control group (z <–3, P <0.01; t <–3, P < 0.01), suggesting a lack of bottom-up stimulus-driven responses to faces but not houses in P.S. (Fig. 2).
By contrast, top-down influences were clearly preserved, with a much higher activation of the right FFA to NO images during face blocks than during house blocks (see above and Fig. 2A). This differential activation (Face-NO minus House-NO) was even numerically larger in P.S. as compared with the mean activation for the control group, z=2.03, P <0.05; t= 1.97, P >0.05 (2-tailed). Furthermore, we also compared the magnitude of top-down activation in P.S. with the magnitude of stimulus-driven activation (Face-LN and Face-HN) in control participants. Strikingly, this comparison showed that the top-down activation in FFA for P.S. (Face-NO -- House-NO) was in the range of the bottom-up activations in the control group (same magnitude of increase as for Face-LN–Face-NO: z=1.06, P >0.05; t=1.02, P >0.05; and Face-HN -- Face-NO: z=1.50, P>0.05; t=1.44, P >0.05). (We thank one of the reviewers for suggesting this analysis.)
Altogether, these data confirm that FFA activation in P.S. was strongly modulated by the task demands to detect a face despite physically identical noise images with no facial cues (i.e., in Face-NO vs. House-Face-NO conditions), whereas the FFA was poorly modulated by actual face inputs when these were presented in impoverished images (i.e., in Face-HN vs. Face-NO conditions). Analyses were centered on the right FFA to test our hypothesis on functional activity in the intact right FFA of P.S. A smaller proportion of subjects (7/15) also showed a response to faces in the left FFA [which is damaged in P.S.], as in previous studies [(Kanwisher et al. 1997; Gauthier et al. 2000; Rossion et al. 2003]. ANOVA on left FFA activity also disclosed a main effect of Stimulus, F1,6=324.15, P <0.001, reflecting larger responses to faces than houses, but the main effect of Noise, F1.91;11.44= 2.91, P=0.10 and the interaction between Stimulus and Noise, F1.64;9.84= 3.46, P=0.08, did not reach significance. However, bottom-up effects showed significantly larger responses to Face-LN than Face-NO, and to Face-HN than Face-NO. Top-down effects also produced larger increases to NO images in the Face-NO than House-Face-NO condition, that is, when subjects were instructed to detect a face [mean difference=0.72, SE=0.20] [Table 3].
Finally, because the FFA identified by the Face > House contrast showed peak coordinates that were rather posterior in P.S. (39,–62,–12) as compared with the average peak of the control group (39,–53,–13; Table 3), we also examined whether our results in the control group may differ between subjects who have a relatively anterior FFA as opposed to a relatively posterior FFA. Note that our random-effects analysis in control participants showed that the fusiform cluster activated by faces had 2 nearby peak coordinates (see above). Therefore, we separated the individual ROIs of controls into one group (N= 7) in which subjects had a rather anterior location of the FFA
(average coordinates: 37,–45,–15) and another group (N=7) in which the FFA had a more posterior location (average coordinates: 40,–60,–11). The peak coordinates of the FFA for P.S. were roughly similar to the group with the posterior location. However, similar results were obtained when activa-tions in P.S. were compared with the activation of the posterior group, because P.S. exhibited relatively smaller responses in the LN and HN stimuli but relatively larger responses to NO stimuli in the face task, unlike the pattern found for both anterior and posterior fusiform peaks in controls (see Supplementary Fig. 5).
OFA
A region corresponding to the right OFA (which is damaged in P.S) could be found for 9/15 subjects in the control group. The average coordinates (39,–81,–4) were consistent with previous studies reporting ROI analyses for this region in individual subjects (Gauthier et al. 2000; Rossion et al. 2003).
Repeated-measures ANOVA on extracted beta values
showed a main effect of Stimulus category (F1,8= 85.30, P < 0.001), with OFA activity higher in face blocks than house Figure 4. Functional images of precuneus activation. (A) The Face-NO [ House-NO contrast for P.S. shows significant activation in the precuneus, together with posterior and anterior cingulate cortex (k [ 20 voxels, P \ 0.001). (B). After applying an exclusive mask from the same contrast in the control group, the precuneus cluster is still observed, even when using a very liberal P value for the group contrast (Face-NO [ House-(Face-NO, P \ 0.5, to rule out any weak but similar trend in controls).
blocks, and a main effect of Noise level (F1.21;9.69= 6.03, P < 0.05) with greater response to LN conditions than to HN (t8=2.43, P<0.05) and NO conditions (t8=2.66, P <0.05). No significant interaction was found between Stimulus category and Noise level (F1.85;14.77 = 1.61, P = 0.23). Our planned analyses not only confirmed significant bottom-up effects (Face-LN >Face-NO and Face-HN >Face-NO), with activations higher for LN and HN faces relative to NO images, but also demonstrated significant top-down effects (Face-NO > House-NO), with stronger neural responses when subjects were instructed to detect a face versus a house in NO images (mean difference=0.92, SE=0.21) (Table 4).
The left OFA could be observed in 9/15 of the control participants, with average coordinates (–38,–84,–5) that were consistent with previous studies. Repeated-measures ANOVA on beta values from the left OFA again showed a main effect of Stimulus category, F1,8=271.09, P <0.001, in that OFA activity was increased for faces as compared with houses. However, the main effect of Noise, F1.42;11.35 = 2.16, P = 0.17, and the interaction between Stimulus and Noise, F1.27;10.16=0.95, P > 0.05, were not significant, unlike results for the right OFA. This pattern may suggest that mainly the right OFA is directly involved in bottom-up processing of face information. Accord-ingly, we found no significant bottom-up effects (Face-LN > Face-NO and Face-HN >Face-NO) in the left OFA of control participants, unlike the effects observed in the right OFA (see above). However, there was a significant top-down effect (Face-NO >House-NO), demonstrated by stronger responses when subjects had to detect a face as compared with a house in NO images (mean difference=1.39, SE=0.12) (Table 4).
In P.S., the right OFA was damaged and could not be analyzed, but her left OFA was shown to be intact and still activated by faces in a previous study (Sorger et al. 2007). Here, although we could not reliably identify the left OFA in the category-selective contrast of our main experiment (category-selective contrast
Face > House, see Table 2), we were able to define an
appropriate functional ROI (–42,–79,–6) based on the external face localizer (see Materials and Methods). Data from the intact left OFA in P.S. showed a similar pattern as in control participants: No significant bottom-up effects were observed for LN images (z=–1.33, P>0.05; t=–1.26, P>0.05) and HN images of faces (z= 0.12, P >0.05; t=0.11, P >0.05) relative to NO; whereas top-down effects were preserved and produced significantly higher activity to NO images during face blocks than during house blocks, but this increase was not significantly different from the control group (z=1.71, P>0.05; t=1.62, P >0.05).
PPA
A region corresponding to the right PPA (House >Face) could be identified for 10/15 subjects, whose average coordinates (27,–47,–4) accorded with previous studies (Epstein and Kanwisher 1998; Epstein et al. 1999).
Repeated-measures ANOVA on the beta values from in-dividual PPA ROIs showed a main effect of Stimulus category, F1,9=310.53, P <0.001, with higher response to houses than faces and a main effect of Noise level, F2,18=8.30, P <0.01, with higher activation to LN than both HN, t9=2.35, P <0.05, and NO images, t9 = 4.21, P < 0.01, but no significant difference between HN and NO, t9=1.73, P=0.11. In addition, a significant interaction was observed in the PPA between Stimulus category and Noise level, F1.59;14.34=5.23, P <0.05, explained by higher
activations for LN compared with HN and house-NO, t9=3.16, P <0.05 and t9=5.17, P <0.001, respectively, but no such difference for face-LN compared with face-HN and face-NO (both t9 <0.94, P >0.37). These results indicate that the noise level affected bottom-up processing for houses in the PPA but not for faces (Fig. 3B).
Indeed, bottom-up effects produced significantly higher activations in the PPA for LN houses than NO images but not for HN as compared with NO images. Top-down effects (House-NO >Face-NO) also enhanced activation significantly in the PPA when participants were instructed to report houses rather than faces (mean difference=0.72, SE=0.21). The latter results thus reveal that the PPA activation was also modified by task demands, despite physically identical images in House-NO and Face-NO blocks (Table 4).
No reliable activation could be found in PPA for P.S. by using standard whole-brain contrasts (see above). A much more liberal threshold of P=0.10 allowed the identification of a small house-specific cluster closely located to the PPA coordinates of the control group (27,–42,–12). We then extracted beta values from this region to examine activation across different conditions in P.S. These data showed increased responses to houses with LN (z=1.22, P >0.05; t=1.16, P >0.05) and HN relative to NO images (z =1.09, P >0.05; t=1.04, P >1.04). However, top-down effects for the House-NO relative to Face-NO conditions were absent for P.S. (z=–2.21, P<0.05; t=–2.11, P >0.05 (see Fig. 3A).
Discussion
To our knowledge, our study is the first to investigate top-down effects of task demands on visual processing in a patient with prosopagnosia compared with healthy participants. We tested whether selective top-down biases could still arise in prosopag-nosia patient P.S. who has damage to the right inferior occipital cortex and left fusiform cortex but preserved activation in the right fusiform cortex. Yet, this residual fusiform activation is apparently insufficient to afford normal face recognition. We predicted that activation in the FFA might still be biased by the instructions to detect a face (Summerfield et al. 2006; Zhang et al. 2008), despite a lack or reduction of sensory input related to facial cues—as confirmed by our fMRI results.
Our major finding is that NO images, in the absence of any bottom-up visual input of facial information, evoked significant activation in the FFA when visual processing was biased by the instruction to look for faces, both in healthy controls and, more critically, in P.S. No such activation was found in the FFA when the exact same NO images were presented with the direction to report houses. These results demonstrate for the first time that top-down signals may act on the visual cortex in a selective manner and modulate face-specific areas despite severe deficits in face recognition. This suggests that FFA activity does not only code for bottom-up visual information but also generates internal representations based on information from higher-level areas when a face is anticipated.
A second important finding was a significant bottom-up effect that was observed in the right OFA for the control group but not the left OFA. This asymmetry is consistent with a predominance of the right hemisphere in face processing (Haxby et al. 2000). Like controls, P.S. showed no bottom-up response in the intact left OFA. Remarkably, however, the right OFA was damaged in P.S., in keeping with several other
prosopagnosia patients (Gru¨sser and Landis 1991; Wada and Yamamoto 2001; Bouvier and Engel 2006). Hence, the lack of reliable stimulus-driven activation in the intact left OFA, together with damage to the right OFA in P.S., might deprive higher-level stages along the ventral temporal cortex (e.g., fusiform) from sufficient facial information for accurate identification and thus may partly account for prosopagnosia.
The FFA activation to faces in our study is consistent with previous investigations in P.S. (Rossion et al. 2003; Schiltz et al. 2006; Sorger et al. 2007; Dricot et al. 2008), as well as with findings demonstrating that the FFA may still show selective increases to faces despite face recognition deficits in patients with developmental (Hasson et al. 2003; Avidan et al. 2005; Van den Stock et al. 2008) and acquired prosopagnosia (Marotta et al. 2001; Steeves et al. 2006). Several authors have suggested that the FFA might have a primary role in face detection or categorization (Kanwisher et al. 1998; Haxby et al. 1999; Grill-Spector et al. 2004), as well as an important role in encoding finer visual information about face identity in participants with normal face recognition (Gauthier et al. 2000; Eger et al. 2004; Grill-Spector et al. 2004; Pourtois et al. 2005; Rotshtein et al. 2005). Our data thus confirm that the FFA may not only be responsible for perceptual encoding the visual features of faces but may also be implicated in anticipating faces or generating templates of faces.
As expected, the FFA activation was larger for both LN images and HN images of faces as compared with NO images in control participants. In sharp contrast, P.S. did not show a reliable increase in FFA activation to HN images of faces, as compared with NO images, suggesting no stimulus-driven (bottom-up) responses to these impoverished face stimuli. This differed significantly from responses to houses, for which bottom-up information could still activate the fusiform cortex to some degree, as previously reported for other nonface objects in prosopagnosia (see Bentin et al. 2007). This indicates that facial information did not effectively modulate FFA activity when visual images were impoverished by HN levels. Alterna-tively, the right FFA might still activate to both downstream and upstream information, but with reduced responses to visual stimuli overall, resulting in the absence of significant differ-ences between HN and NO stimuli. We thank one of the reviewers for this suggestion.
Behaviorally, P.S. also showed longer RTs for reporting faces in HN, which was consistent with her difficulties processing poor visual information from these stimuli and reduced FFA responses to HN faces. Degradation of visual images by noise is expected to impair both perception and attention (Abrams and Law 2002), especially for agnosia patients of the apperceptive type (Campion and Latto 1985). Thus, added noise was more detrimental to visual recognition in P.S. than in normal subjects, which is commensurate with absent (or weak) bottom-up responses in right FFA to HN (or LN) face images (respec-tively). In addition, HN images might also disrupt the grouping of local visual cues face into a face gestalt (Vecera and Gilds 1998; Farah 2004), which might further contribute to a slow-down of RTs and decreased FFA response in P.S. Moreover, previous imaging studies in prosopagnosia have typically used high-quality images to investigate face processing. Here, in contrast, by using degraded images with different noise levels, our study shows how the response of the FFA is dependent on stimulus-driven processing and how it is impaired in prosopagnosia.
The most critical result of this study is the preserved FFA response in P.S. when she was asked to report faces (instead of houses), even when only physical noise was present (just as found in healthy controls). Importantly, P.S. correctly reported (like control participants) that no face was present in this condition (cf. Zhang et al. 2008). This result reveals for the first time that top-down influences due to task demands were sufficient to activate the FFA despite severe prosopagnosia and despite the fact that a residual activation of the FFA did not seem sufficient to mediate face recognition.
We surmise that several top-down factors could potentially be responsible for inducing face-related activation in FFA. First, our instruction to detect a face may have promoted mental imagery processes that facilitate the detection of faces and houses. Visual imagery may lower the threshold for detecting faces and objects and thus help recognition when viewing conditions are compromised (Kosslyn 1994). This may be a strategy employed by prosopagnosia patients when anticipating a face, particularly when they are highly aware of their deficits (like P.S.). In fact, visual imagery is often intact in prosopagnosia, for both objects (Rossion et al. 2003) and faces (Barton and Cherkasova 2003; but see also Young et al. 1994). Instructions to imagine a certain stimulus category may evoke similar activation profiles com-pared with actual perceptual inputs from a physical image (Kosslyn 1994). Accordingly, it has been shown that imagery for faces may activate the FFA (Ishai et al. 2000; O’Craven and Kanwisher 2000; Mechelli et al. 2004), whereas imagery for scenes may activate the PPA (O’Craven and Kanwisher 2000) or regions in the medial fusiform gyrus partly overlapping with the PPA (Ishai et al. 2000).
In agreement with a role for visual imagery, our whole-brain analyses of P.S. revealed a strong activation in the precuneus during face blocks relative to house blocks, a region that has previously been reported by several studies on visual imagery (Fletcher et al. 1995; Ishai et al. 2000; Mechelli et al. 2004; see for a review Cavanna and Trimble 2006). The precuneus has been suggested to play a crucial role in reconstructing a visual image in the ‘‘mind’s eye’’ (Fletcher et al. 1995; Dolan et al. 1997). Significant activation of the precuneus was found only in P.S., no such trend was observed in controls. In addition, similar increases were found in the posterior cingulate and medial prefrontal cortex, which both have direct connections with the precuneus (Cavanna and Trimble 2006). Accordingly, these regions may play a crucial role in imagery for faces and could have been activated additionally in P.S. to help her perform accurately under the most difficult task condition, when only physical noise was presented.
It should be noted, however, that we observed top-down effects in the FFA of P.S when faces were anticipated, but no such effect in the PPA when houses were anticipated. This differs from the pattern observed in control participants, for whom we found both stimulus-driven (bottom-up) and task-related (top-down) effects in the parahippocampal cortex. Top-down effects in the right PPA were observed in 8/10 subjects. The reason why it was not observed in P.S. cannot be categorically explained. It is possible that this paradoxical lack of house-selective responses in P.S. may reflect the fact that her prosopagnosia led to a compensatory recruitment of ‘‘object-related’’ areas in parahippocampal and/or medial fusiform cortex areas for processing faces, as shown in normal subjects when they are presented with inverted faces (Haxby et al. 1999). Such abnormal recruitment during both the house and
face tasks may mask any difference when contrasting houses to faces. Other factors that could potentially explain these effects is that houses may constitute a less homogeneous category than faces, and may therefore be more difficult to generate in patients with prosopagnosia, or that the PPA is not actually a ‘‘house’’ region but rather a ‘‘place’’ area coding spatial layouts of scenes rather than house features (see Epstein et al. 1999). The present findings have important implications for interpreting previous observations of preserved FFA activation in prosopagnosia and for the design of future experiments in such patients. The role of top-down effects might have been overlooked in the past. A number of previous studies have used blocked-design fMRI (e.g., Marotta et al. 2001; Hasson et al. 2003; Rossion et al. 2003) in which top-down effects could have played an important role. Because prosopagnosic patients are fully aware of their difficulties and still discriminate faces from other visual categories, their expectations and task-related demands might be sufficient to increase fusiform activity due to top-down influences, despite impaired process-ing of facial information.
Our work illustrates how the combined results from neuropsychology and functional imaging in patients can help to better understand the role of FFA, OFA, and other extrastriate functional areas in normal face recognition and impaired face recognition like prosopagnosia. Although a structurally intact FFA can still provide a general category-selective representation of faces and can be modified by top-down based expectancies (as shown by the present study), a disconnection of visual inputs to and from the right OFA may disrupt the building of finer representations corresponding to individual face identities. The fact that right FFA is preserved in P.S. may help to direct attention to faces or imagery processes when faces are expected, but it may not be sufficient to sustain accurate face identification without bottom-up visual inputs from the right OFA, as already suggested previously (Schiltz et al. 2006). In P.S., neither the right inferior occipital cortex (because of lesions in this area) nor the left occipital cortex (because of low responses to LN images) could provide the visual input for successful face recognition. The results in the control participants confirm that the right OFA is mainly involved in bottom-up processing, and it is unlikely that the left OFA may fulfill this function after damage of the right inferior occipital cortex. Our findings therefore provide new insights into the possible contribution of the FFA and OFA in face recognition and the possible consequences of their damage. However, it is also possible that the FFA may still support some other functions in prosopagnosia, because recognition of facial expression and age decision are often preserved in these patients (although such abilities were also moderately impaired in P.S., see Rossion et al. 2003). In P.S., the FFA was also found to be normally modulated by facial expressions (Peelen et al. 2009), presumably reflecting top-down influences from the amygdala (Amaral and Price 1984; Vuilleumier et al. 2004). Future studies should clarify the role of the FFA and top-down mechanisms in these processes.
Our data indicate that normal activation of the FFA does not necessarily imply normal bottom-up processing of the detailed facial information likely to be necessary for identity recogni-tion. In keeping with this, recent fMRI studies found impaired adaptation of the FFA in P.S. during repetition of face identity (Schiltz et al. 2006; Dricot et al. 2008), which is different from the normal decrease of FFA responses to repeated presenta-tions of the same face in healthy participants (Henson et al.
2000; Vuilleumier et al. 2002; Pourtois et al. 2005; reviewed by Grill-Spector et al. 2006). Moreover, normal activations found in previous studies (Rossion et al. 2003; Steeves et al. 2006) in spite of impaired perception are reminiscent of V1 activation observed in patients with macular degeneration (Baker et al. 2005), which can be apparent when subjects engage in perceptual judgments (Masuda et al. 2008).
In sum, our results do not only yield important novel insights into the role of FFA and OFA in face recognition and the possible mechanisms of prosopagnosia disorders but also suggest important methodological constraints for interpreting functional imaging experiments. First, by showing that FFA activations may be introduced by task demands only, our findings call for very careful designing of future fMRI studies in normal subjects and patients. Second, by showing that FFA may show abnormal bottom-up responses to facial information content in images, our study also suggests that concomitant damage to right OFA can impair visual inputs to subsequent processing stages in structurally intact regions within the fusiform cortex and higher-level cortical areas.
Supplementary Material
Supplementary material can be found at: http://www.cercor. oxfordjournals.org.
Funding
National Center of Competence in Research (NCCR) for Affective Sciences and the Swiss National Science Foundation (51NF40-104897).
Notes
In memory of our deceased colleague Euge`ne Mayer. We thank Gilles Pourtois, Karim N’Diaye, and Pascal Vrticˇka for support with the fMRI analysis and Bronwyn Glaser for suggestions on the manuscript. We thank Francxois Lazeyras and the CIBM for MRI acquisition, and Roberto
Caldara and Bruno Rossion for sharing information about P.S. We are grateful to P.S. for her collaboration and to 2 anonymous reviewers for their helpful comments on the manuscript. Conflict of Interest : None declared.
Address correspondence to Ruthger Righart, Laboratory for Neurol-ogy and Imaging of Cognition, Department of Neuroscience and Swiss Center for Affective Sciences, University of Geneva, 7 Rue des Battoirs, CH-1211 Geneva, Switzerland. Email: [email protected].
References
Abrams RA, Law MB. 2002. Random visual noise impairs object-based attention. Exp Brain Res. 142:349--353.
Amaral DG, Price JL. 1984. Amygdalo-cortical projections in the monkey (Macaca fascicularis). J Comp Neurol. 230:465--496. Ashburner J, Friston K. 2007. Nonlinear registration. In: Friston K,
editor. Statistical parametric mapping. New York: Academic Press. Avidan G, Hasson U, Malach R, Behrmann M. 2005. Detailed exploration
of face-related processing in congenital prosopagnosia: 2. Func-tional neuroimaging findings. J Cogn Neurosci. 17:1150--1167. Baker CI, Peli E, Knouf N, Kanwisher NG. 2005. Reorganization of visual
processing in macular degeneration. J Neurosci. 25:614--618. Barton JJS, Cherkasova M. 2003. Face imagery and its relation to
perception and covert recognition in prosopagnosia. Neurology. 61:220--225.
Barton JJS, Press DZ, Keenan JP, O’Connor M. 2002. Lesions of the fusiform face area impair perception of facial configurations in prosopagnosia. Neurology. 58:71--78.
Bentin S, DeGutis JM, D’Esposito M, Robertson LC. 2007. Too many trees to see the forest: performance, event-related potential, and
functional magnetic resonance imaging manifestations of integrative congenital prosopagnosia. J Cogn Neurosci. 19:132--146.
Bentin S, Sagiv N, Mecklinger A, Friederici A, von Cramon YD. 2002. Priming visual face-processing mechanisms: electrophysiological evidence. Psychol Sci. 13:190--193.
Bentley P, Vuilleumier P, Thiel CM, Driver J, Dolan RJ. 2003. Cholinergic enhancement modulates neural correlates of selective attention and emotional processing. Neuroimage. 20:58--70.
Benton AL, Van Allen MW. 1972. Prosopagnosia and facial discrimina-tion. J Neurol Sci. 15:167--172.
Bouvier SE, Engel SA. 2006. Behavioral deficits and cortical damage loci in cerebral achromatopsia. Cereb Cortex. 16:183--191.
Brett M, Johnsrude IS, Owen AM. 2002. The problem of functional localization in the human brain. Nat Rev Neurosci. 3:243--249. Brodtmann A, Puce A, Syngeniotis A, Darby D, Donnan G. 2003. The
functional magnetic resonance imaging hemodynamic response to faces remains stable until the ninth decade. Neuroimage. 20:520--528.
Bruce V, Young A. 1986. Understanding face recognition. Br J Psychol. 77:305--327.
Campion J, Latto R. 1985. Apperceptive agnosia due to carbon monoxide poisoning: an interpretation based on critical band masking from disseminated lesions. Behav Brain Res. 15:227--240. Cavanna AE, Trimble MR. 2006. The precuneus: a review of its
functional anatomy and behavioural correlates. Brain. 129:564--583. Committeri G, Galati G, Paradis A-L, Pizzamiglio L, Berthoz A, LeBihan D. 2004. Reference frames for spatial cognition: different brain areas are involved in viewer-, object-, and landmark-centered judgments about location. J Cogn Neurosci. 16:1517--1535.
Cox D, Meyers E, Sinha P. 2004. Contextually evoked object-specific responses in human visual cortex. Science. 304:115--117.
Crawford JR, Howell DC. 1998. Comparing an individual’s test score against norms derived from small samples. Clin Neuropsychol. 12:482--486.
Damasio AR, Damasio H, Van Hoesen GW. 1982. Prosopagnosia: anatomic basis and behavioral mechanisms. Neurology. 32:331--341. Dolan RJ, Fink GR, Rolls E, Booth M, Holmes A, Frackowiak RS, Friston KJ. 1997. How the brain learns to see objects and faces in an impoverished context. Nature. 389:596--599.
Donaldson DI, Buckner RL. 2001. Effective paradigm design. In: Matthews PM, Jezzard P, Evans AC, editors. Functional magnetic resonance imaging of the brain: methods for neuroscience. Oxford, UK: Oxford University Press.
Dricot L, Sorger B, Schiltz C, Goebel R, Rossion B. 2008. The roles of ‘‘face’’ and ‘‘non-face’’ areas during individual face perception: evidence by fMRI adaptation in a brain-damaged prosopagnosic patient. Neuroimage. 40:318--332.
Eger E, Schyns PG, Kleinschmidt A. 2004. Scale invariant adaptation in fusiform face-responsive regions. Neuroimage. 22:232--242. Ekman P, Friesen WV. 1976. Pictures of facial affect. Palo Alto (CA):
Consulting Psychologists Press.
Epstein R, Harris A, Stanley D, Kanwisher N. 1999. The parahippocam-pal place area: recognition, navigation, or encoding? Neuron. 23:115--125.
Epstein R, Kanwisher N. 1998. A cortical representation of the local visual environment. Nature. 392:598--601.
Farah MJ. 2004. Visual agnosia. 2nd ed. Cambridge (MA): MIT Press. Fletcher PC, Frith CD, Baker SC, Shallice T, Frackowiak RSJ, Dolan RJ.
1995. The mind’s eye—precuneus activation in memory-related imagery. Neuroimage. 2:195--200.
Friston KJ, Ashburner J, Frith CD, Poline JB, Heather JD, Frackowiak RSJ. 1995. Spatial registration and normalization of images. Hum Brain Mapp. 2:165--189.
Friston KJ, Rotshtein P, Geng JJ, Sterzer P, Henson RN. 2006. A critique of functional localisers. Neuroimage. 30:1077--1087.
Gauthier I, Behrmann M, Tarr MJ. 1999. Can face recognition really be dissociated from object recognition. J Cogn Neurosci. 11: 349--370.
Gauthier I, Tarr MJ, Moylan J, Skudlarski P, Gore JC, Anderson A. 2000. The fusiform ‘‘face area’’ is part of a network that processes faces at the individual level. J Cogn Neurosci. 12:495--504.
George N, Dolan RJ, Fink GR, Baylis GC, Russell C, Driver J. 1999. Contrast polarity and face recognition in the human fusiform gyrus. Nat Neurosci. 2:574--580.
Grill-Spector K, Henson R, Martin A. 2006. Repetition and the brain: neural models of stimulus-specific effects. Trends Cogn Sci. 10:14--23. Grill-Spector K, Knouf N, Kanwisher N. 2004. The fusiform face area subserves face perception, not generic within-category identifica-tion. Nat Neurosci. 7:555--562.
Gru¨sser OJ, Landis T. 1991. Visual agnosias and other disturbances of visual perception. London: Macmillan Press.
Hadjikhani N, de Gelder B. 2002. Neural basis of prosopagnosia: an fMRI study. Hum Brain Mapp. 16:176--182.
Hasson U, Avidan G, Deouell LY, Bentin S, Malach R. 2003. Face-selective activation in a congenital prosopagnosic subject. J Cogn Neurosci. 15:419--431.
Haxby JV, Hoffmann EA, Gobbini MI. 2000. The distributed human neural system for face perception. Trends Cogn Sci. 4:223--233. Haxby JV, Horwitz B, Ungerleider LG, Maisog JM, Pietrini P, Grady CL.
1994. The functional organization of human extrastriate cortex: a PET-rCBF study of selective attention to faces and locations. J Neurosci. 14:6336--6353.
Haxby JV, Ungerleider LG, Clark VP, Schouten JL, Hoffmann EA, Martin A. 1999. The effect of face inversion on activity in human neural systems for face and object perception. Neuron. 22:189--199. Henson R, Shallice T, Dolan R. 2000. Neuroimaging evidence for dissociable forms of repetition priming. Science. 287:1269--1272. Howell DC. 2002. Statistical methods for psychology. 5th ed. Pacific
Grove (CA): Duxbury.
Hulme OJ, Zeki S. 2007. The sightless view: neural correlates of occluded objects. Cereb Cortex. 17:1197--1205.
Ishai A, Ungerleider LG, Haxby J. 2000. Distributed neural systems for the generation of visual images. Neuron. 28:979--990.
Kanwisher N, McDermott J, Chun MM. 1997. The fusiform face area: a module in human extrastriate cortex specialized for face perception. J Neurosci. 17:4302--4311.
Kanwisher N, Tong F, Nakayama K. 1998. The effect of face inversion on the human fusiform face area. Cognition. 68:B1--B11.
Kleinschmidt A, Cohen L. 2006. The neural bases of prosopagnosia and pure alexia: recent insights from functional neuroimaging. Curr Opin Neurol. 19:386--391.
Kosslyn S. 1994. Image and brain. The resolution of the imagery debate. Cambridge (MA): MIT Press.
Landis T, Cummings JL, Christen L, Bogen JE, Imhof HG. 1986. Are unilateral right posterior cerebral lesions sufficient to cause prosopagnosia? Clinical and radiological findings in six additional patients. Cortex. 22:243--252.
Meadows JC. 1974. The anatomical basis of prosopagnosia. J Neurol Neurosurg Psych. 37:489--501.
Marotta JJ, Genovese CR, Behrmann M. 2001. A functional MRI study of face recognition in patients with prosopagnosia. NeuroReport. 12:1581--1587.
Masuda Y, Dumoulin SO, Nakadomari S, Wandell BA. 2008. V1 projection zone signals in human macular degeneration depend on task, not stimulus. Cereb Cortex. 18:2483--2493.
McCarthy G, Puce A, Gore JC, Allison T. 1997. Face-specific processing in the human fusiform gyrus. J Cogn Neurosci. 9:605--610. Mechelli A, Price CJ, Friston KJ, Ishai A. 2004. Where bottom-up meets
top-down: neuronal interactions during perception. Cereb Cortex. 14:1256--1265.
O’Craven KM, Kanwisher N. 2000. Mental imagery of faces and places activates corresponding stimulus-specific brain regions. J Cogn Neurosci. 12:1013--1023.
Peelen MV, Lucas N, Mayer E, Vuilleumier P. 2009. Emotional attention in acquired prosopagnosia. Soc Cogn Affect Neurosci. 4:268--277. Pourtois G, Schwartz S, Seghier ML, Lazeyras F, Vuilleumier P. 2005.
Portraits or people? Distinct representations of face identity in the human visual cortex. J Cogn Neurosci. 17:1043--1057.
Rossion B, Caldara R, Seghier M, Schuller A-M, Lazeyras F, Mayer E. 2003. A network of occipito-temporal face-sensitive areas besides the right middle fusiform gyrus is necessary for normal face processing. Brain. 126:2381--2395.