Original article
Changed trends of cancer mortality in the elderly
2,4
F. Levi,
1F. Lucchini,
1E. Negri,
2P. Boyle
3& C. LaVecchia
1 Unite d'Epidemiologie du Cancer and Registres Vaudois et Neuchdtelois des Tumeurs, Inslilut Unirersitaire tie Medecine Sociale et Preventive Lausanne, Switzerland, 2Istituto di Ricerche Farmacologiche 'Mario Negri', Milano, 3Division of Epidemiology and Biostatistics, European Institute of Oncology, Milano, 4Istiluto di Stalistica Medica e Biometna. Universita degli Studi di Milano, Milano. Italy
Summary
Background: Trends in cancer mortality for the elderly have
long been unfavourable.
Materials and methods: Mortality from 12 major cancer
sites, plus total cancer mortality at age 65-84 in 23 European countries, the US and Japan was analyzed.
Results: Between the late 1980s and the late 1990s total
cancer mortality at age 65 to 84 has been declining in the European Union (UE) (-5.5% in males. - 4 . 5 % in females), in United States (US) males (-2.3%), but not females (+4.4%), and in Japanese females (-5.6%), but not males (+6.3%). Cancer mortality in the elderly rose for both sexes in eastern Europe. Gastric cancer mortality declined in all the areas. Lung cancer rates declined over the last decade by 8.5% in males in the EU, and by 0.9% in the US. Rates were still increasing in eastern Europe, in Japanese males and in females in all areas. Pancreatic mortality rates were increasing in both sexes in the EU and Japan up to the late 1980s, and in eastern
Europe up to the 1990s, whereas rates for US males have been declining over recent years. Breast cancer mortality has declined over the last decade by 8% in the US and by 3%. in the EU, while it has risen in eastern Europe and in Japan. Mortality from breast and prostate as well as ovarian cancer remained however low in elderly Japanese. Prostate cancer mortality declined in the EU and in the US. whereas it rose in eastern Europe and in Japan. Mortality from lymphomas and multiple myeloma rose in both sexes and various geographic areas, but improved diagnosis and certification may have played a role in these trends. Mortality from leukemia in the elderly increased in eastern Europe and Japan, but was stable in the US and the EU.
Conclusions: Cancer mortality in the elderly has stopped
systematically rising, and is on the decline in males since the late 1980s.
Key words: cancer, elderly, age, mortality, lime-trends
From the late 1970s onwards, some decline in cancer mortality has been reported in the United States (US) [1-4] and western Europe [5-7]. However, trends in the elderly population up to the early 1990s tended systemati-cally to be less favourable [8-11]. This may be due to a different cohort pattern of cancer mortality across various generations and hence age groups [12], to more substantial changes in diagnosis and certification accu-racy of the elderly [11, 13], to a lower impact of earlier diagnosis and improved treatment in the elderly [14, 15], or to a contribution of various factors.
It is therefore important that recent trends in cancer mortality in the elderly are monitored. Along this line, we considered the mortality rate from cancers at 12 major sites up to 1998, plus the total cancer mortality rate at age 65-84 in Europe, the US and Japan.
Materials and methods
Official death certification numbers for 23 European countries (the 15 countries of the European Union, plus eight others, but excluding
Albania and a few countries such as Andorra on Lichtenstein with a population of < 1 million, the US and Japan were derived from the World Health Organization (WHO) database. During the period considered (1960-1998), three different Revisions of the International Classification of Diseases (ICD) were used [16-18]. The classification of cancer deaths were thus re-coded, for the entire period, according to the Ninth Revision (ICD-9 [17]) Data were considered for total cancer mortality, plus the specific data for 12 cancers which have specific relevance for the elderly (i.e. mouth or pharynx, stomach, intestines, pancreas, lung, female breast, ovary, prostate, kidney. non-Hodgkin's lymphomas. multiple myeloma, and leukemias). To improve compara-bility of data throughout different countries and periods, we pooled together all intestinal sites including rectum.
In graphical form, trends are presented for the European Union, including Austria. Belgium. Denmark, Finland, France. Germany. Greece. Ireland. Italy. Luxembourg. The Netherlands. Portugal. Spain. Sweden, and the United Kingdom, six eastern European countries providing meaningful and comparable data since 1960 (Bulgaria. Czech Republic. Hungary. Poland, Romania and Slovakia), the US and Japan.
Estimates of the resident population, generally based on official censuses, were obtained from ihe same WHO databank. From the matrices of certified deaths and resident populations, age-specific rates for each five-year age group considered (65-69 to 80-84) and period were computed. Age-standardized rates were based on the world standard population [19].
Results
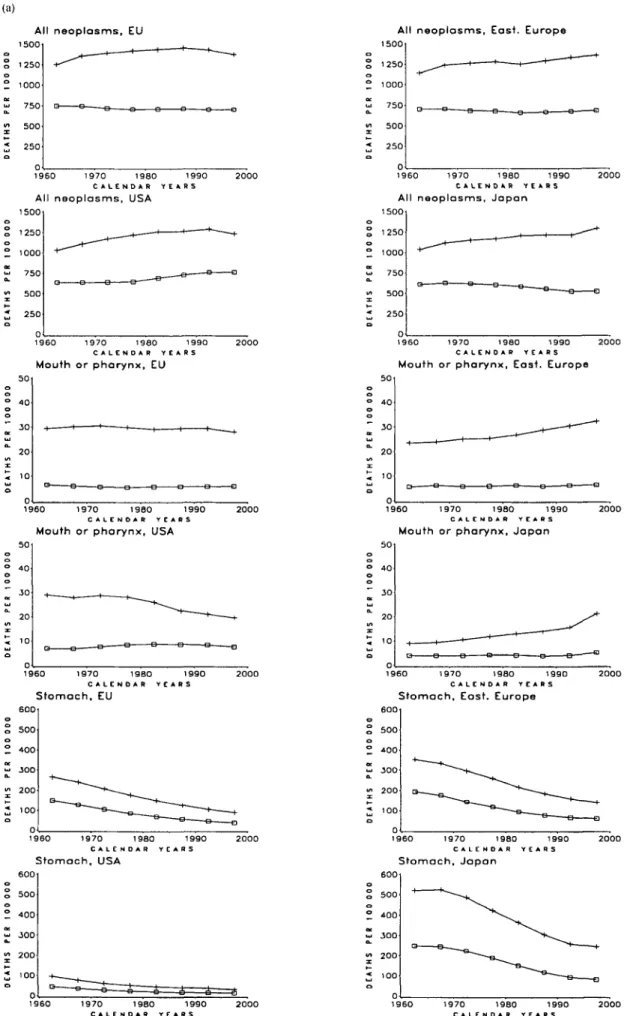
Figure 1 indicates the trends in age-standardized
mortal-ity at age 65 to 84 from all cancers and those occurring
at the 12 selected cancer sites in the EU, eastern
Euro-pean countries, the US and Japan over the period 1960—
1997. Most of the following comments, however, refer to
the trends observed over the last decade, i.e. between
1985-1989 and 1995-1998.
After earlier increases, total cancer mortality at age
65 to 84 has been declining in the EU (from 1457 of
100,000 in 1985-1989 to 1378/100,000 males in
1995-1998, -5.5%; from 712 to 690/100,000 females, -4.5%),
in US males (from 1266 to 1237, -2.3%), but not females
(from 732 to 764, +4.4%), and in Japanese females (from
557 to 526/100,000, -5.6%), but not males (from 1218 to
1295, +6.3%). Cancer mortality in the elderly rose for
both sexes in eastern Europe (from 1294 to 1359 for
males, +5.1%; from 669 to 688 for females, +2.7%).
Oral cancer mortality in the elderly was approximately
stable in the EU, with rates around 30/100,000 males
and 5/100,000 females. Rates steadily rose for males in
eastern Europe, to reach 32/100,000 in the late 1990s. In
the US, rates have been moving downwards for males
since the late 1970s, and moderately upwards for females
up to the late 1990s. An appreciable rise was observed
for Japanese males over the last few years.
Gastric cancer mortality steadily declined in all the
areas considered, and the fall was proportionally larger
in the EU (about 30% in both sexes) as compared to
eastern Europe (23%), the US (-19% in males, -17% in
females) or Japan (-19% in males, - 3 1 % in females).
Rates in Japan, moreover, were six to eight times higher
than in the US, whereas those in Europe were
inter-mediate.
Colorectal cancer rates in the elderly, after earlier
increases, declined over the last decade in both sexes in
the EU (-11% for males, - 2 0 % for females), and the US
(-16% for males, - 1 8 % for females), but rose in eastern
Europe (+16% in males; +4% in females), and in Japan,
mostly in males (+23% for males, +4% for females). In
1995-1998 intestinal cancer rates for Japanese males
(135/100,000) were higher than in the US (124/100,000),
while the rate in the EU was 152/100,000, and that in
eastern Europe 175/100,000.
Pancreatic cancer mortality rose in the elderly of both
sexes in the EU and Japan up to the late 1980s and
levelled off thereafter - at higher levels (70/100,000) for
males in Japan. Rates have been moving steadily
up-wards for both sexes in eastern Europe, and moderately
upwards in women, but downwards in males in the
USA.
After substantial rises between 1960 and 1985, lung
cancer rates at age 65 to 84 for the first time declined
over the last decade, by 8.5% in males in the EU, and by
0.9% in the US. Rates were still increasing in eastern
European (+6%) and Japanese males (+12%) and in
females in all areas (+16% in the EU, +24% in eastern
Europe, +36% in the US, but only +1.2% in Japan).
While in elderly men the differences in lung cancer rates
across broad geographic areas were relatively limited, in
women an approximately three-fold difference was still
evident between the rates of 67-77/100,000 in Japan and
Europe, and the rates of 212/100,000 in the US.
Again after earlier rises in most areas, breast cancer
mortality in women aged 65 to 84 declined by 8% in the
US and by 3% in the EU, to reach 106/100,000 in both
areas, while rose from 80 to 90/100,000 in eastern
Europe, and from 19 to 24/100,000 in Japan.
Ovarian cancer mortality in elderly women has been
steadily increasing both in the EU and in eastern
Euro-pean countries. Trends tended in contrast to level off in
the US and Japan over the last few years, although
mortality rates were higher in the USA and much lower
in Japan.
Prostate cancer mortality in males aged 65 to 84
declined by 4% in the EU and 6% in the US, to reach
the same value of 149/100,000 for both areas. In eastern
Europe, prostate cancer mortality rose from 113 to 127/
100,000 (+13%). In Japan, prostate cancer mortality
started from appreciably lower levels and over the last
decade rose by 33%, from 36 to 48/100,000.
Kidney cancer mortality in the elderly of both sexes
steadily and appreciably increased in all geographic
areas considered. Absolute rates, however, were
con-siderably higher in Europe, and particularly eastern
Europe (48.4/100,000 males, 23.1/100,000 females),
than in the USA and, for the most part, in Japan.
Mortality from non-Hodgkin's lymphoma in the
elderly showed an upward trend in all the geographic
areas considered, although the absolute rates were
dif-ferent and the presence of major changes in the slopes
suggests that the criteria of diagnosis and classification
for this heterogeneous group of neoplasms have
prob-ably changed over time. In the late 1990s, absolute rates
were higher in the US (47/100,000 males, 33/100,000
females) than in the EU (31/100,000), and even lower in
Japan and eastern Europe.
Mortality from multiple myeloma at age 65 to 84
steadily rose by 10% to 20% in both sexes in all
geo-graphic areas considered.
Up to the last few years, mortality from leukemia in
the elderly tended to rise in Japan and eastern Europe,
but has become relatively stable, although at high values
(45/100,000 males; 20/100,000 females) in the EU and
the USA (around 45/100,000 males; 23/100,000 females).
Some indication of a reversal in the trends has become
apparent in the EU in recent years.
Tables 1 (for males) and 2 (for females) give the
mortality rates from total cancer mortality and six
major cancer sites in 21 European countries (data were
not available for Belgium after 1994, and Luxembourg
was not included due to low absolute numbers), and
additionally for the US and Japan. Declines, though to
a different degree, were observed in France, Germany,
Italy and the UK for total cancer mortality in both sexes,
whereas rates were upwards in most eastern European
countries, and showed no consistent pattern in Spain,
(a) All neoplasms, EU 1500 12S0 1000 750 500 250 1960 1970 1980 1990 2000 C A L E N D A R YEARS
All neoplasms, USA
1500 1250 1000 750 500 250 0 1960 Mouth or pharynx, EU 1 9 7 0 1 9 8 0 1 9 9 0 C A L E N D A R Y E A R S I960 1970 1980 1990 Mouth or pharynx, USA
50 40 30 20 1 0 e — — B B s -960 1 9 7 0 1 9 S 0 1 9 9 0 C A L E N D A R Y E A R S Stomach, EU 600 o o 500 o Z 400 w 300 £ 200 1960 1970 Stomach, USA 1990 « s 600 500 400 300 200 100 1960 1 9 7 0 1 9 8 0 1 9 9 0 C A L E N D A R Y E A R S
All neoplasms, East. Europe 1500 1250 1000 750 500 250 1 9 6 0 1 9 7 0 1 9 8 0 1 9 9 0 C A L E N D A R Y E A R S
All neoplasms, Japan
1500 1250 1000 750 500 250 1960 1970 1980 1990 2000 CALENDAR YEARS
Mouth or pharynx, East. Europe
I960 1970 1980 1990 C A L E N D A R Y E A R S
Mouth or pharynx, Japan
50 40 30 20 10 I 9 6 0 1970 1980 1990 2000 CALENDAR YEARS
Stomach, Eost. Europe
600 500 400 300 200 ioo 0 1960 1970 1980 Stomach, Japan 600 S 500 Z 400 £ 300 "i 200 x < 100 1970 1980 1990 CALENDAR YEARS
Figure I Trends in age-standardized (at age 65 to 84. world standard) death certification rates per 100.000 population from selected cancers or
(b) Intestines, EU I 9 6 0 1970 1980 1990 C A L E N D A R r t » R S Intestines, USA o 150 1 9 6 0 1 9 7 0 1 9 8 0 1 9 9 0 C A L E N D A R T E A R S Pancreas, EU 1960 1970 Pancreas, USA 1980 1990 i RS 50 1960 1970 1980 1990 C A L E N D A R YEARS Lung, EU 500 400 300 200 100 1960 1970 19B0 1990 C A L E N D A R YEARS Lung. USA 500 400 300 200 100 1970 1980 1990 C A L E N D A R Y E A R S
Intestines, East. Europe
9 6 0 1 9 7 0 1 9 8 0 1 9 9 0 C A L E N D A R Y E A R S Intestines, Japan 1 5 0 1 9 7 0 1 9 8 0 1 9 9 0 C A L E N D A R Y E A R S
Pancreas, East. Europe
t 25 9 6 0 1 9 7 0 1 9 8 0 1 9 9 0 C A L E N D A R Y E A R S Pancreas, Japan 75 £ 25 1960 1970 19B0 C A L E N D A R •
Lung, East. Europe 500 400 300 200 100 1990 k R S 1960 1970 1980 1990 2000 C A L E N D A R YEARS Lung. Japan 500 400 300 200 100 Figure I Continued.
(c)
Breast, EU Breast, East. Europe
t 50 1960 1970 19B0 1990 C A L E N D A R YEARS Breast, USA 200 t 50 1960 1970 1980 1990 CALENDAR YEARS Ovary, EU I 9 6 0 1970 1980 1990 C A L E N D A R YEARS Ovary, USA 50 40 30 20 10 1960 1970 1980 1990 C A L E N D A R YCARS Prostate, EU 200 1960 1970 1980 1990 C A L E N D A R YEARS Prostate, USA 200 1 5 0 i 50 I960 1970 1980 1990 CALENOAR YEARS Breast, Japan o 1960
Ovary, East. Europe
1970 1980 1990 C A L E N D A R YEARS 50 o " 40 o "~ 50 a. 20 < 10 )60 1970 1980 1990 C A L E N D A R YEARS Ovary, Japan )60 1970 1980 1990 C A L E N D A R YCARS
Prostate, East. Europe
I 9 6 0 1970 19B0 1990 C A L E N D A R YEARS Prostate, J a p a n S 50 1970 1980 1990 C A L E N D A R YEARS Figure 1. Continued.
(d) ' K i d n e y , EU 1 9 6 0 1 9 7 0 1 9 8 0 1 9 9 0 C A L E N D A R Y C A R S Kidney, USA 50 4 0 JO 20 10 50 40 30 20 10 1970 1980 1990 RS
Non —Hodgkin's lymphomas, EU
1960 1970 1980 1990 2000 C A L E N D A R YEARS
Non —Hodgkin's lymphomas, USA
50 40 30 20 10 1990 RS Multiple myeloma, EU )60 1970 1980
Multiple myeloma, USA
Kidney, East. Europe
I 9 6 0 1970 1980 1990 2000 C A L E N D A R YEARS Kidney, Japan 50 40 30 20 10 960 1970 1980 1990 2000 C A L E N D A R YEARS
Non —Hodgkin's lymphomas, East. Europe
50 40 30 20 10 )60 1970 1980 1990 200 C A L E N D A R YEARS
Non —Hodgkin's lymphomas, Japan
960 1 9 7 0 1 9 8 0 1 9 9 0 C A L E N D A R Y E A R S
Multiple myeloma. East. Europe
25 20 15 10 5 1 9 6 0 1 9 7 0 1 9 8 0 1 9 9 0 C A L E N D A R Y E A R S
Multiple myeloma, Japan 25
1970
(e) Leukemias, EU 50 40 30 20 10 50 40 30 20 10 —Q B B -)60 1970 1980 1990 2 0 0 0 C A L E N D A R YEARS Leukemias, USA 1 9 7 0 1 9 8 0 1 9 9 0 C A L E N D A R Y E A R S
Leukemias, East. Europe
50 40 30 20 10 1960 1970 1980 1990 C A L E N D A R YEARS Leukemias, Japan 50 2000 1960 1970 1980 1990 2000 C A L E N D A R YEARS Figure I Continued.
Portugal and Greece. Lung cancer trends in elderly
males varied appreciably from country to country, with
a 25% fall in the UK, but not in other major European
countries. Lung cancer mortality was generally
increas-ing, though to varying degrees, for elderly females. A
substantial decline in breast cancer mortality (-14%)
was observed in the UK, whose rates were originally
higher, but not in other major European countries.
Prostate cancer rates moved downwards in France and
Italy, but upwards in most other countries. Mortality
from multiple myeloma was consistently upwards in
most European countries, except the UK, Finland, The
Netherlands and Norway. The Russian Federation had
the highest total cancer (1532/100,000) mortality in
elderly males, and some of the highest rates for most
sites, except breast and prostate. Over the last decade,
cancer mortality rates increased in elderly Russian by
7.4% in males and 5.5% in females.
Discussion
The main finding of this updated analysis of cancer
mortality in the elderly is the observation of a change in
the trends for males in the US and for both sexes in the
EU, with the consequent end of a long-term rise, and the
beginning of a measurable declining trend in males.
Some decline in total cancer mortality was observed
also for females in Japan. This is a new observation,
since declines in total cancer mortality have been
regis-tered in young [20, 21] and middle age, as well as in
overall age-standardized rates, but rates in the elderly
had longer been rising, and have been described as a
particularly unfavourable indicator of cancer mortality
[8-10].
In all the geographic areas considered, a component
of the falling rate has been the steady decline in gastric
cancer [22]. However, in the EU, and, more importantly,
in the US, gastric cancer rates were already low in the
1980s, and consequently this was a relatively minor
component of the global trends.
Of major relevance are the changing trends in lung
and other tobacco-related neoplasms, including
pan-creas, in the two sexes and various geographic areas.
Thus, lung cancer mortality rates in elderly males have
started levelling off in the EU (and substantially in the
UK [23] and in the US [3]). This reflects the decreased
prevalence of smoking in subsequent generations of
elderly males [24, 25], and the increased numbers of
people who have quit smoking. Lung cancer rates, in
contrast, have increased by 36% in US females, reaching
a rate of over 210/100,000, i.e. twice that of breast
cancer. The rise was 16% in the EU, with a rate of 77/
100,000. These unfavourable trends reflect the increased
prevalence of smoking in elderly women in the US [3]
and, to a lesser degree, Europe. Within Europe, female
rates in Denmark, Iceland and the UK approached 200/
100,000, as well [26]. Trends in mortality from oral
cancer reflect the pattern not only of tobacco but also
of alcohol consumption in the two sexes and various
areas of the world [12, 13].
An 8% fall in breast cancer mortality for elderly
women was registered in the US, and a 3% decrease in
the EU. These favourable trends reflect advancements in
screening, early diagnosis, and treatment of breast
can-cer [27-30], although the declines are smaller than the
15% to 20% reported for younger women (aged 50 to
70 [31]), thus raising questions about modifying the
diagnosis and treatment approaches to breast cancer in
elderly women.
Country Austria Bulgaria Czech Republic Denmark (1995-1996) Finland (1995- 1996) France(1995-1997) Germany Greece (1995-1997) Hungary Ireland (1995-1996) Italy (1995-1996) The Netherlands (1995-1997) Norway (1995-1996) Poland (1995-1996) Portugal Romania Russian Federation (1995-1997) Spain (1995-1997) Sweden (1995-1996) Switzerland (1990-1994) United Kingdom (1995-1997) European Union (1995-1997) USA (1995-1997) Japan(1995-1997) Stomach 1985-1989 162.1 163.0 170.7 70.1 124.2 81.9 137.7 78.4 204.4 117.2 163.0 119.9 104.0 205.2 197.1 143.5 309.2 123.8 84 7 88 3 122.2 126.9 40.6 304.5 1995-1998 103 9 117.9 1116 49 5 78.9 56 2 95.2 66 5 156.6 84 5 113.0 81.8 76.8 151.9 159.8 123.7 247 9 95 3 55 8 l i t 80 5 90.1 32.7 245 9 % change -35 9 -27 7 -34 6 -29 4 -36 5 -31 4 -30.9 -15.2 -23.4 -27.9 -30 7 -31.8 -26.2 -26.0 -18.9 -13.8 -19 8 -23 0 -34 1 -166 -34.1 -29.0 -19 5 -192 Intestines 1985-1989 195.5 119.0 305 5 202.4 1130 187 5 187.9 72.4 229.6 209 4 160 6 175 1 169 1 1152 143.7 72.6 135.3 119.7 131.4 167.4 178.6 170.5 147.8 109.6 1995-1998 178.6 140.5 292.8 198.9 101.1 143.6 175.9 71.5 293.3 188 9 137 3 161.5 168 6 143 4 156.3 96.0 153.1 139.1 123.4 154.8 151.7 151.7 123.9 135.1 % change -8 6 18.1 -4.2 -1 7 -10 5 -23 4 -6.4 -1 2 27.7 -9 8 -14.5 -7 8 -0.3 24 5 8 8 32 2 13.2 16.2 -6.1 -7.5 -15.1 -11.0 -16.2 23.3 Lung 1985-1989 353.8 219.4 520 9 464.8 457.3 323 6 387 4 381.6 460.6 424.7 439.2 678.1 251.2 435.5 178.2 175.9 445.3 328 6 199 2 384.3 550.8 423.8 440.6 273 4 1995-1998 321.2 211.8 468.1 440.4 385.9 326.6 368.0 392 3 534 3 389.3 441.0 548.4 278 6 508 9 2173 226 5 457.3 365 5 191.8 358 2 414.5 387.6 436.7 305.2 % change -9.2 -3 5 -10.1 -5.2 -15.6 0 9 -5 0 2 8 160 -8.3 0.4 -19.1 1 0 9 1 6 9 21 9 28 8 2.7 11 2 -3 7 -6 8 -24 7 -8.5 -0.9 11.6 Prostate 1985-1989 165.9 81 0 162.9 182.7 162.7 170.1 158.5 81.8 164 5 176 0 121.2 168.8 218.7 102.3 137 5 76 8 66.1 131.5 199 4 217.4 160 6 155 1 158.4 36.3 1995-1998 157 3 91 6 166 9 209.1 181.1 142 3 155 9 96 5 177 5 197.3 107.2 177.4 229.9 120.8 172 7 91.2 78.0 131.5 221 1 220.7 161 5 149 5 148 9 48.1 change -5 2 13 1 2 5 1 4 4 11 3 -16.3 1 6 18.0 7.9 12.1 -11.6 5.1 5.1 18.1 25.6 18.8 18.0 0.0 10.9 1.5 0.6 -3.6 -6.0 32.5 Multiple 1985-1989 1 3 2 2 8 1 5 2 21 7 25 6 17 2 1 6 4 10.4 11.2 27.1 16.2 25.2 31.7 9.7 13.4 22.1 21.7 21.8 17.8 21.8 10.2 myeloma 1995-1998 1 7 0 2.1 18.9 26 3 20.5 17.7 19.6 12.1 15.6 27.0 18.1 25.4 28.8 15.8 17.2 23.2 24.8 21 1 19.6 23.9 12.5 % change 28.8 -25 0 24 3 21.2 199 2 9 19.5 16.3 39.3 0 4 11 7 0 8 -9 1 62.9 28 4 5 0 14.3 -3.2 10.1 9.6 22.5 Total, all 1985-1989 1373 0 870 7 1749 2 1500 9 1330.0 1479.2 1420.1 1128.7 1636.8 1434.2 1498.5 1679.9 1230.2 1380 5 1035 4 792.8 1426.5 1258.1 1082.3 1434.8 1536.5 1457.2 1265.5 1218.0 sites 1995-1998 1263.8 884.4 1674.8 1516.5 1234.0 1370 2 1345 3 1160 0 1835.1 1427.4 1437.9 1535.9 1251 6 1511 6 1171 9 917 7 1531.6 1306 7 1051 6 1365 2 1375 3 1377 5 1236.7 1294.7 % change 8.0 1.6 4.3 1 0 7.2 7 4 5.3 2 8 12 1 0.5 -4.0 -8 6 1 7 9.5 1 3 2 15.8 7.4 3.9 -2 8 - 4 9 -10 5 -5 5 -2.3 6.3
Country Austria Bulgaria Czech Republic Denmark (1995-1996) Finland (1995-1996) France(1995-1997) Germany Greece (1995-1997) Hungary Ireland (1995-1996) Italy (1995-1996) The Netherlands (1995-1997) Norway (1995-1996) Poland (1995-1996) Portugal Romania Russian Federation (1995-1997) Spain (1995-1997) Sweden(1995-1996) Switzerland (1990-1994) United Kingdom (1995-1997) European Union (1995-1997) USA (1995-1997) Japan(1995-1997) Stomach 1985-1989 91.4 91.3 81.4 32 4 63.3 32 0 66 0 43.0 86.0 52.5 74.3 44.0 43 9 74 3 95 2 60.7 141.8 58.8 37 6 37 3 48 7 57.0 17.7 1183 1995-1998 61.2 62.9 52 8 21.4 40.4 20.1 45 9 34 4 65.8 37.9 54.9 30.3 32.8 56.9 71 4 51 4 108 4 40 0 26.4 30.1 31.7 39.2 14.7 81 3 % change -33.0 -31 1 -35.1 -34.0 -36.2 -37.2 -30 5 -20.0 -23.5 -27.8 -26.1 -31.1 -25.3 -23 4 -25 0 -15 3 -23 6 -32 0 -29.8 -19.3 -34.9 -31.2 -16.9 -31.3 Intestines 1985-1989 119.1 76.3 167 8 140.9 78.0 101 1 135 9 59 7 151.3 128.4 102.4 119.3 1109 79 6 91.5 53 6 87 2 78.3 89.0 94.2 117 1 1120 98 6 67 9 1995 1998 98 3 84 1 140.9 131.0 67.6 74.6 113.3 48.7 154 9 103 1 75 5 103.0 113.5 92.3 79.8 61.8 94.9 74.9 83.5 85 0 91.7 89.9 80.7 70 4 % change -17.5 10.2 -16.0 -7.0 -13 3 -26 2 -16.6 -18.4 2.4 -19 7 -26.3 -13.7 2.3 16.0 -12.8 15.3 8.8 -4.3 -6.2 -9.8 -21 7 -197 -18.2 3.7 Lung 1985-1989 60 6 42 6 54 9 137 3 50 2 32 4 50.3 48.5 80.3 144.0 52.7 50.7 57.5 57.2 26 6 35.7 52.3 25.5 60.0 45.8 158.1 66.5 155.1 66 3 1995-1998 70.5 41.9 78.4 197.9 54 5 41 0 66.8 51.1 113.7 160.4 60.8 89.3 95.6 71.8 28.5 45.2 49.3 25.7 82 9 53.9 180 7 77 4 211 6 67.1 % change 16.3 -1.6 42.8 44.1 8 6 26.5 32.8 5.4 41.6 11.4 15.4 76 1 66.3 25.5 7.1 26.6 -5.7 0.8 38.2 17 7 143 164 36.4 1 2 Breast 1985-1989 117.0 66.9 115 3 139 5 84 8 99 0 109.5 69.3 111.7 122.8 100.2 136.1 99.7 70.3 71.9 59.9 50.0 71.7 93 1 138.0 144.0 109.6 115.7 19.0 1995-1998 106.5 71.3 1166 151 5 79 1 98 9 110.3 83.5 122.5 129.7 100.0 133.4 98.8 77.8 81.9 70.9 67.7 77 3 89 0 131.1 123.4 106.0 106.2 24.4 % change -9.0 6 6 1 1 8.6 -6.7 -0.1 0.7 20.5 9.7 5.6 -0.2 -2.0 -0.9 10.7 13.9 18.4 35.4 78 -4.4 -5.0 -14.3 3.3 -8 2 28 4 Multiple 1985-1989 11.1 1.5 11.7 14.7 17.4 12.2 11.0 7.9 9.3 18.4 11.7 16.2 19.0 7.3 9.8 15.7 15.4 14 9 123 14.9 7.2 myeloma 1995-1998 14.7 1.7 129 165 193 123 13.8 8.8 11.9 16.8 13.0 17.0 18.4 11.9 12.8 17.2 15.7 14.5 13.9 16.5 8.5 % change 32.4 13.3 10.3 12.2 10.9 0.8 25.5 11.4 28.0 -8.7 11.1 4.9 -3.2 63 0 30.6 9 6 1 9 -2 7 130 10.7 18.1 Total, 1985-1989 762.7 497 1 871.9 906 3 654 1 602 7 767.4 521.7 855.3 839.3 682.3 724.1 667.8 674.7 531.6 460.3 605 7 540 9 673 5 695 0 850.9 712.2 731.8 557.2 all sites 1995-1998 687.0 492.9 851 5 980.4 611 6 567 2 722.5 535.4 900.7 853.5 646.2 729.9 709.7 706.2 544.9 497.9 639.3 522.0 685 9 669.4 835 7 680.0 764.1 525.9 % change -9.9 -0 8 -2 3 8 2 -6 5 -5.9 -5.9 2.6 5.3 1 7 -5.3 0.8 6.3 4.7 2.5 8 2 5.5 -3 5 1 8 -3 7 -1 8 -4.5 4.4 -5.6
A similar line of reasoning applies to prostate cancer
in the EU and US [32, 33]. The decrease in prostate
cancer mortality may at least in part be attributed to a
favourable influence of prostate specific antigen (PSA)
testing. This was introduced in Western Europe a few
years later than in the USA, and the proportion of men
aged 65 or over who have undergone PSA testing is
probably much lower in Europe than in several areas of
the US [32, 33]. This is compatible with the smaller
decline in mortality in the EU than in the USA. In any
case, the first observation of favourable changes in
trends for mortality from these common cancers in the
elderly is extremely encouraging. Mortality from breast
and prostate cancer in the elderly was still rising in
Japan, but absolute rates remained comparatively low
[34].
In addition, ovarian cancer rates were low in Japan,
and showed only a moderate tendency to rise over the
last few years, whereas a steady upward trend was still
evident in Europe. The leveling off in the US may also
reflect the favorable impact of oral contraceptives on the
risk of ovarian cancer in the elderly [35].
It is more difficult to explain the levelling trends and
the declines in colorectal cancer mortality, particularly
in elderly women. These tendencies may also be due, at
least in part, to earlier diagnosis, but a more favourable
pattern of risk factor exposure (including diet and
per-haps hormones for women [36, 37] has probably played
some role as well.
Mortality from kidney cancer and, more importantly,
from multiple myeloma has, in contrast, been steadily
rising in most countries considered, with the notable
exceptions of some northern European countries (i.e.,
Finland, Norway and Sweden). Diagnostic
improve-ments still partly or largely account for these trends, but
it is also possible that some real increase has occurred in
incidence and mortality from myelomas [38], as well as
for lymphomas [39], which have also been increasing in
most areas, without there being any obvious
explana-tions and consistent patterns. Brain cancer is another
form of the disease that has risen in the elderly, but the
WHO database did not provide enough information to
understand and evaluate brain cancer trends in various
countries [40, 41]. Mortality from leukemia in the elderly,
in contrast, tended to remain at the same level over the
last decade, possibly reflecting improvements in
manage-ment and treatmanage-ment of the disease in the elderly, though
to a lower degree than has occured in younger aged
patients [42].
In general, it is important to stress the limitations and
uncertainties of cancer death certification for the elderly
and their trends over time. Although the exact influence
of increasingly more accurate certification on cancer
rates remains undefined, almost certainly this has
caused some systematic upward trends over time,
fol-lowing the generalized improvement in diagnosis and
certification of selected cancer sites, especially prostate
and multiple myeloma [11, 13, 40].
Within Europe, a substantial variation in mortality
from several major cancer sites can still be observed in
the elderly, although for other neoplasms - such as
breast or prostate - tendencies towards stabilizing were
also apparent [43]. Most trends remain unfavourable for
the elderly population of both sexes in eastern Europe,
reflecting both rising trends in underlying incidence
-due to unfavourable patterns in smoking, characteristics
of diet and exposures to other risk factors, and to
systematic delay in the adoption of improved diagnosis
and treatment methods. Thus, while stomach cancer
rates remain high in these areas of the continent, lung
cancer rates in males have reached some of the highest
rates observed (over 500/100,000 in Hungary or
Poland), and breast or prostate cancer rates were still
moving upwards. Comprehensive intervention for cancer
control among elderly, particularly in eastern Europe, is
therefore a public health priority [44-47].
Acknowledgements
This study has been made possible by a core grant from
the Swiss League against Cancer. Supports were also
received by the Italian Association for Cancer Research.
References
1. Cole P, Rodu B. Declining cancer mortality in the United States. Cancer 1996. 78: 2045-8.
2. Bailar JC, Gornik HL. Cancer undefeated. N Engl J Med 1997, 336: 1569-74.
3. Wingo PA, Ries LAG, Giovino GA et al. Annual report to the Nation on the status of cancer, 1973-1996, with a special section on lung cancer and tobacco smoking. J Natl Cancer Inst 1999; 91: 675-90.
4. Ries LAG. Wingo PA. Miller DS et al. The annual report to the Nation on the status of cancer, 1973-1997. with a special section on colorectal cancer. Cancer 2000; 88: 2398-424.
5. Levi F, La Vecchia C, Negri E, Lucchini F. Declining cancer mortality in European Union. Lancet 1997; 349: 508-9.
6. Levi F. Lucchini F, Negri E, Boyle P. Cancer mortality in Europe and an overview of trends from 1955 to 1994. Eur J Cancer 1999; 35: 1477-516.
7. Levi F, Lucchini F, La Vecchia C, Negri E. Trends in mortality from cancer in the European Union. 1955-1994 Lancet 1999: 354: 742-3.
8. Davis DL, Hoel D, Fox J, Lopez A. International trends in cancer mortality in France, West Germany, Italy, Japan, England and Wales, and the USA. Lancet 1990; 336: 474-81.
9. Davis DL, Dinse GE. Hoel DG. Decreasing cardiovascular dis-ease and increasing cancer among whites in the United States from 1973 through 1987. Good news and bad news. JAMA 1994; 271:431-7.
10. Hoel DG, Davis DL. Miller AB et al. Trends in cancer mortality in 15 industrialized countries. 1969-1986. JNCI 1992; 84: 313-20. 11. Levi F, La Vecchia C, Lucchini F. Negri E. Worldwide trends in
cancer mortality in the elderly, 1955-1992. Eur J Cancer 1996; 32A: 652-72.
12. La Vecchia C, Negri E. Levi Fet al. Cancer mortality in Europe: Effects of age, cohort of birth and period of death. Eur J Cancer 1998; 34: 118-41.
13. Doll R, Peto R. The causes of cancer: Quantitative estimates of avoidable risks of cancer in the United States today. JNCI 1981; 66: 1191-308.
14. Monfardini S, Aapro M, Ferrucci L et al. Commission of the European Communities "Europe Against Cancer' Programme European School of Oncology Advisory Report. Cancer Treat-ment in the Elderly. Eur J Cancer 1993; 29A: 2325-30.
15. Balducci L. Geriatric oncology: Challenges for the new century. Eur J Cancer 2000; 36: 1741-54.
16. World Health Organization. International Classification of Dis-eases: Eighth Revision. Geneva: World Health Organization 1967. 17. World Health Organization. International Classification of Dis-eases: Ninth Revision. Geneva: World Health Organization 1977. 18. World Health Organization. International Statistical
Classifica-tion of Diseases and Related Health Problems: Tenth revision. Geneva: World Health Organization 1992
19. Doll R, Smith PG Comparison between registries: Age-stand-ardized rates. In Waterhouse JAH, Muir CS, Shanmugaratnam K. et al. (eds): Cancer Incidence in Five Continents, Vol IV. IARC Scientific Publication No 42. Lyon: International Agency for Research on Cancer 1982; 671-5.
20. Doll R. Are we winning the fight against cancer? An epidemio-logical assessment. Eur J Cancer 1990; 26: 500-8.
21. Franceschi S, Levi F, Lucchini F et al. Trends in cancer mortality in young adults in Europe, 1955-1989. Eur J Cancer 1994; 30. 2096-118.
22. La Vecchia C, Franceschi S. Nutrition and gastric cancer with a focus on Europe. Eur J Cancer Prev 2000, 9. 291-5.
23. Peto R, Darby S, Deo H et al. Smoking, smoking cessation, and lung cancer in the UK since 1950: Combination of national statistics with two case-control studies. BMJ 2000, 321: 323-9. 24. Franceschi S, Naett C. Trends in smoking in Europe. Eur J Cancer
Prev 1995; 4: 271-84.
25. Tobacco or health: A global status report. Geneva- World Health Organization 1997; 485.
26. Levi F, La Vecchia C, Lucchini F. Negri E. Lung cancer in Icelandic women. Eur J Cancer Prev 1999; 8: 369.
27. Cuzick J. Screening for cancer, future potential. Eur J Cancer 1999; 35: 685-92.
28. Early Breast Cancer Trialists' Collaborative Group Polychemo-therapy for early breast cancer: An overview of the randomized trial. Lancet 1998, 352: 930-42.
29. Early Breast Cancer Trialists' Collaborative Group. Tamoxifen for early breast cancer: An overview of the randomized trial. Lancet 1998; 351: 1451-87.
30. Fisher B, Costantino JP, Wickerman DL et al. Tamoxifen for prevention of breast cancer: Report of the National Surgical Adjuvant Breast Project P-2 Study. JNCI 1998; 90: 1371-88. 31. Levi F, Lucchini F, Negri E, La Vecchia C. The fall in breast
cancer mortality in Europe. Eur J Cancer 2001; 37: 1409-12. 32. Levi F, Lucchini F, Negri E, La Vecchia C. Recent trends in
prostate cancer mortality in the European Union. Epidemiology 2000; 11- 612
33. Tarone RE, Chu KC. Brawley OW. Implications of stage-specific survival rates in assessing recent declines in prostate cancer mortality rates. Epidemiology 2000; 11: 167-70.
34. Boyle P, Levi F, Lucchini F, La Vecchia C. Trends in diet-related cancers in Japan. A conundrum? Lancet 1993; 342: 752. 35. La Vecchia C, Franceschi S. Oral contraceptives and ovarian
cancer. Eur J Cancer Prev 1999; 8: 297-304.
36. Boyle P, Langman JS. ABC of colorectal cancer. Epidemiology. BMJ. 2000; 321: 805-8.
37. Franceschi S, La Vecchia C. Colorectal cancer and hormone replacement therapy: An unexpected finding. Eur J Cancer Prev 1998; 7: 427-38.
38. Cuzick J. Multiple myeloma. Cancer Surveys 1994; 19-20: 455-74. 39. Levi F. La Vecchia C. Lucchini Fet al. Mortality from Hodgkin's disease and other lymphomas in Europe. 1960-1990 Oncology 1995; 52: 93-6.
40. Boyle P. Maisonneuve P. Saracci R. Muir CS Is the increased incidence of primary malignant brain tumours in the elderly real? JNCI 1990, 82: 1594-6
41. Modan B, Wagener DK. Feldman JJ et al. Increased mortality from brain tumours: A combined outcome of diagnostic technol-ogy and change in attitude toward the elderly. Am J Epidemiol
1992; 135. 1349-57.
42 Levi F. Lucchini F. Negri E et al Trends in mortality from leukemia in subsequent age groups. Leukemia 2000; 14: 1980-5. 43 Levi F, Lucchini F, Boyle P et al. Cancer incidence and mortality
in Europe, 1988-92. J Epidemiol Biostat 1998; 3: 295-373. 44. Boyle P. Epidemiology in central and eastern Europe.
Epidemiol-ogy 1992; 3: 391
45. Boyle P. Tobacco and cancer, the European perspective. Ann Oncol 1995; 6: 435
46. Levi F. Cancer prevention: Epidemiology and perspectives. Eur J Cancer 1999: 35: 1046-58.
47. La Vecchia C, Levi F. Franceschi S. Epidemiology of cancer with a focus on Europe. J Epidemiol Biostat 2000; 5: 31-47.
Received 2 March 2001, accepted 14 May 2001.
Correspondence to.
F. Levi. MD
Registre vaudois des tumeurs
Institut universitaire de medecine sociale et preventive CHUV-FalaisesI
1011 Lausanne Switzerland