Quanti¢cation of bacterial mRNA involved in degradation
of 1,2,4-trichlorobenzene by Pseudomonas sp. strain P51
from liquid culture and from river sediment
by reverse transcriptase PCR (RT/PCR)
Rainer Meckenstock
1;*, Patrick Steinle
2, Jan Roelof van der Meer, Mario Snozzi
Swiss Federal Institute for Environmental Science and Technology (EAWAG) Uëberlandstr. 133, CH-8600 Duëbendorf, Switzerland Received 9 July 1998; revised 4 August 1998; accepted 13 August 1998
Abstract
Competitive reverse transcriptase polymerase chain reaction (RT/PCR) was used to quantify the mRNA of the tcbC gene of Pseudomonas sp. strain P51. The tcbC gene encodes the enzyme chlorocatechol-1,2-dioxygenase involved in 1,2,4-trichlorobenzene (TCB) degradation. The mRNA content per cell was monitored in a batch culture growing on 1,2,4-TCB. No mRNA could be detected in the first 2 days of the lag phase. mRNA production became maximal with 20 molecules per cell in the early exponential growth phase but then decreased to less than 10 molecules per cell. When TCB was depleted and the cells entered the stationary phase, the mRNA content decreased slowly below the detection limit within 4 days.
In order to compare detection of tcbC mRNA in pure culture and in river sediment, cells of strain P51 pregrown on TCB were added to sediment and RNAs extracted. In sediment samples containing 5U108 cells per gram the tcbC mRNA was
quantifiable by RT/PCR. The mRNA recovery was about 3% as compared to the inoculum. The detection limit of the RT/PCR method was about 107mRNA molecules per gram sediment or 106copies per ml culture medium which corresponded in our
case to 105 molecules per reaction vial. z 1998 Federation of European Microbiological Societies. Published by Elsevier
Science B.V. All rights reserved.
Keywords: Biodegradation; Quantitative PCR; Bioremediation; Xenobiotic; Chlorinated hydrocarbon
1. Introduction
The detection of bacterial activity in the
environ-ment is an important topic in microbial ecology and especially in bioremediation. If strains with speci¢c degradation capacities are to be used for bioaugmen-tation one would like to know if the strain survives in the environment and if it is actively degrading the contaminant. Determination of the population size of the respective organism in the environment is hereto not su¤cient since the speci¢c bacterium might grow on other more easily available substrates or even lose its degradative capacity.
* Corresponding author.
Tel.: +49 (7531) 88 4541; Fax: +49 (7531) 88 2966; E-mail: [email protected]
1Present address: Universitaët Konstanz, Lehrstuhl fuër
Mikro-bielle Oëkologie, PO-Box 5560, 78457 Konstanz, Germany.
An elegant method to monitor in situ activity would be the detection of speci¢c bacterial mRNAs. This method could even distinguish between isoen-zymes or di¡erent enisoen-zymes catalyzing identical reac-tion but originating from di¡erent organisms. The main di¤culties, however, for mRNA detection are the instability of bacterial mRNAs (i.e. half life times of 1^3 min), the poor sensitivity of established detec-tion methods and the problem of selective prepara-tion of mRNA from very complex systems like soil. Nevertheless, some attempts have been at least par-tially successful [1,2]. Here we show the application of competitive reverse transcriptase PCR for the de-tection and quanti¢cation of a speci¢c bacterial mRNA in a river sediment.
The 1,2,4-TCB degrading organism Pseudomonas sp. strain P51 was taken as a model organism [3]. In this strain the catabolic enzymes for TCB degrada-tion are encoded by two gene clusters, tcbAB and tcbCDEF [4]. The tcbAB operon codes for both chlorobenzene dioxygenase and chlorobenzene dihy-drodiol dehydrogenase which catalyze the conversion of 1,2,4-TCB to 3,4,6-trichlorocatechol. The tcbCDEF genes encode the enzymes for subsequent chlorocatechol degradation, i.e. chlorocatechol-1,2-dioxygenase (product of the tcbC gene), chloromuc-onate cycloisomerase, dienelactone hydrolase and maleylacetate reductase. The tcbC gene was taken as the target sequence for the detection of speci¢c mRNA for TCB degradation because it is the ¢rst gene on the tcbCDEF operon and the ¢rst part of the mRNA which is degraded by RNase. Thus, the de-tection of tcbC mRNA provides information on the abundance of intact mRNA rather than partially de-graded fragments.
2. Materials and methods 2.1. Growth of bacteria
Pseudomonas sp. strain P51 was taken from the laboratory culture collection [3]. Strain P51 was grown in a 300 ml batch culture on mineral medium Z3 with 250 mg l31 1,2,4-TCB as sole car-bon and energy source in a 3 l gas-tight Erlenmeyer £ask [5]. Growth was followed spectrophotometri-cally at 578 nm and by plate counts of colony
form-ing units on nutrient broth (NB) medium (Biolife, Italy).
If not otherwise stated, nucleic acid techniques were performed according to standard protocols. As far as possible, all solutions were treated with diethylpyrocarbonate (DEPC) in order to inactivate contaminating RNAses.
2.2. Plasmids
The tcbC gene of strain P51 was chosen as the target for competitive RT/PCR. Plasmid pTCB82 [6] contained the tcbC gene in a pT7-5 expression vector [7]. For competitive PCR, plasmid pRMTC1 was constructed which carried a deletion of 23 base-pairs between a SalI and a BamHI site present in the tcbC gene of pTCB82 (Fig. 1). The deletion was located in the middle of the DNA fragment to be ampli¢ed by PCR with primers 940207 (5P-GAC TTC TGG ATG CTC CTA CTG AGC GT-3P) and 940206 (5P-GC GTC GGC TAC ATG ATG AAA CTG GC-3P). pTCB82 was partially digested with SalI and completely with BamHI. The over-hangs were made blunt ended by using Klenow DNA polymerase and both ends were religated. Transformation in E. coli DH5K produced the plas-mid pRMTC1. The deletion was checked by DNA sequencing. In vitro mRNA was produced from plasmids pRMTC1 and pTCB82 by using T7 RNA polymerase according to the instructions by the sup-plier (Boehringer, Mannheim, Germany), puri¢ed with acidic phenol plus chloroform extraction and precipitated in aliquots with ethanol at 320³C. 2.3. RNA isolation
For puri¢cation of mRNA from liquid bacterial cultures 1.5 ml aliquots were centrifuged at 10 000Ug in an Eppendorf centrifuge. Supernatant was discarded, and the cells were suspended in 200 Wl lysis bu¡er I (20 mM Na-acetate, pH 5.5, 1 mM EDTA, 0.5% SDS). The cell suspension was ex-tracted three times with 200 Wl acidic phenol (pH 5.5), once with neutral phenol plus chloroform (pH 7.5) and once with chloroform. The puri¢ed RNA was precipitated from the water phase with ethanol and Na-acetate (100 mM, pH 5.5) and stored at 320³C.
Concentrations of mRNA were determined spec-trophotometrically.
For preparation of mRNA from a sediment sam-ple, 0.4 g sediment was mixed with 0.4 g glass beads (0.1 mm diameter), 75 mg polyvinylpolypyrolidon (PVPP) [8] and 1 ml of lysis bu¡er II (200 mM Tris/HCl, pH 8.5, 1.5% SDS, 10 mM EDTA, 1% Na-desoxycholate, 1% Nonidet-P40, 5 mm thiourea, 10 mM DTT) in an Eppendorf vial. Samples were treated twice in a cell homogenizer (type 853022/0, Braun, Melsungen, Germany) at 4000 rpm for 1 min with 1 min intermittent cooling on ice. After break-ing the cells, the sample was centrifuged at 15 000Ug for 2 min at 4³C and the supernatant was transferred to an equal volume of acidic phenol. The sample was centrifuged at 10 000Ug for 2 min after a 5 min incubation at 65³C and the RNA was puri¢ed as described above for the isolation from liquid cul-tures.
All RNA samples were treated with RNase free DNaseI (Boehringer, Mannheim, Germany) for 30 min at 37³C, again puri¢ed by extractions with phe-nol plus chloroform (once) and chloroform only, and ¢nally precipitated with ethanol and Na-acetate as described before. Integrity of the RNA samples was routinely checked on agarose gels and the ap-pearance of the three bands of ribosomal RNA were taken as an indication of su¤ciently intact RNA. 2.4. RT/PCR
Competitive RT/PCR was performed according to the standard protocol described in the Perkin Elmer Tth DNA polymerase EZ-kit with the two primers 940206 and 940207, where primer 940207 served for cDNA generation as well. Depending on the target tcbC mRNA concentration, a constant amount of 0.75 Wl in vitro produced mRNA of pRMTC1 con-taining either 106 or 107 copies was used as internal competitive standard in the RT/PCR to which 0.75 Wl of a dilution series of the isolated sample mRNA was added. RT/PCR was run with the following tem-perature protocol: (RT reaction) 65³C, 1 min; 42³C, 5 min; and 65³C, 30 min; then 40 cycles PCR am-pli¢cation of: 85³C, 0.1 min; 93.5³C, 1 min; 62³C, 1 min; and 72³C, 1 min. As a ¢nal step the reactions were incubated at 72³C for 6 min. Ampli¢cation products were separated and analyzed by agarose
gel electrophoresis after PCR. The target mRNA concentration present in the sample was estimated from the dilution step at which the ampli¢cation products of the standard mRNA and the target mRNA were present in equal amounts. Quanti¢ca-tion was always performed on three parallel extrac-tions of sample aliquots.
Dot blot analysis was carried out according to standard protocols on Nylon membranes (Qiagene). RNA loaded membranes were hybridized for 4 h at 54³C with 32P end-labeled oligonucleotide 940207 and exposed to Kodak X-OMAT ¢lms. Intensities of the hybridization signal of each spot were quanti-¢ed on a laser densitometer (Molecular Dynamics, Sunnyvale, CA, USA).
2.5. Analysis of TCB concentrations
1,2,4-TCB was extracted from 2 ml culture ali-quots by shaking with an equal volume of hexane for 3 min. The hexane phase was analyzed on a Varian, Star 3400 CX gaschromatograph/electron-capture-detector (GC/ECD) with a DB5 column. Carrier gas was helium operated at a velocity of 43 cm s31.
Chloride concentrations were measured with a Chlor-o-counter (Flohr Instruments B.V., Nieuwe-gein, The Netherlands).
River sediment was taken from River Glatt near Duëbendorf, Switzerland. The dry weight consisted of 2% coarse sand ( s 0.5 mm), 24% middle sand (0.5^ 0.25 mm), 67% ¢ne sand fraction (0.25^0.1 mm di-ameter), 4% very ¢ne sand (0.1^0.05 mm) and 2% silt ( 6 0.05 mm) with an organic content of 2%. 3. Results
The applicability of competitive RT/PCR for quanti¢cation of tcbC mRNA was ¢rst tested on in vitro synthesized mRNA. The ampli¢cation e¤ciencies of known amounts of in vitro mRNA from plasmid pTCB82, representing the native se-quence, were compared to those of the shorter inter-nal standard derived from plasmid pRMTC1. In a competitive assay with both RNAs present in the same reaction vial, equal amounts of ampli¢cation products were observed at concentrations of both
the shorter standard mRNA and the pTCB82-de-rived mRNA of 106 molecules per reaction vial (data not shown). This indicated there were no strong di¡erences in the ampli¢cation e¤ciency of the two RNA sequences.
Next, mRNA was extracted from a culture of strain P51 and dilutions were prepared to which the standard RNA was added. At ratios of standard mRNA to sample mRNA of 3:1 and 1:3 (with con-stantly 106 molecules of standard mRNA present) ampli¢cation products clearly di¡ered in band inten-sity in the agarose gel electrophoresis. When the sample mRNA was present in excess as compared to the standard RNA only the larger ampli¢cation product of the normal mRNA sequence was visible (Fig. 1, lane 2). When both mRNAs were present in identical amounts, both bands were visible (Fig. 1, lane 3) and when the standard mRNA was present in
excess to the sample mRNA only the shorter ampli-¢cation product was visible (Fig. 1, lane 4). These data were veri¢ed independently with dot blot hy-bridization of the isolated mRNAs to a tcbC anti-sense directed oligonucleotide (not shown).
We then tried to determine the tcbC mRNA con-tent of a growing batch culture of strain P51 on 1,2,4-TCB. After a short lag phase of 2 days the cells grew exponentially until they reached the stationary phase on day 4 (Fig. 2A). The culture medium was constantly saturated with 1,2,4-TCB (45 WM) during the ¢rst 3 days and excess 1,2,4-TCB was present as a second liquid phase. On day 4, 1,2,4-TCB concen-tration decreased drastically to below the detection limit of 50 nM and the cells entered the stationary phase as the carbon substrate became limiting. Measurements of the chloride release indicated that the most active degradation of TCB took place
be-Fig. 2. Growth curve of Pseudomonas sp. strain P51 on TCB. A: Solid line, cell density as colony forming units (cfu); dashed line, TCB concentration; and dotted line, chloride concentration. B: Solid line, cell density; dashed and dotted line, mRNA concentration; and dashed and double dotted line, mRNA molecules per cell.
Fig. 1. Agarose gel electrophoresis of the ampli¢cation products from a competitive RT/PCR of pRMTC1 in vitro mRNA and tcbC tar-get mRNA prepared from a liquid culture of strain P51. The pRMTC1 standard mRNA was kept constant at 106 copies per vial.
Ex-tracted mRNA was added in di¡erent amounts to the reaction vials. Lane 1, DNA molecular mass marker (Boehringer, Mannheim); lanes 2^5, 100^1033 diluted mRNA respectively. The cartoon shows a schematic view of the target and standard DNA used in this work.
tween day 3 and 4. On each day of the batch experi-ment, aliquots were taken for mRNA quanti¢cation by competitive RT/PCR and dot blot hybridization (Fig. 2B). No mRNA production was detectable in the ¢rst two days of the lag phase until on day 3 maximal induction was observed. The amount of tcbC mRNA was constantly high during day 3 and 4 with about 109 molecules per ml culture and de-creased slowly on day 5 and 6 to 3U108 molecules per ml when 1,2,4-TCB became limiting. When ana-lyzed on a per cell basis the mRNA copies decreased from 20 per cell on day 3 to 13 on day 4 and to approximately 3 tcbC mRNA molecules per cell on day 5 and 6. There was no tcbC mRNA production detectable on day 7 or later. Dot blot hybridization of the mRNA samples also indicated highest amounts of tcbC mRNAs during day 3 and 4 (not shown).
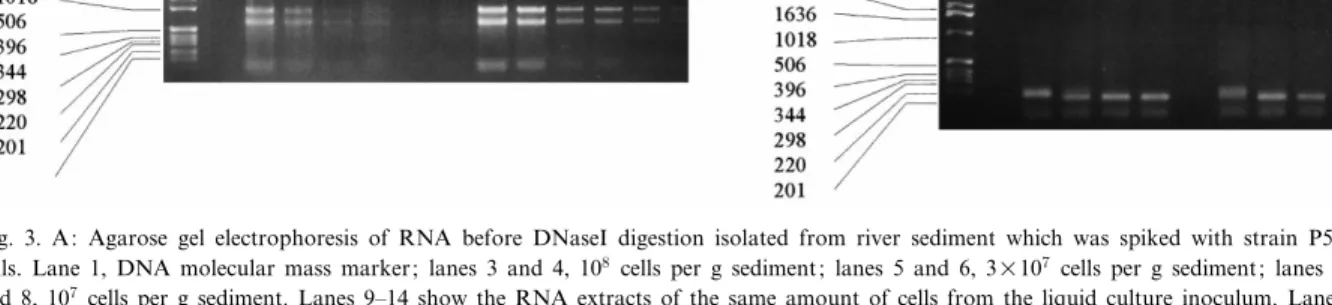
In order to see whether tcbC mRNA could be extracted from soil and quanti¢ed, we introduced di¡erent amounts of strain P51 cells (pregrown on 1,2,4-TCB) to a river sediment. RNA of su¤cient intactness could be recovered from the seeded river sediment as indicated by the rRNA bands (Fig. 3, lanes 3^8). Simultaneously, mRNA was puri¢ed from the same amounts of cells as used for the in-oculum (Fig. 3, lanes 9^14). rRNA bands from sedi-ment samples were less intensive indicating an un-speci¢c loss or degradation of RNA.
The e¤ciency of mRNA recovery from soil was analyzed with a river sediment to which 5U108 g31 sediment TCB-grown strain P51 cells were added. After DNaseI digestion mRNA concentrations were quanti¢ed with competitive RT/PCR (Fig. 3B). 4.5U107 copies tcbC mRNA per g sediment were recovered from 5U108 cells seeded per g sediment. In contrast, 3.5U108copies tcbC mRNA were quan-ti¢ed from 108 cells per ml of the liquid culture in-oculum which corresponds to 3.5 copies per cell. Thus, only about 3% of the tcbC mRNA was meas-ured in the sediment samples to which strain P51 cells were added as compared to the extracts of the pure culture inoculum. This reduced the detection limit for the sediment samples to about 107 copies per gram sediment and corresponds to 105molecules per reaction vial.
4. Discussion
mRNA of the tcbC gene of Pseudomonas sp. strain P51 was quanti¢ed in batch cultures growing on 1,2,4-TCB and in a river sediment to which strain P51 was added. The project was initiated to reveal if mRNA quanti¢cation with competitive RT/PCR can be used as a tool to estimate bacterial activity in the environment. Although it is rather di¤cult to obtain quantitative measurements of initial target
Fig. 3. A: Agarose gel electrophoresis of RNA before DNaseI digestion isolated from river sediment which was spiked with strain P51 cells. Lane 1, DNA molecular mass marker; lanes 3 and 4, 108cells per g sediment; lanes 5 and 6, 3U107cells per g sediment; lanes 7
and 8, 107cells per g sediment. Lanes 9^14 show the RNA extracts of the same amount of cells from the liquid culture inoculum. Lanes
9 and 10, 108 cells per ml; lanes 11 and 12, 3U107 cells per ml; lanes 13 and 14, 107cells per ml. B: Agarose gel electrophoresis of a
competitive RT/PCR ampli¢cation of tcbC mRNA puri¢ed from a liquid culture grown on 1,2,4-TCB and from the same amount of cells inoculated to sediment. Lane 1, molecular mass marker; lanes 3^6, ampli¢cation products of diluted mRNA extracted from a liquid cul-ture containing 108 cells (100^103-fold diluted respectively). Lanes 8^10, dilution series of mRNA extracted from 5U108 cells added to
sediment (100^102-fold respectively). All PCR reactions were performed in the presence of 107 copies of in vitro synthesized standard
copy numbers with PCR more or less accurate deter-minations can be performed by using competitive PCR with an internal standard [9]. The internal standard at best consists of the same RNA sequence as the target RNA but carries for example a small insertion or deletion which allows to distinguish the ampli¢cation product of the standard from that of the target. Competitive PCR is especially advanta-geous with environmental samples because these often contain contaminants like humic acids which could inhibit the reaction. In the competitive assay both the target and the standard RNA face identical conditions for ampli¢cation.
RT/PCR has been used in the past to detect mRNA of viruses and fungi from environmental samples [10]. We were able to quantify mRNA with a detection limit of about 105 mRNA copies per RT/PCR vial which, due to the di¡erent recov-eries from either a pure culture or sediment, corre-sponded to 106 copies per ml culture medium or 107 copies per gram sediment, respectively. Although the method in principle detects mRNA to a relatively low level, the question remains what a particular number of target mRNA copies will mean in terms of activity of the population. In a batch culture ex-periment, the mRNA induction pattern showed sev-eral phases of mRNA abundance. A ¢rst uninduced lag phase with undetectable low mRNA numbers was followed by a second phase of highest net mRNA synthesis in the start of the exponential growth phase and a third phase of decreasing mRNA synthesis comprising the late exponential and the stationary growth phase. Surprisingly, mRNA production per cell was not maximal in the exponential growth phase with the highest substrate turnover but in the ¢rst part of the log phase. Similar results have been obtained for quanti¢cation of man-ganese peroxidase mRNA levels of the white rot fun-gus Phanerochaete chrysosporium [10]. In the batch experiment TCB was present as a non-aqueous phase liquid and the water phase remained constantly sat-urated as long as TCB was detectable. Nevertheless, the induction of the tcbC gene, as measured by the mRNA content per cell, was not constant. In anal-ogy to the 3-chlorocatechol pathway of Pseudomonas putida (pAC27) the transcription inducer of the tcbC gene is very likely to be 2,3,5-trichloro-cis,cis-muco-nate which is formed by the activity of the TcbC
protein (the chlorocatechol-1,2-dioxygenase) from 3,4,6-trichlorocatechol [11^13]. It might be that the inducer accumulated in the early exponential growth phase because the activity of TcbC was higher than the activity of the chloromuconate-converting en-zyme chloromuconate cycloisomerase encoded by the tcbD gene of the same operon. In a later growth phase the activity of the chloromuconate cycloisom-erase might have increased as compared to the chlor-ocatechol dioxygenase activity and the chloromuco-nate concentration was reduced.
In the environment many habitats are oligotrophic with little substrate turnover and especially in biore-mediation degradation processes are very slow due to limited substrate availability or lack of suitable electron acceptors [14]. Thus, induction of the cata-bolic genes and mRNA production will be low as well. mRNA content per cell will be less than one molecule per cell in an oligotrophic environment as indicated by the batch culture. When induced, it is possible to recover and quantify speci¢c mRNAs from sediment samples by RT/PCR in reasonable amounts as it was shown by our inoculation experi-ment. The e¤ciency of mRNA recovery might de-pend on the type of soil sample and the target bac-terial species of interest as humic acid content, physiological state of the cells or gram type can in-£uence the extraction procedure signi¢cantly. Envi-ronmental applications of RT/PCR are at present restricted by the problem of the detection limit as long as no better methods are available which in-crease the sensitivity by several orders of magnitude. Acknowledgments
We thank Dr. Dietmar Hahn of the Institut fuër Terrestrische Oëkologie, Swiss Federal Institute of Technology (ETH), Zuërich, Switzerland, for help in the extraction of mRNA from soil. This work was supported by the Swiss National Science Foundation grant no. 5001-035298.
References
[1] Nazaret, S., Je¡rey Wade, H., Saouter, E., von Haven, R. and Barkay, T. (1994) merA gene expression in aquatic
environ-ments measured by mRNA production and Hg(II) volatiliza-tion. Appl. Environ. Microbiol. 60, 4059^4065.
[2] Pichard, S.L. and Paul, J.H. (1991) Detection of gene expres-sion in genetically engineered microorganisms and natural phytoplankton population in the marine environment by mRNA analysis. Appl. Environ. Microbiol. 57, 1721^1727. [3] van der Meer, J.R., Roelofsen, W., Schraa, G. and Zehnder,
A.J.B. (1987) Degradation of low concentrations of dichloro-benzenes and 1,2,4-trichlorobenzene by Pseudomonas sp. strain P51 in nonsterile soil columns. FEMS Microbiol. Ecol. 45, 333^341.
[4] van der Meer, J.R., van Neerven, A.R.W., de Fries, E.J., de Vos, W.M. and Zehnder, A.J.B. (1991) Cloning and character-ization of plasmid-encoded genes for the degradation of 1,2-dichloro-, 1,4-1,2-dichloro-, and 1,2,4-trichlorobenzene of Pseudo-monas sp. Strain P51. J. Bacteriol. 173, 6^15.
[5] Schraa, G., Boone, M.L., Jetten, M.S., van Neerven, A.R.W., Colberg, P.J. and Zehnder, A.J.B. (1986) Degradation of 1,4-dichlorobenzene by Alcaligenes sp. strain A175. Appl. Envi-ron. Microbiol. 52, 1374^1381.
[6] van der Meer, J.R., Eggen, R.I.L., Zehnder, A.J.B. and de Vos, W.M. (1991) Sequence analysis of the Pseudomonas sp. strain P51 tcb gene cluster, which encodes metabolism of chlorinated catechols: evidence for specialization of catechol 1,2-dioxygenases for chlorinated substrates. J. Bacteriol. 173, 2425^2434.
[7] Tabor, S. and Richardson, C.C. (1985) A bacteriophage T7 RNA polymerase/promotor system for controlled exclusive
expression of speci¢c genes. Proc. Natl. Acad. Sci. USA 82, 1074^1078.
[8] Holben, W., Jansson, J.K., Chelm, B.K. and Tiedje, J.M. (1988) DNA probe method for the detection of speci¢c micro-organisms in the soil bacterial community. Appl. Environ. Microbiol. 54, 703^711.
[9] Siebert, P.D. and Larrick, J.W. (1992) Competitive PCR. Na-ture 359, 557^558.
[10] Bogan, B.W., Schoenike, B., Lamar, R.T. and Cullen, D. (1996) Manganese peroxidase mRNA and enzyme activity lev-els during bioremediation of polycyclic aromatic hydrocar-bon-contaminated soil with Phanerochaete chrysosporium. Appl. Environ. Microbiol. 62, 2381^2386.
[11] Chugani, S.A., Parsek, M.R., Hershberger, C.D., Murakami, K., Ishihama, A. and Chakrabarty, A.M. (1997) Activation of the catBCA promoter: probing the interaction of CatR and RNA polymerase through in vitro transcription. J. Bacteriol. 179, 2221^2227.
[12] van der Meer, J.R., de Vos, W.M., Harayama, S. and Zehnder, A.J.B. (1992) Molecular mechanisms of genetic adaptation to xenobiotic compounds. Microbiol. Rev. 56, 677^694.
[13] McFall, S.M., Parsek, M.R. and Chakrabarty, A.M. (1997) 2-chloromuconate and ClcR-mediated activation of the clcABD operon: in vitro transcriptional and DNase I footprint anal-yses. J. Bacteriol. 179, 3655^3663.
[14] Head, I.M. (1998) Bioremediation: towards a credible tech-nology. Microbiology 144, 599^608.