B. Heeb, S. Oesch, P. Bohac, and L. J. Gauckler
Nichtmetallische Werkstoffe, ETH Zurich, CH-8092 Zurich, Switzerland
(Received 23 March 1992; accepted 22 June 1992)
Phase compositions and microstructures of melt processed 2212 were studied. 2212 starting powder was cooled from temperatures between 910 °C and 1100 °C in air at rates ranging from 350 K/min to 0.083 K/min. The solidification sequence was established for all cooling rates. Under all conditions the Bi-free (Sr, Ca)CuO2 (01x1) is the primary
phase. The one-layer solid solution H 9 0 5 nucleates on this phase. The residual liquid solidifies to a glassy state, decomposes into the eutectic of Cu2O and Bi2Sr2.1Cao.9O;,:,
or reacts with the primary phase and the 11905 forming 2212 at high, intermediate, or low cooling rates, respectively. Post solidification heat treatment at 850 °C in air leads to partial remelting. The Cu-rich liquid reacts with jJ_905 and 01x1 forming 2212. Subsequent solid/solid reactions lead to a high volume fraction of 2212 with almost ideal 2 : 2 : 1 : 2 stoichiometry.
I. INTRODUCTION
Melt processing is one of the promising indus-trial methods for producing superconducting oxides due to easy formability and good weak link behavior.1"3 In the Bi-based system this technique has been ap-plied to prepare bulk samples4-5 as well as textured 2212 thick films6'7 and fibers.8-9 The melt processed Bi2Sr2CaiCu2Oy (2212) material was reported to be
multiphase due to the incongruent melting of the super-conducting phase 2212.5"7'10'11
Because of the slow kinetics for the formation of the 2212 phase, a melt with a nominal 2212 composition solidifies not only into 2212 but also into four other phases, namely the one-layer compound Bin(Sr, Ca)9Cu50z (U_905), a Bi-free phase with the
composition near SrojCao.sCuC^, a Cu-free phase with composition near Bi3Sr4Ca30j:, and G^O.4"7 It has been
recognized that the primary phase is (Sr, Ca)CuC>29'12~14 and the one-layer compound subsequently crystallizes as the dominant phase.4"6 The two-layer compound 2212 has been found only in bulk samples cooled at very low cooling rates and also in films. Due to the strong segregation during solidification, 2212 has been reported to have Bi-richer and (Sr, Ca)-poorer compositions than the ideal 2212 stoichiometry, even in the samples cooled very slowly.8-9-15-16 Several mechanisms for the 2212 formation were proposed: (1) a direct precipitation from the melt,17 (2) a peritectic reaction during cooling accompanied by the dissolution of the primary phase,6-12-14 and (3) a solid state reaction after complete solidification.18 The slow growth rate of the 2212 solid solution by diffusion processes has prevented the unambiguous determination of the solidification mechanism.
During solidification of liquid with the 2212 nominal composition, the control of the microstructure depends on the maximum heat-treatment temperature, the solid-ification rate, and the oxygen partial pressure during processing. The control of the oxygen content in the melt and during solidification seems to play an espe-cially important role. Only a few systematic studies exist in which these parameters, their influence on the microstructure, and reactions during solidification have been discussed. After the solidification process it is necessary to anneal the samples to improve the super-conducting properties.18'19 From these studies it is ev-ident that the microstructure during post annealing is largely determined by the solidification process itself and also by the processing parameters during post solidifica-tion annealing.
The purpose of this work is to control the micro-structure during solidification and post solidification an-nealing of the 2212 phase. The evolving microstructures were studied as a function of two main process param-eters, maximum heat-treatment temperature (rm a x), and
the cooling rate (dT/dt). The mechanism and kinetics of the formation of the two-layer compound 2212 were studied both during melting and solidification and during annealing.
II. EXPERIMENTAL
Starting material was single phase 2212 powder (Hoechst High Chem, Frankfurt, Germany) with an average grain size of 15-20 /xm (grade 3, chemical purity approximately 99.7%). The chemical composition of the powder was chemically analyzed by the producer and guaranteed to be Bi2.oSr2.oCa1.oCu2.o08.i7±
o.o2-B. Heeb et al.: Microstructure of melt-processed and reaction mechanisms
For each solidification experiment, about 80 g of powder was heated in a high purity A12O3 (99.99%)
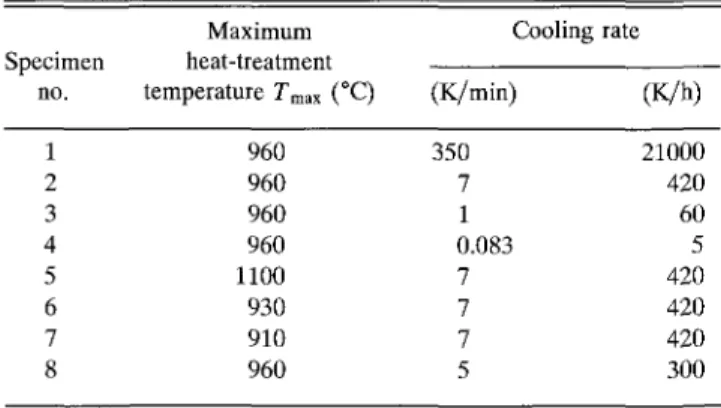
crucible at 5 K/min and held molten in air for 30 min at the maximum heat-treatment temperature (rm a x). Sample
no. 8 was processed similarly, except in argon. The maximum heat-treatment temperatures (rm a x) and the
successive cooling rates (dT/dt) are listed in Table I. Sample no. 1 was quenched by taking the crucible (diameter 35 mm, height 40 mm) out of the furnace and cooled in air. The cooling rate was measured by an alumina tube protected Ni/Cr-thermocouple, sticking in the middle of the melt, and found to be 350 K/min at 890 °C. All the other samples were cooled in the furnace at controlled rates. To study the 2212 formation during post solidification annealing, several pieces were cut from sample no. 2 after melting and solidification, and were then annealed at 850 °C in air for periods up to 112 h and subsequently quenched in air.
The samples were investigated by light microscopy (Reichert-Jung Polyvar-MET, Wien, Austria), XRD (Siemens D-5000, Karlsruhe, Germany) with CuKa
radiation, and SEM (JEOL JSM-6400, Tokyo, Japan). Chemical compositions of phases were determined by EDX (Tracor-Northern Series II, Wisconsin) at an acceleration voltage of 25 kV with an energy dispersive Si(Li) detector. The ZAF correction was applied to the intensities of the B i Ma, S r La, C a La, and C u Ka
lines, and the compositions calculated by means of internal standards. The accuracy of the results was checked with the 2212 starting powder and synthesized Sr0.5Cao.5Cu02 and found to be within ± 3 % .
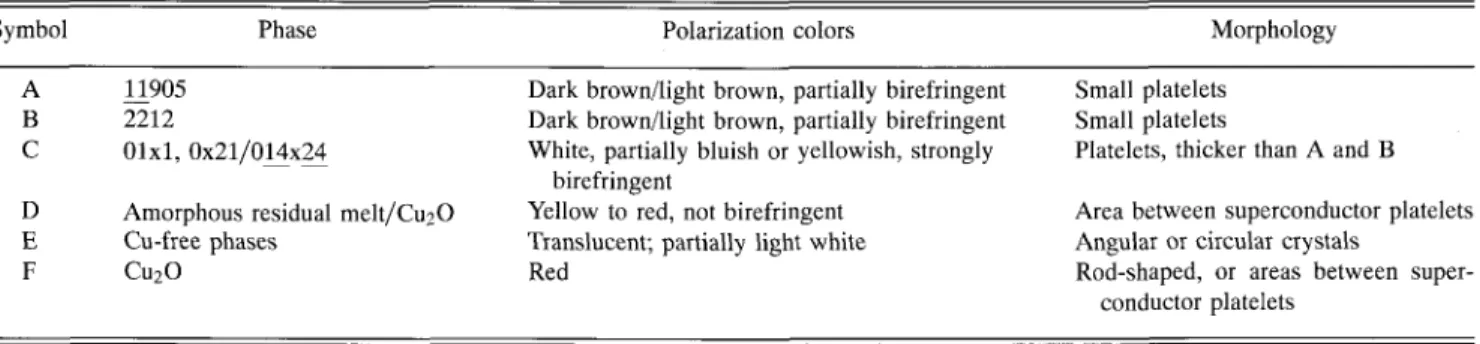
DTA/TGA-experiments (Bahr Geratebau, Hiillhorst, Germany) were performed at a heating rate of 5 K/min and a cooling rate of 10 K/min. For optical microscopy observations the samples were ground with SiC abrasive paper with grit sizes in steps from 500 to 4000. Polarized light was very useful for identification of the phases. Table II summarizes the features and colors under polarized light, as well as the morphology of each phase. The symbols TABLE I. Maximum heat-treatment temperature (7"max) and cooling
rates (dT/dt). Sample no. 8 was melted and solidified in argon, all other specimens in air.
no. 1 2 3 4 5 6 7 8 Maximum heat-treatment temperature Tmax (°C) 960 960 960 960 1100 930 910 960 Cooling (K/min) 350 7 1 0.083 7 7 7 5 rate (K/h) 21000 420 60 5 420 420 420 300
for the phases used in this text are also given. The notations for the chemical compositions used are as follows: the order of the elements is B i - S r - C a - C u and the letter "x" is used for the Sr/Ca exchange. For example, the chemical composition of the phase called "01x1" is S r ^ C a ^ C u O j .
The volume fractions of the phases in the specimens were mainly evaluated by linear analysis from optical micrographs.20 Those of H 9 0 5 and 2212 can hardly be distinguished by light microscopy alone. Therefore their volume fractions were determined by light microscopy and by the proportions of the calibrated XRD intensities. III. RESULTS AND DISCUSSION
A. Melting of 2212
Melting of the 2212 starting powder was investi-gated by DTA/TGA in air [Fig. l(a)]. Melting started at 890 °C, being the onset temperature determined by the crossing point of the tangent of the endothermic peak and the baseline, according to Ref. 21. A 0.8 wt. % loss was observed due to oxygen loss during melting. DTA/TGA did not clearly show the liquidus temperature.
B. Solidification of 2212
The DTA-curve for the 2212 starting powder is shown in Fig. l(b). About 90 mg of the 2212 starting powder was heated up to 1050 °C before cooling. At this temperature the sample was completely molten, as described later. Three major exothermic peaks, at 915 °C, 872 °C, and 754 °C, during solidification at a cooling rate of 10 K/min can be distinguished.
The solidification process was independently ob-served by microscopy and XRD using the 80 g samples listed in Table I. Figure 2(a) shows the optical micro-graph of sample no. 1, which was solidified at the highest cooling rate in this study (in air). Only two crystalline phases were observed embedded in an amorphous matrix (D): the strongly birefringent 01x1 phase (C) and the thin platelets of H 9 0 5 (A). This type of microstructure was also reported by Ray and Hellstrom.22 Figure 2(a) also shows the apparently normal orientation between the primary phase, 01x1, and the secondary phase 11905. Further study is necessary to determine the geometry of the interface of the two phases. At lower cooling rates another crystalline phase appeared which could be detected easily as very bright crystals in optical microscopy and analyzed by EDX to be Cu-free [E in Fig. 2(b)]. We could not detect the existence of the 2212 phase in the samples shown in Figs. 2(a) and 2(b), i.e., at cooling rates of 7 K/min and higher. Only a further decrease of the cooling rate led to the formation of 2212. In Fig. 2(c) the microstructure of the sample cooled at 0.083 K/min (5 K/h) is shown. The dark crystals are a mixture of the one- and two-layer phases
TABLE II. Symbol
Phaseidentification by light microscopy.
Phase Polarization colors Morphology
A B C D E F 11905 2212 01x1, 0x21/014x24
Amorphous residual melt/CuaO Cu-free phases
Cu2O
Dark brown/light brown, partially birefringent Dark brown/light brown, partially birefringent White, partially bluish or yellowish, strongly
birefringent
Yellow to red, not birefringent Translucent; partially light white Red
Small platelets Small platelets
Platelets, thicker than A and B Area between superconductor platelets Angular or circular crystals
Rod-shaped, or areas between super-conductor platelets
(A/B), as detected by XRD. These two phases cannot be distinguished by light microscopy.
T 20 '55
i
-2 800 850 900 950 1000 1050 Temperature [°C](a)
-1.55 r -1.65 -1.75 -1.85 950 1000 Temperature [°C] (b)FIG. 1. (a) Endothermic peak for melting of Bi-2212 and weight loss of 0.8 wt. % due to oxygen loss (DTA/TGA, heating rate = 5 K/min). (b) Exothermic solidification peaks of Bi-2212 melt and weight gain of 0.2 wt. % due to oxygen absorption (DTA/TGA, cooling rate = 10 K/min).
The volume fractions of the phases existing in the solidified samples were analyzed and are summarized in Figs. 3 and 4. The important phases are 2212, 11905, and 01x1. The volume fractions of the Bi-free 01x1 were almost constant (about 10 vol. %). A small decrease of this fraction at low cooling rates indicates a slow dis-solution reaction after precipitation as a primary phase. It can be attributed to a peritectic reaction of liquid + 01x1 — 2212, as reported previously.6-12-14 The amount of the other crystalline phases varied much more with cooling rate. The 2-layer compound was observed only in the samples cooled at rates slower than 7 K/min with the amount increasing at decreasing cooling rate. Most of the 2212 crystals were observed in the vicinity of the JJ_905 platelets, revealing a lamellar structure. These observations can be attributed to the direct precipitation of 2212 from the melt17 or to a reaction of H 9 0 5 with the residual melt. The significant decrease of the volume fractions of H 9 0 5 and the amorphous phase in the sam-ples cooled at rates =£1 K/min support the idea that the reaction of H 9 0 5 with the residual melt is predominant. The amount of residual melt that remains at cooling rates > 1 K/min and that of the Cu-free phase at rates < 1 K/min decreased with decreasing cooling rate, as shown in Fig. 3. However, even in samples cooled at slow rates of 0.083 K/min, i.e., 5 K/h, these phases could still be detected in amounts < 10 vol. % each by careful light microscopy observation. At this lowest cooling rate [Fig. 2(c)], the residual melt crystallized into a eutectic structure. This eutectic structure was found to consist of the Cu-free phase and Cu2O, and to be located
between the primary phase and the lamellar structure consisting of H 9 0 5 and 2212.
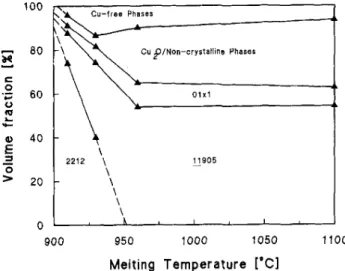
Figure 4 summarizes the volume fraction of each phase vs rm a x at a constant cooling rate (7 K/min) in
the samples no. 2, 5, 6, and 7. The amount of 2212 increased remarkably in specimens held at maximum heat-treatment temperatures below 960 °C. This high volume fraction was either due to slow dissolution of the starting powder or precipitation from the melt. Therefore, further investigations were made to clarify the question of the dissolution kinetics. After the melting process the surface of the samples held at Tmax < 960 °C was
B. Heeb et al.: Microstructure of melt-processed and reaction mechanisms 100 Cu-frse phases
(a)
(b) (c)FIG. 2. (a) Microstructure (polarized light) of the solidified Bi-2212 melt at the cooling rate of 350 K/min. Phases: A: H905, C: primary phase Olxl, D: amorphous residual melt, (b) Microstructure (polarized light) of the solidified Bi-2212 melt at the cooling rate of 7 K/min. Phases: A: U905, C: 01x1, D: residual melt/Cu2O, E: Cu-free phase,
(c) Microstructure (polarized light) of the solidified Bi-2212 melt at the cooling rate of 0.083 K/min. Phases: A/B: U.905/2212, F: Cu2O
precipitates in the Cu-free phase.
1 10 100 1000
Cooling rate [K/min]
FIG. 3. Phase content versus cooling rate (dT/dt). Maximum heat-treatment temperature = 960 °C, holding time = 30 min.
observed to be very rough and irregular, in contrast to that of the samples with Tmax 3= 960 °C which had
very smooth and flat surfaces. This suggests that the samples with rm a x < 960 °C were only partially molten,
which explains the high volume fraction of 2212 even at a high cooling rate (7 K/min). Since we could not detect any precipitation of 2212 at maximum heat-treatment temperatures above 960 °C (completely molten samples) at a cooling rate of 7 K/min, it is likely that the coarse 2212 starting powder did not decompose completely into the equilibrium phases due to the short holding time of 30 min, although the 2212 phase began to melt at 890 °C. The slow dissolution of 2212 at temperatures <960 °C was confirmed by an experiment, which showed that samples that were held at 930 °C contained 50 vol. % of 2212 after a holding time of 30 min, and still 20 vol. % after 8 h. Additionally, in
100
Cu-free Phases
900 950 1000 1050 Melting Temperature [*C]
1100
FIG. 4. Phase content versus maximum heat-treatment temperature (Tmax)- Cooling rate = 7 K/min, holding time = 30 min.
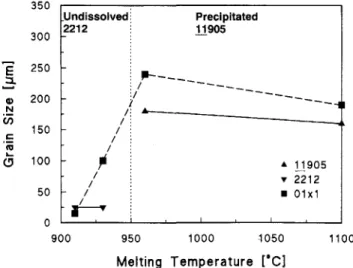
Fig. 5 average grain sizes of these crystalline phases, i.e., the lengths of plate-like crystals, are shown as a function of Tmax. The average grain size of the lamellar
phase increased from 20 ^ m at 910 °C to 230 /nm at 960 °C (note that the grain size of the starting powder was 15—20 /xm) and then remained almost constant above 960 °C. This also is consistent with the idea that complete melting of the 2212 material occurs only above 960 °C in air.
Grain sizes of the phases in the solidified samples varied also with cooling rates from 960 °C (see Fig. 6). In these specimens, the average grain size of the 11905 increased from <50 /mm at the highest cooling rate to nearly 500 /mm at the lowest cooling rate. In contrast, the grain size of the primary phase 01x1 decreased slightly at low cooling rate. This decrease is presumed to be due to the previously mentioned peritectic reaction.
C. Cation stoichiometry of the phases
The chemical compositions of the solidified phases were determined by EDX. The following results are average values of 1 to 5 analyzed points for each phase. The microstructure phase designation label is shown in parentheses.
1. H905 phase (A)
It was observed that Ca tends to dissolve in the one-layer solid solution since all the grains contained a small amount of Ca. The ratio Sr: Ca decreased with decreas-ing cooldecreas-ing rate rangdecreas-ing from 9.5 : 1 , in the most rapidly cooled, to 4 : 1 in the most slowly cooled samples. The Bi: Cu ratio scattered considerably around an average of 10.75 ± 1.5 : 5 . The error in the analysis was attributed to the morphology of this phase, namely very thin plates. In many cases the analytical volume of the electron beam
350 50 E iz e [ <5
(5
300 250 200 150 100 Undissolved 2212 -/- i
Precipitated 11905 11905 2212 01x1 900 950 1000 1050 Melting Temperature [*C] 1100 <0 N 500 400 300 c 200 100 -0.1 1 10 100 Cooling rate [K/min]1000
FIG. 5. Grain size of 01x1 and JJ_905/2212 versus maximum heat-treatment temperature (7*max). Cooling rate = 7 K/min.
FIG. 6. Grain size of 01x1 and H905/2212 versus cooling rate. Max-imum heat-treatment temperature = 960 °C.
may have exceeded the plate thickness, including part of an adjacent phase in the analysis.
2. 2212 phase (B)
At a cooling rate of 1 K/min the analyzed composi-tion was approximately Bi2.6Sr2.4Cao.8Cu2Oj:. The
analy-sis showed that the 2212 phase solidified at this rate was richer in Bi and poorer in Ca than the ideal stoichiom-etry, as reported earlier.8'9'13'23 It should be noted, how-ever, that at the lowest cooling rate the composition was near the ideal 2212 stoichiometry (Bi2.oSr2.iCao.8Cu2Ox),
indicating that the sample was approaching equilib-rium. This observation agrees with the post solidification heat-treatment results discussed hereafter. Hence cooling down to 850 °C at the very low rate of 5 K/h produces the same phase composition as a rapid cooling followed by a post cooling heat treatment of the equivalent time at 850 °C.
3. 01x1 phase (C)
The existence of Bi in the primary phase was not detected and the ratio of (Sr + Ca): Cu was close to 1 (49.8 ± 1 : 50.2 ± 1). The concentration of both Sr and Ca ranged within 3 at. % and the average com-position over all of the samples can be expressed as Sr063Ca0.37CuO2, which is close to the maximum
solu-bility of Ca in the SrCuO2 phase at 850 °C,24 and agrees
with the previous solidification studies.5"7
4. The other phases
The Cu-free phase (E) showed a Bi: (Sr + Ca) ratio range from 0.8:1 to 4 : 1 , indicating the existence of several types of Cu-free phases. XRD showed an overlap of the spectra of 3430, 2110, or 23x0 and 41x0 in accordance with Refs. 24 and 25. The Cu-free phase
B. Heeb et al.: Microstructure of melt-processed Bi2Sr2CaCii2Oj, and reaction mechanisms
in the eutectic structure was always detected as the phase 23x0 with x = 0.9. The amorphous phase (D) in the most rapidly cooled sample showed a cation stoichiometry of 1.3 :1.2:0.5 :2.
D. Solidification sequence
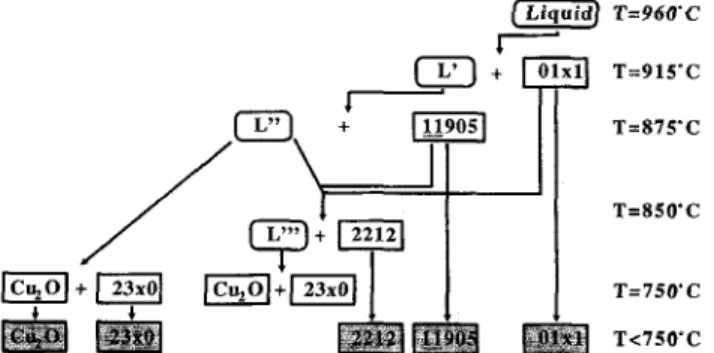
According to these results the solidification se-quences can be given as shown in Fig. 7. The 2212 starting particles melt completely at temperatures above 960 °C. The primary phase Sr0.63Cao.37Cu02 (01x1)
crystallizes at temperatures above 900 °C (at 915 °C at the cooling rate of 10 K/min). The plate-like one-layer phase Bi12,5Sr1o.3Cai.5Cu50;C QJ.905 solid solution)
nucleates on the surface of this phase and grows into the melt. The Cu-rich residual melt L" in Fig. 7 solidifies in a glassy state in the rapidly cooled samples [see Fig. 2(a)]. The cation content in this amorphous phase can be calculated by using the volume fraction and the analyzed concentration for the primary phase and 11905. Neglecting the density differences of the crystalline and amorphous phase, the residual melt L" in sample no. 1 should have a calculated cation ratio of 1.3 : 1 . 4 : 1 . 2 : 2 from the mass balance. The ratio of Bi: Cu in the residual melt is in excellent agreement with the value (1.3:1.2:0.5:2) of the amorphous phase analyzed by EDX. The discrepancies are considerable for Ca and small for Sr. This may be attributed to slight reactions between the melt and the A12O3 crucible, forming
SrCa2Al20A; which was found in small quantities in the
samples. This phase is coincident with the Sr3Al20^
solid solution phase previously reported.26
At the intermediate cooling rate the residual melt
L" forms the Cu-free phase and solidifies to the eutectic
structure of Cu2O and Bi2(Sr2.1Ca0.9)Oz (23x0, x = 0.9)
at the last stage [see Figs. 2(b) and 3].
At low cooling rates (=£1 K/min) the observed phase compositions, especially the two-layer compound 2212, can be formed by two different reaction processes: (1) L" reacts with jJ_905 and the primary phase to form a nonstoichiometric 2212; (2) 2212 precipitates directly from L".
FIG. 7. Schematic diagram of the solidification sequence of the melt with Bi-2212 composition.
If process 1 is predominant, the 2212 grains should grow on the interface JJ_905/liquid. This was indeed observed in SEM-analysis using the backscattering mode where H 9 0 5 and 2212 can be distinguished by a differ-ence in contrast based on the Bi content. Subsequently, we can assume that the following chemical reaction must occur:
a • L" + b • U 9 0 5 (ss) + c • 01x1
—- d • 2212 + e • V" Using the volume fraction analysis of these phases in Fig. 3, the coefficients a-e can be determined. In the case of the samples no. 1 and 4, a = 0.50, b = 0.20,
c = 0.05, d = 0.60, and e = 0.14. The exact chemical
compositions were measured by EDX and the cation contents of the dissolving phases (L", JJ.905, 01x1) and the forming phases (2212, L'") were then calculated. The calculation for the left side of the reaction equation resulted in a B i : S r : C a : C u ratio of 1.9:1.9:1.1:2, the right side in 2 . 0 : 1 . 9 : 1 . 1 : 2 . This excellent agree-ment corroborates the formation mechanism according to process 1.
The eutectic structure was pronounced in the samples melted in reduced oxygen partial pressure. Figure 8(a) shows the microstructure of the sample melted and solidified under a p02 = 10~5 atm with the cooling rate of 5 K/min. After precipitation of 01x1 (primary phase) and 1J.905, the Cu-free phase, 23x0
(x = 0.9), precipitated. Finally, the eutectic mixture
of 23x0 (E) and Cu2O (F) solidified. The eutectic
compositional profile is shown in Fig. 8(b) by a line scan (EDX) through the lamellar structure.
E. Post solidification heat treatment
Since the 2212 phase did not precipitate directly out of the melt at 7 K/min, the development of the constitutions of the multiphase sample no. 2 during post heat treatment is interesting because it clarifies the mechanism and kinetics of the formation of the 2212 phase.
At 850 °C, the samples showed partial melting in their microstructure. The specimens annealed at this tem-perature were quenched in air and the volume fractions of the existing phases were analyzed. Figure 9 shows that the 2212 phase was formed to a great extent in the very early stages of the isothermal annealing. This rapid formation of 2212 corresponds to a strong decrease of the volume fractions of the residual amorphous phase or eutectic structure, the Cu-free phases, and the 11905 phase. Therefore, it is evident that the Cu-free phases and the Bi-poor amorphous phase form a Cu-rich liquid at 850 °C in air which reacts with the U.905 and accelerates the formation of the 2212 phase. After prolonged heat treatment (about 10 h) the reaction kinetics are slowed.
100 « Inte n 0) / . / J \ \
V
I
- Bi~J
.
Srr
'..••••••:\ / \ -• - Ca \ \A'
Cu \H V
hi
10 Distance 15 2D (b)FIG. 8. (a) Microstructure (bright field) of the solidified Bi-2212 melt. rm a x = 960 °C, atmosphere = argon, cooling rate = 5 K/min.
Phases: E: 23x0 (x = 0.9), F: Cu2O. (b) EDX line scan profiles
through the eutectic structure of (a), showing the alternation of CU2O and the Cu-free (Bi-, Sr-, and Ca-containing) phase 23x0.
When this rate decrease occurred, the amount of the alkali-earth-cuprates began to decrease.
These observations indicate a change in the reaction kinetics. The rapid formation of 2212 and the occur-rence of partial melting at the beginning indicate a fast solid/liquid reaction of the re-formed liquid with the one-layer compound. When this liquid phase exists only to a very small extent or has disappeared completely, the reaction, 01x1 (primary phase) + one-layer compound —• 2212, becomes predominant. This reaction is con-trolled by solid/solid diffusion leading to a markedly slower rate of formation of the 2212 phase. This change in the reaction kinetics can be analyzed by the Avrami equation. In Fig. 10 the volume fraction of 2212 f(t) is shown according to q = 1 — exp(—k • t"), where
q = 1 - lf(t) ~ /(»)]/[/(0) - /(»)]. For / ( « ) = 1
and for /(0) = 0.44 were used. The slope of the straight
C: 01x1, 0x21, 014x24 D: Amorphous Phase / Eutectic E: Cu-free Phases
40 60 80
Annealing Time [h]
100 120
FIG. 9. Phase content versus annealing time. Annealing tempera-ture = 850 °C, atmosphere = air. Phases: C: 01x1, 0x21, 014x24 (optically not separable), D: residual melt or eutectic structure, E: Cu-free phases.
line (exponent n) changes by a factor of 3 after about 9 h, being a strong indication for this change in reaction mechanism and kinetics.
During post solidification heat treatment two other Bi-free phases are formed: 0x21 (x = 0.3) and 014x24
(x = 5.3). According to Refs. 24, 25, and 27 these
phases are in equilibrium with 2212 rather than the 01x1 (primary phase) which is not in equilibrium with 2212. This explains why the 01x1 phase disappeared during heat treatment.
The cation stoichiometry of the 2212 phase changed during the heat treatment. After 24 h annealing at 850 °C it was found to be 2.1:2.0:0.8:2 and is therefore
1.0
^ -1.0
-2.0
-3.0
In t [h]
FIG. 10. Avrami-plot of the volume fraction of the 2212 phase showing the change of reaction mechanism: solid/liquid reaction: 11905 + 01x1 + Cu-rich liquid — 2212 with n = 1.4; solid/solid reaction: 11905 + 01x1 — 2212 with n = 0.44.
B. Heeb ef al.: Microstructure of melt-processed Bi2Sr2CaCu2O:), and reaction mechanisms
closer to 2 : 2 : 1 : 2 compared to the 2212 phase ob-served in the specimen no. 3 directly after the melting process (2.6:2.4:0.8 :2). This analysis shows the ap-proach to the equilibrium conditions and the diffusion of the cations occurring from the impurity phases during annealing.
IV. CONCLUSIONS
Quantitative phase analysis, as well as grain size analysis of the microstructure of melt processed 2212, showed that complete melting occurred above 960 °C in air.
During solidification the one-layer compound 11905 containing a small amount of Ca precipitates on the Bi-free primary phase 01x1 (with x = 0.4) from the nominal 2212 melt. The JJ_905 platelets grow approx-imately normal to the 01x1 phase. At low cooling rates and especially under low oxygen partial pressure, the eutectic solidification of 23x0 (with x = 0.9) and Cu2O was observed. Two-layer 2212 crystals did not
precipitate directly from the melt of 2212 composition but they were formed by the solid (H905, 01x1) + liquid reaction below 890 °C.
During post solidification heat treatment of the sam-ples at 850 °C in air, partial melting was responsible for the fast formation of 2212 by the same solid/liquid reaction. At longer annealing times ( > 9 h), after most of the liquid had reacted, the much slower solid/solid reaction, Sr-Ca-cuprates + H 9 0 5 - • 2212, was pre-dominant. The change of the reaction mechanism was analyzed using the Avrami equation.
The detected composition of the 2212 phase showed a Bi- and Sr-excess and a Ca-deficiency. During post solidification heat treatment the two-layer material in-creased in volume fraction dramatically and changed stoichiometry. After 24 h the original starting compo-sition was nearly reached except for a Ca deficiency of 20%.
ACKNOWLEDGMENTS
The authors gratefully acknowledge the financial support of the Swiss National Science Foundation. They also thank Professor D. Ownby and Dr. R. O. Suzuki for the very important discussions.
REFERENCES
1. S. Jin, JOM (March), 7-12 (1991).
2. J. Tenbrink, M. Wilhelm, K. Heine, and H. Krauth, IEEE Trans. Mag. 27 (2), 1239-1246 (1991).
3. J. Nishino, H. Murakami, S. Yaegashi, and Y. Shiohara, J. Ceram. Soc. Jpn. Int. Ed., 98 (11), 4-11 (1990).
4. R.J. Rayne, L.E. Toth, B.A. Bender, S.H. Lawrence, M.M. Miller, R.J. Soulen, Jr., and G. Candella, J. Mater. Res. 6, 467-472 (1991).
5. J. Bock and E. Preisler, "Melt Processing of Bi-HTC
Superconduc-tors: The Significance of Oxygen for Formation and Properties", Proceedings of the ICMC '90 Topical Conference "High Temper-ature Superconductors, Materials Aspects", May 9-11, 1990 in Garmisch-Partenkirchen (Germany).
6. J. Kase, K. Togano, H. Kumakura, D. R. Dietderich, N. Irisawa, T. Morimoto, and H. Maeda, Jpn. J. Appl. Phys. Lett. 29 (7), L1096-L1099 (1990).
7. D.R. Dietderich, B. Ullmann, H. C. Freyhardt, J. Kase, H. Kumakura, K. Togano, and H. Maeda, Jpn. J. Appl. Phys. Lett. 29 (7), L1100-L1103 (1990).
8. J. M. Brenner, R. S. Feigelson, D. Gazit, and P. N. Peszkin, Mater. Sci. Eng. B5 (3), 351-357 (1990).
9. D. Gazit, P.N. Peszkin, L.V. Moulton, and R.S. Feigelson, J. Cryst. Growth 98, 545-549 (1989).
10. Y. Oka, N. Yamamoto, Y. Tomii, H. Kitaguchi, K. Oda, and J. Takada, Jpn. J. Appl. Phys. Lett. 28 (5), L801-L803 (1989). 11. R. D. Ray II and E. E. Hellstrom, Physica C 175, 255-260 (1991). 12. M. Nakagawa and Y. Shiohara, Advances in Superconductivity II,
edited by T. Ishiguro and K. Kajimura (Springer-Verlag, Tokyo, 1990), pp. 317-320.
13. T. Izumi, T. Oyama, and Y. Shiohara, Advances in
Superconduc-tivity II, edited by T. Ishiguro and K. Kajimura (Springer-Verlag,
Tokyo, 1990), pp. 289-292.
14. Y. Shiohara, M. Nakagawa, T. Suga, K. Ishige, T. Oyama, T. Izumi, S. Nagaya, M. Miyajima, I. Hirabayashi, and S. Tanaka,
Advances in Superconductivity II, edited by T. Ishiguro and K.
Kajimura (Springer-Verlag, Tokyo, 1990), pp. 263-268. 15. M. J. Cima, X. P. Jiang, H. M. Chow, J. S. Haggerty, M. C.
Flem-ings, H. D. Brody, R. A. Laudise, and D.W. Johnson, J. Mater. Res. 5, 1834-1849 (1990).
16. S. Takekawa, H. Nozaki, A. Umezono, K. Kosuda, and M. Kobayashi, J. Cryst. Growth 92, 687-690 (1988).
17. P. Prieto, G. Zorn, R.R. Arons, S. Thierffeldt, M.E. Gomez, B. Kabius, W. Sybertz, and G. Urban, Solid State Commun. 69 (3), 235-240 (1989).
18. H. M. Chow, X. P. Jiang, M. J. Cima, J. S. Haggerty, H. D. Brody, and M.C. Flemings, J. Am. Ceram. Soc. 74 (6), 1391-1396 (1991).
19. Y. Kubo, K. Michishita, Y. Higashida, M. Mizumo, H. Yokoyama, N. Shimizu, E. Inukai, N. Kuroda, and H. Yoshida, Jpn. J. Appl. Phys. Lett. 28 (4), L606-L608 (1989).
20. E. E. Underwood, Quantitative Stereology (Addison-Wesley Pub-lishing Corp., Reading, MA, 1970).
21. M. I. Piope, Differential Thermal Analysis—A Guide to the
Tech-nique and Its Applications (Heyden & Son Ltd., London, 1977),
p. 33.
22. R. D. Ray II and E. E. Hellstrom, Physica C 172, 435-440 (1991). 23. B.S. Hong and T.O. Mason, J. Am. Ceram. Soc. 74 (5),
1045-1052 (1991).
24. K. Schulze, P. Majewski, B. Hettich, and G. Petzow, Z. Metallkde. 81 (11), 836-842 (1990).
25. R.O. Suzuki, S. Kambara, H. Tsuchida, K. Shimizu, and K. Ono,
Advances in Superconductivity II, edited by T. Ishiguro and K.
Kajimura (Springer-Verlag, Tokyo, 1990), pp. 235-238. 26. Phase Diagrams for Ceramists, Nat. Bur. Stand., Am. Ceram.
Soc. VI, No. 6427, 136 (1987).
27. B. Hong, J. Hahn, and T. O. Mason, J. Am. Ceram. Soc. 73 (7), 1965 (1990).