© by
Oldenbourg Verlag,
-0044-3336/89
Progress
in the T-X Phase
Diagram
of the Solid
Solution
CeH2
-CeH3
Part II: Neutron
Diffraction
Investigations. Trihydrides*
K.Conder,
J.Schefer1,
E.Kaldis,
CaiRu-Xiu2
.
Laboratorium für
Festkörperphysik
,
8093Zürich,
Switzerland 1Paul ScherrerInstitute,
PSIOst,
CH-5232Villigen,
Switzerland 2 On leaveofabsence from
University
ofWuhan,
China.In this paper we
present
first neutron diffractioninvestigations
on solid solutionsCeDg—CeDg
prepared
in ourlaboratory.
Several newsuperstructures
have beenfound and the
highlight
of thisinvestigations
is the existence of a non—cubictrihydrides
(CeD^,
CeH^)
which wasproved
bothby X—ray
and neutrondiffractions.
Introduction
Aim of this
investigation
was to support thephase
diagrams
studies of thesystem
CeDg—CeD^
presented
in the Part I of this workusing
neutron diffractionso that information both from the deuterium and the metal sublattice structures
could be
gathered.
The results have shown the existence of several newsuperstructures
for someof whichstructuremodelsareproposed.
For
La,
Ce and Pr bothdihydrides
andtrihydrides
arethought
tocrystallize
inthe same fee
CaFg
structure.However,
this structural characterization of thetrihydrides
was madelong
time ago insamples
with anappreciable
deviation(>5%)
of thestochiometry
and notalways
thehighest
purity.
In this paper wepresent
for the first timesomeevidence that theCeH^
(the
same is trueforLall^)
deviates from the cubic
symmetry,
if it is pure andstoichiometric,
similar to the heavierRE—Hydrides
whicharehexagonal.
Experimental
Some details about the
synthesis
of the deutendes andhydrides
have beenreported
before[1,2]
and in the Part I of this work.The deuterium for thesynthesis
(
AGA Zürich
-purity
99.8%:
N2<60
ppm,~2 <40
ppm,O2<20
ppm andH^O.2%
)
was
additionaly purified by passing through
apalladium
diffusion unit at340°C.
Both
trihydrides
and trideuterides weresynthesized
at500°C.
At this temperature and underH~2
pressure of 6 bar thecomposition
CeD2
^(or
CeH2
^)
is reached.Cooling
(5°C/h)
under constant pressure of 6 bar to roomtemperature
leads tohigher hydrogen
contents.Two methodswereused to
investigate
thephase
relationships:
—
X—ray powder
diffractioninvestigations
at roomtemperature
using
aDebye—Scherrer
camera(
fortrihydrides
andtrideuterides).
—
and for theseven deuterated
samples
available up to now, neutron diffraction inthe range 10<T<350 K. A double axis multicounterdiffractometer
(DMC)
wasusedat the 10 MW SAPHIR reactorof
PSI/Würenlingen,
withafocusing
Ge^
j
single
crystal
monochromator(A=0.1708 nm).
Results and Discussion
First Neutron Diffraction
Investigations
These were
performed
for thecompositions
CeD2
23(293
K),
CeD2 gg(293
and 10K),
CeD2
64(153
and7K)
andCeD2
75(293
and 213K).
Furtherinvestigations
inthe trideuteride
region
arereported
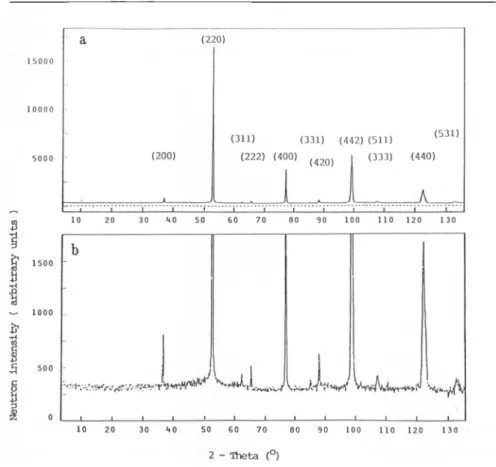
in thenext section.Figure
1 showsanoverview of thespectraofsomeof thesecompositions.
CeD2.23
This
composition
shows at roomtemperature
atetragonal
structure inagreement
withFig.6
ofPart I[7].
This structureis similar to that foundby
Scheferet al[3]
for a
sample
CeD2
2Q at T=4.2 K. Rietveld refinementusing
thetetragonal
spacegroup 14
gives
rathersatisfactory
error factorsRj=0.059
andRwp=0.114
andlattice constants a=b=0.5547 nm and c=l. 1121 nm.
Figure
2 shows the observedintensity
as well as thenegligible
difference between observed and calculatedCeDx
Fm3m
2-Theta [·]
Fig.
1Change
ofthe neutronintensity
(logaritmic)
as afunction of the 20angle
forvarious stoichiometries and
temperatures.
The calculated reflections for thetetragonal
body
centered structureand the cubic Fm3m space group are shown inintensities. An open
question, however,
remains theapplication
of the structuremodel
(14)
whosefully occupied
latticecorresponds
toCeDg
7y for the
composition
ofonly
CeD2
23· Further structure refinements shouldgive
theanswer. vv y w w yywvwvwvwwv^pvw wwvw wv vywwwv obs cale difi _LL 2-Thela
Fig.2
Neutron diffractionspectra
ofCeD2
23 at roomtemperature
(T=293
K).
Tetragonal
space group 14 a=b=0.5547 nm and c=1.1121 nm;agreement
factors:integrated
RT=0.059,
weighted profile
R^^O.114.
At room
temperature
thestructureis cubic(Fm3m),
inagreement
with ourX—ray
data
(see
Part I[7]).
At 10 asuperstructure
is present.Indexing
is on the way now.At 150 a
superstructure
appears, i.e. at thetemperature
where theX-ray
data[7]
cleary
showonly
the cubic structure. The conclusion is that the ceriumsublattice of the
superstructure
must have cubic face centredsymmetry
and that thesuperstructure
appears duetoshifts at thedeuterium atoms. At 15 thesame(220) (200) (311) (331) (412) (511) (531) (222) (400) (420)
jL
(333) (440) _l_1_1— tT 1500i
«1
^ 1000 5 500a
3 10 20 30 >t0 50 60 70 80 90 100 110 120 1 30 10 20 30 "»0 50 60 70 80 90 100 110 120 130 2 -Theta (°)Fig.3
a)
Neutron diffractionspectra
of theCeD2
75 at room
temperature.
Thecubicsymmetry Fm3m is
cleary
shownby
theindexing.
b)
Athigher
resolution,
noimpurity
linesappear in thebackground.
with a=b=0.8719 nm and c=0.5514 nm.
However,
alarger
unit cellmight
benecessary in order tohavea deuteriumoccupancyin
agreement
with the measuredstoichiometry.
CeD275
Figure
3a shows the pure Fm3m cubic structure at roomtemperature,
resulting
from the statistical distribution of deuterium on tetrahedral and octahedral sites
displaced
along
the <111> directions from the idealpositions.
Thespectra
showclearly
that no contamination ispresent
in thesamples
(Fig. 3).
At T=213 astructure with a clear
tetragonal splitting
isexisting
(Fig.4).
This structureis,
however,
different from thetetragonal
one atx=2.23.Indexing
is on the way now.It seems,
therefore,
that the cerium sublattice iscubicupto 2.05(in x),
tetragonal
up to2.6,
cubicup to2.65,
tetragonal
up to2.85and thenagain
cubic.In
general,
the neutron diffraction data are ingood
agreement
with theX-ray
data of
Fig.6
presented
in Part I of this work[7].
i
£] loooo •1
g 5000 fi a e oa
Fig.4
Neutron diffractionspectra
of theCeDg
phase
at T=216 K.Clearly
(in
agreement
withFig.6
of Part I[7])
the structure istetragonal,
as thesplitting
shows
(arrow pairs).
Noncubic Structure of
CeHg_<c
Most
unexpected
was thediscovery
by X—rays
[4]
that thetrihydrides
and trideuterides of cerium(CeH^ g^—CeH^ gg)
are not cubic. We mean, of coursesamples
whosehydrogen
content has beenexactly
(±0.005)
determinedby
thevolumetric method
[5]
and which have beensynthesized
and handled underconditions of very
high
purity.
Figure
5 shows the neutron diffractionspectra
ofCeD2
g7o±o 005 at ^ an(^^
^' ^nenear*v
cubicreflections
are shown inbrackets,
easily recognizable
duetotheir muchhigher
intensities(approx. lOOx).
In addition 11 feeble reflections areshown(broken arrows)
in theangle
range up to120
.
Even more clear
however,
is thechange
ofstructure shown in theX-ray
i
-1-1-1-1-20 40 60 80 100 120 2-Theta [·]
Fig.5
Neutron diffractionspectra
of a trideuteridesample
withcomposition
CeD^
97g±QQQ51 both at T=350K and T=15K. Theindexing
of thequasi-cubic
reflections(solid arrows)
has been done for Fm3m(a=0.549 nm)
but theagreement
between observed and calculated ones isvery bad(Fig.6).
In addition 11 lessstrong
reflectionsareexisting
(see
brokenarrows).
Noappreciable changes
appearbetweenthetwo
temperatures.
For the calculation of the cubic reflections the Fm3m
symmetry
wasassumed,
using
a lattice constant a=0.55250±0.00004 nmextrapolated,
for x=2.97 fromslightly
H—poorer
deutendes.Clearly both,
20 values and calculated intensities showappreciable
differences from the observed ones,indicating
the existence ofCalculated cubic Fm3m Observed
(D—Scherrer]
h k 20intensity
2intensity
1 1 1 200 22 0 3 1 1 2 2 2 40 0 3 1 2 0 2 2 1 1 3 3 4 0 3 1 4 2 0 0 20 3 3 2 2 4 4 5 1 1 1 27.95 32.38 46.45 55.08 57.76 67.79 74.85 77.14 86.16 92.85 92.85 104.12 111.14 113.55 113.55 123.71 132.19 135.28 150.00 169.32 169.32 1000 513 405 451 130 64 184 170 137 117 39 55 215 109 27 123 139 147 74 616 616 26.65 28.17 28.91 32.70 46.71 47.07 54.49 55.61 58.08 68.31 73.79 75.51 77.41 86.50strong
medium medium weekstrong
mediumstrong
medium week week medium medium medium medium notsharp
Table 1Calculated Fm3m for a=0.5525 nm and observed
X-ray
(Debye—Scherrer)
reflections ofthe non cubic trideuteridephase
CeD2
g7U±n 005' shows
clearly
theappreciable
deviations of the observed reflections from the calculated cubicones. Inadditiontothese
nearly
cubicreflexions, however,
severalotherstrong
and mediumreflectionsexist.In
principle,
fourpossible
cases may be considered for theunderstanding
of thenew diffraction
pattern
ofCeHg^:
a)
Contaminationthe Pd—Purifier
adjusted
athigher
temperatures for deuterium diffusion. Severalsamples
synthetized
under these conditions gavereproducible
spectra. A further directproof
of the absenceofcontaminationsisgiven
inFig.3.
TheCeÜ2
sample
which shows
exclusively
only
the cubic reflections has beensynthesized
underexactly
thesamepurity
conditions astheCeÜ2
Qy
sample.
b)
Coexistence of Two Phases.Under this
assumption
andaccording
to the diffraction patterns, one of the twophases
should be cubic and one noncubic. It iseasily
shown that this is not thecase.
Figure
6 shows theattempt
to fit thestrong,
nearly
cubic reflections to the spacegroup Fm3m. For T=350 the error factors areR,=0.11
and R=0.32,
and for T=13 :
Rj=0.097
andRwp=0.26,
in bothcasesunacceptably
high.
Also aninspection
of Table 1 shows thatnocubicphase
can be fitted tothedata.c)
OneSlightly
Noncubic Phase.Our
original
ideawasthat,
similartothe heavierRE—hydrides,
ahexagonal
ceriumtrihydride
might
exist.Indexing
of both neutron andX—ray
spectra
for ahexagonal
lattice gavehigh
R-factors. Calculations with ABCAB and several othersequencesof closed
packed
structuresgavetoomanyreflections. Theindexing
workis continued.
d)
Two Noncubic Phases.The
only
indication for this case comes from NMR—measurements[6].
Measurement ofthe Proton Relaxation Time
Tj
at 40MHz forone ofoursamples
in the
temperature
range 416<T<900 gave twosignals.
Judging
from thehigh
background
of theX—ray
films(in
contrast toH—poorer
samples)
wethought
originally,
that a secondamorphous phase
isexisting
in thesesamples.
However,
theneutrondiffractiondid notshowanamorphous
component.Concluding,
it can be said that the up to nowexisting
evidence indicates asuperstructure
for thetrihydrides
of cerium and lanthanum[4].
How far thissuperstructure
couldproduce
theunexpected
signals
of theproton
resonance is notObs cale din 80 2-Theta -2. w
Fig.6
Difference neutronspectra
0oos~Icaic)
at T=15K for the trideuterideCeDg
97o±o 005' ^edifferenceparticulary
inthe first reflection is verystrong.
References
1. Kaldis
E.,
Boroch E. and TellefsenM.,
J.Less Comm.Metals129,
57(1987).
2. Boroch E. and KaldisE.,
Inorganica
Chimica Acta140,
89(1987).
3. Schefer
J.,
FischerP.,
Hälg
W.,
OsterwalderJ.,
Schlapbach
L. andJorgensen
J.D.,
J.Phys.C:Solid
StatePhys.
17,
1575(1984).
4. Conder . and KaldisE.,
tobepublished.
5. Conder . and Kaldis