Iron deficiency up-regulates iron absorption from ferrous sulphate but not
ferric pyrophosphate and consequently food fortification with ferrous
sulphate has relatively greater efficacy in iron-deficient individuals
Michael B. Zimmermann
1,2*, Ralf Biebinger
1,3, Ines Egli
1, Christophe Zeder
1and Richard F. Hurrell
11Laboratory for Human Nutrition, Institute of Food Science and Nutrition, Swiss Federal Institute of Technology (ETH) Zurich, Schmelzbergstrasse 7, LFV E19, CH-8092 Zurich, Switzerland
2Human Nutrition Division, Wageningen University, Wageningen, The Netherlands 3DSM Nutritional Products, Kaiseraugst, Switzerland
(Received 16 October 2010 – Revised 19 October 2010 – Accepted 27 October 2010 – First published online 17 December 2010)
Abstract
Fe absorption from water-soluble forms of Fe is inversely proportional to Fe status in humans. Whether this is true for poorly soluble Fe compounds is uncertain. Our objectives were therefore (1) to compare the up-regulation of Fe absorption at low Fe status from ferrous sulphate (FS) and ferric pyrophosphate (FPP) and (2) to compare the efficacy of FS with FPP in a fortification trial to increase body Fe stores in Fe-deficient children v. Fe-sufficient children. Using stable isotopes in test meals in young women (n 49) selected for low and high Fe status, we compared the absorption of FPP with FS. We analysed data from previous efficacy trials in children (n 258) to determine whether Fe status at baseline predicted response to FS v. FPP as salt fortificants. Plasma ferritin was a strong negative predictor of Fe bioa-vailability from FS (P, 0·0001) but not from FPP. In the efficacy trials, body Fe at baseline was a negative predictor of the change in body Fe for both FPP and FS, but the effect was significantly greater with FS (P, 0·01). Because Fe deficiency up-regulates Fe absorption from FS but not from FPP, food fortification with FS may have relatively greater impact in Fe-deficient children. Thus, more soluble Fe compounds not only demonstrate better overall absorption and can be used at lower fortification levels, but they also have the added advantage that, because their absorption is up-regulated in Fe deficiency, they innately ‘target’ Fe-deficient individuals in a population.
Key words:Iron deficiency: Absorption: Fortification: Efficacy: Children
Fe fortification of foods can be an effective strategy to control Fe deficiency(1). The relative bioavailability (RBV) of an Fe compound – its estimated percentage absorption relative to the absorption of ferrous sulphate (FS) – is used to rank Fe fortification compounds and to set food fortifica-tion levels(2,3). Ferric pyrophosphate (FPP) is generally less than half as well absorbed as FS(2,3). On this basis, the WHO recommends FS as a first-choice Fe fortificant and recommends that if FPP is used, the fortification level should be doubled(3).
The absorption of dietary Fe is dependent on Fe status; the fractional absorption of an oral Fe dose is greater in Fe-deficient individuals than in Fe-sufficient individuals(4). This is a primary homeostatic mechanism controlling body Fe stores in humans and appears to be regulated by circulating hepcidin concentrations(5). It has been traditionally assumed that up-regulation occurs for all Fe
compounds equally. However, a recent small study has suggested that the absorption of FS in women with poor Fe status was up-regulated to a greater degree than FPP(6). It was unclear whether this effect was due to the special form of FPP – small particles coated with emulsi-fiers – used in the study; the findings need confirmation in studies with commercial FPP. But if true, the RBV of an Fe compound may depend on the Fe status of the indi-vidual/population. This would limit the use of RBV to rank Fe fortification compounds and to adjust fortification levels. It would also argue strongly for the use of soluble compounds in fortified foods in populations with high rates of Fe deficiency.
Therefore, the aim of the present study was to (1) use stable Fe isotopes to compare the up-regulation of Fe absorption at low Fe status from FS and FPP, (2) determine whether the RBV of FPP varies with Fe status and (3)
* Corresponding author: M. B. Zimmermann, email [email protected]
Abbreviations: DMT1, divalent metal transport protein 1; FPP, ferric pyrophosphate; FS, ferrous sulphate; RBV, relative bioavailability; SF, serum ferritin; sTfR, serum transferrin receptor.
qThe Authors 2010
British
Journal
of
compare the relative efficacy of FPP and FS as fortificants to increase body Fe stores in deficient children v. Fe-sufficient children.
Materials and methods Study 1: stable isotope studies
Subjects. A total of forty-nine apparently healthy young women were enrolled: (1) twenty-five women with low Fe status as defined by a plasma ferritin concentration ,25 mg/l with or without anaemia and (2) twenty-four women with Fe sufficiency as defined by plasma ferritin .40 mg/l and a normal Hb concentration ($ 120 g/l). Inclusion criteria for both groups were as follows: age 18 – 40 years; no chronic medical illnesses or medications; body weight # 65 kg; non-pregnant and not planning preg-nancy; no blood donation within the previous 4 months; a C-reactive protein concentration , 50 mg/l (to exclude the potential confounding effect of inflammation). Sample size calculations indicated that twenty-four subjects should be included in both the low and high Fe status groups, based on 80 % power to detect a 50 % difference in Fe absorption with a standard deviation of 8·2 % for log-trans-formed absorption data from previous absorption studies with the same meal.
Study design. On days 1 and 2, the fasting subjects consumed labelled test meals (described below) fed under standardised conditions and close supervision. On one day, the subjects consumed the labelled test meal with 4 mg58Fe as FS, and on the other day, they consumed the same test meal labelled with 4 mg57Fe as FPP, added to the meal at the time of serving. The order of the test meals was randomised across subjects. Deionised water (200 g) was served with the meal. No intake of food and fluids was allowed for 4 h after the test meal intake. At day 16, a fasting blood sample was obtained. If the subjects were taking vitamin/mineral supplements or any other medications other than oral contraceptives, these were stopped for 2 weeks before the study and until the final venepuncture. The present study was conducted according to the guidelines laid down in the Declaration of Helsinki, and all procedures were approved by the review committee at ETH Zu¨rich. Written informed consent was obtained from all subjects.
Test meal. The test meal was boiled white rice (50 g dry weight) and 25 g (fresh weight) vegetable sauce. The sauce (44 % Chinese cabbage, 22 % carrots, 22 % zucchini and 13 % onions) was produced by boiling the vegetables until tender, stir-frying in vegetable oil and then pure´eing. All ingredients were purchased in bulk and used for the entire study. The food portions were kept frozen until use, and each portion was microwaved on the day of feeding.
Isotopic analyses. 58Fe-labelled FS was prepared from isotopically enriched 58Fe (Chemgas, Boulogne, France) by dilution in 0·1M-H2SO4.57Fe-labelled FPP was produced
by Paul Lohmann GmbH (Emmerthal, Germany). The isotopic composition of the stable isotope labels was measured by negative thermal ionisation MS(7,8). Enrich-ment of the isotopic labels was 97·82 % for 57Fe and 92·86 % for 58Fe. Each isotopically enriched blood sample was analysed in duplicate for its Fe isotopic composition by negative thermal ionisation MS using a magnetic sector field mass spectrometer (MAT 262) equipped with a multi-collector system for simultaneous ion beam detec-tion(7,8). Data were normalised for the natural 56Fe:54Fe isotope ratio(9)to correct for mass-dependent fractionation effects in the ion source. Based on the shift of the Fe iso-tope ratios in the blood samples and the amount of Fe cir-culating in the body, the amounts of57Fe and58Fe isotopic label present in the blood 14 d after the test meals were calculated by isotope dilution(8). Circulating Fe was calculated based on the blood, height and weight accor-ding to Brown et al.(10). For the calculation of fractional absorption, 80 % incorporation of the absorbed Fe into erythrocytes was assumed.
Study 2: efficacy studies
Subjects and study design. We did a secondary analysis of two previous efficacy studies of the Fe fortification of iodised salt in northern Morocco, one using FS and another using FPP. The methods and results have been described in detail previously(11,12). In the FS study, Fe was added at a level of 1 mg/g salt using microencapsulated FS (Cap-Shure FS-165E-50; Balchem, Slate Hill, NY, USA)(11). In the FPP study, Fe was added as micronised FPP (article no. 3043448; Dr Paul Lohmann) at a fortification level of 2 mg Fe/g salt(12). The fortification level was set higher because the RBV of FPP is estimated to be approximately 50 % of FS(3).
The design of the two studies was similar. For both studies (1) the salt came from the same local source and was iodised with potassium iodide at 25 mg/g salt, (2) 2 kg of salt was dis-tributed to the participating households monthly for 10 months and (3) the subjects were 6- to 15-year-old children from the same neighbouring primary schools. The studies were done approximately 2 years apart(11,12). The studies were conducted according to the guidelines laid down in the Declaration of Helsinki, and all procedures were approved by the review committee at ETH Zu¨rich and the Ministry of Health in Rabat. Oral informed consent was obtained from all parents of the children. The studies included both Fe-deficient and Fe-sufficient children because all children in the schools were invited to partici-pate in the studies. The children were randomised at the household level into two groups. One group was given iodised salt as a control, while the second group was given the dual-fortified salt with Fe and iodine; the results from the children who received the dual-fortified salt are reported here. At baseline, weight and height were measured, and whole blood was collected by venepuncture
British
Journal
of
for the determination of Hb, serum ferritin (SF) and serum transferrin receptor (sTfR). In both studies, these measures were repeated 10 months later(11,12).
Laboratory analysis
Study 1. Hb was measured in whole blood on the day of collection using an automated coulter counter (AcT8 Coul-ter; Beckman Coulter, Krefeld, Germany) with three-level control materials provided by the manufacturer. The plasma was separated and frozen until analysis. Plasma fer-ritin was measured on an IMMULITEw automatic system (DPC Bu¨hlmann GmbH, Aschwil, Germany); the normal range was 15 – 300 mg/l. High-sensitivity C-reactive protein was measured by using IMMULITE; the normal range was , 100 mg/l.
Study 2. Hb was measured as above using a Coulter counter. SF and sTfR were measured using an ELISA (Ramco, Houston, TX, USA). Normal reference values are as follows: SF, 12 – 300 mg/l; sTfR, 2·9 – 8·5 mg/l. Fe deficiency was defined as either SF , 12 mg/l or sTfR . 8·5 mg/l(1). Anaemia was defined as Hb , 120 g/l in children aged $ 12 years, and Hb , 115 g/l in children aged 5 – 11 years(13). Body Fe was estimated by the method of Cook et al.(14)using the following formula:
Body Fe ðmg=kgÞ ¼ 2ðlogðsTfR=SFÞ 2 2·8229Þ=0·1207: The change in body Fe during the efficacy study was obtained by subtracting the baseline body Fe value from the value at 40 weeks.
Data analysis
Data were analysed using SPSS 13.0 for Windows (SPSS, Chicago, IL, USA) and Excel (XP 2002; Microsoft, Seattle, WA, USA). Results are presented as means and standard deviations if normally distributed. If not normally distribu-ted, results are presented as medians (ranges) and log-transformed for comparisons. The x2 and unpaired t tests were used for comparisons between the groups, and trend line slopes and regressions were done to examine relationships among the variables. P values , 0·05 were considered to be significant.
Results
Table 1 shows the characteristics of the subjects in the low Fe status and Fe-sufficient groups. In the low Fe status group, 66 % of women were Fe deficient (plasma ferritin , 15 mg/l) and 18 % were Fe-deficient anaemic. In the Fe-sufficient group, Hb and plasma ferritin were significantly higher (P, 0·05 and P, 0·0001), while Fe bioavailability from the FS-labelled meal was significantly lower (P, 0·01). However, there was no significant difference in Fe bioavailability from FPP between the
Fe-sufficient and low Fe status groups (Table 1). Table
1 . Age, height, weight, Hb, plasma ferritin (PF), C -reactive protein (CRP), iron absorption a nd relative bioavailability (RBV) from ferrous sulphate (FS)-a nd ferric pyrophosphate (FPP)-labelled test meals in women (n 49) who were iron s ufficient o r w ho had low iron status (Mean v alues, standard deviations, medians a nd ranges) Fe absorption (%) Age (years) Ht (cm) W t (kg) Hb (g/l) PF (m g/l) CRP (mg/l) FS FPP Mean SD Mean SD Mean SD Mean SD Median Range Median Range Median R ange Median Range RBV of FPP Fe sufficient (n 24) 27·7 5·4 165 6 5 6·5 4 ·4 137 8 5 0 4 0 – 76 5 ·0 3 – 3 3 7 ·8 2 ·5 – 17·3 1·0 0 ·4 – 2 ·8 12·8 Low F e status (n 25) 2 6·6 5 ·7 167 5 5 8·2 5 ·1 129* 8 11*** 2 – 2 3 8 ·0 3 – 5 1 1 6·8** 6 ·4 – 33·4 1·4 0 ·4 – 4 ·2 8·3 Values were significa ntly differen t from the Fe-sufficient group: *P , 0·05, ** P , 0·01, ** *P , 0·0001 (unpaired t test).
British
Journal
of
Nutrition
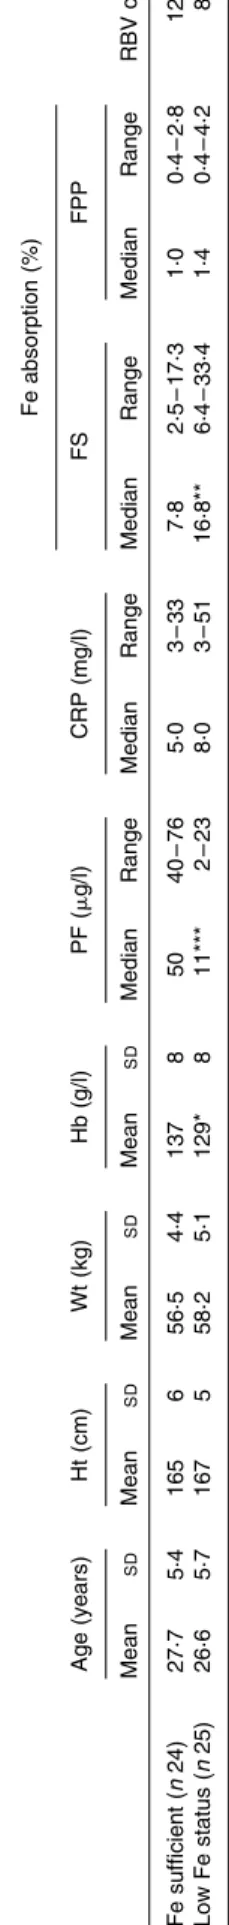
Fig. 1(a) shows the relationships between plasma ferritin and Fe bioavailability from the FS- and FPP-labelled meals. Plasma ferritin was a significant negative predictor of Fe bioavailability from the FS-labelled meal (r2 0·386; P, 0·0001) but not from the FPP-labelled meal. The slope of the trend line for FS was significantly steeper than that of FPP (P, 0·01). As shown in Fig. 1(b), plasma ferritin was a significant positive predictor of the RBV of FPP (r20·156; P, 0·01).
Table 2 shows the characteristics of the children in the two efficacy studies. There were no significant differences between the groups except that the group that received the FS-fortified salt had a higher prevalence of Fe-deficiency anaemia (P, 0·05).
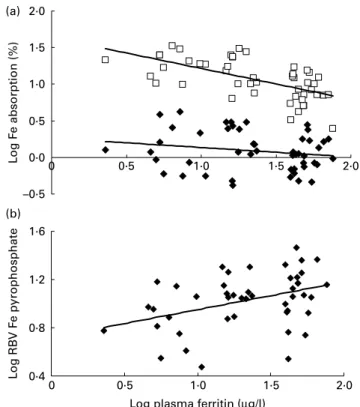
Fig. 2 shows the relationship between body Fe at base-line, calculated from the sTfR:SF ratio, and the change in body Fe during the 10-month studies. Body Fe at baseline was a stronger negative predictor of the change in body Fe during the intervention with FS (r20·467; P, 0·0001) than with FPP (r20·169; P, 0·01). The slope of the trend line for FS was significantly steeper than that of FPP (P, 0·05).
Discussion
FPP is often used to fortify infant cereals and chocolate drink powders(2). Its main advantage is that it causes no
adverse colour and flavour changes. However, it is poorly soluble in both water and dilute acid, including gas-tric juice, and is variably absorbed. Human studies have reported absorption values of 20 – 75 % relative to FS depending on food processing, particle size of the fortifica-tion and crystal structure(2). The RBV of FPP (8·3 – 12·8 %) in the present study is somewhat lower than that reported in previous studies, but is generally consistent with previous results using FPP in rice-based meals(6,15). However, the efficacy of FPP has been demonstrated in salt and rice fortification(12,15 – 17).
Moretti et al.(6) used a dispersible form of submicro-metre-sized FPP in a cross-over design to measure Fe bioa-vailability in young women (n 26) from a wheat-milk infant cereal given with and without ascorbic acid (n 10) and from a processed and unprocessed rice meal (n 16). Of the twenty-six subjects, sixteen were Fe deficient. There was a significant negative correlation between SF and the absorption of FPP from the infant cereal with and without ascorbic acid (r 2 0·77, P¼ 0·010; r 2 0·64, P¼ 0·046, respectively), but in the rice meals, there was no significant relationship. Combining all data, Fe status was a highly sig-nificant positive predictor of the RBV of FPP (r 0·64; P, 0·001)(6). In the present study, in women selected for a broader range of Fe status, including 18 % with Fe-deficiency anaemia, Fe status was again not a significant Table 2. Baseline characteristics of the Moroccan children in the efficacy studies who received either iodised salt fortified with ferric pyrophosphate (FPP) or ferrous sulphate (FS)
(Mean values, standard deviations, medians, ranges, number of children and percentages)
Characteristics
Salt fortified with FPP (n 75)
Salt fortified with FS (n 183) Age (years) Mean 10·8 10·4 SD 2·3 2·5 Sex Female 35 89 Male 40 94 Wt (kg) Mean 31·2 29·5 SD 9·9 9·1 Ht (m) Mean 1·34 1·33 SD 0·14 0·17 Hb (g/l) Mean 113 113 SD 10 13 Serum ferritin (mg/l) Median 16 20 Range 6 – 28 1 – 79
Serum transferrin receptor (mg/l)
Median 7·6 8·6
Range 3·8 – 17·8 4·3 – 17·1
Body Fe (mg/kg)
Median 1·58 2·07
Range 24·35 – 7·19 217·10 – 6·47
Prevalence of Fe-deficiency anaemia
Children (n) 31 64
% 23* 35
* Value was significantly different from the FS group (P, 0·05; x2test).
–0·5 0·0 0·5 1·0 1·5 2·0 0 0·5 1·0 1·5 2·0 L og F e absorption (%) 0·4 0·8 1·2 1·6 0 0·5 1·0 1·5 2·0 L og RB V F e pyrophosphate
Log plasma ferritin (µg/l) (a)
(b)
Fig. 1. (a) Relationships between plasma ferritin and Fe bioavailability from the ferrous sulphate- and ferrous fumarate-labelled rice-based test meals.
Ferrous sulphate: y ¼ 2 0·4228x þ 1·6378; r2 0·3859 and ferrous
pyrophosphate: y ¼ 2 0·1608x þ 0·2976; r2 0·0514. (b) Relationships
between plasma ferritin and Fe bioavailability from the ferrous sulphate- and ferric pyrophosphate-labelled meals. The subjects were forty-nine women selected for a range of Fe status, from Fe-deficiency anaemia to Fe
suffi-ciency. y ¼ 0·2312x þ 0·7191; r20·1558.
British
Journal
of
predictor of Fe bioavailability from the commercial form of FPP commonly used as a food fortificant, and there was no significant up-regulation of Fe absorption from FPP in Fe deficiency. Because of this, Fe status was a significant direct predictor of the RBV of FPP (r20·22), although the prediction was less strong than in the Moretti et al. study(6)(r20·37).
In healthy adults without inflammation, the two main physiological stimuli that increase dietary Fe absorption are a decrease in body Fe stores and an increase in erythro-poiesis(5). Fe absorption is inversely proportional to Fe status in humans over a wide range of body Fe stores, whether stores are measured directly or represented by SF, in both adults(4,18,19) and children(20 – 22). However, in all of these studies, only water-soluble forms of Fe (FS, fer-rous ascorbate and/or ferric citrate) were used to examine the relationship between Fe status and Fe absorption. The present study is the first designed to directly compare the effect of Fe status on the bioavailability of a poorly soluble Fe compound. A strength of the study was the selection of subjects with a wide range of Fe status, from clear Fe sufficiency to Fe-deficiency anaemia. This is important as dietary Fe absorption rises only slowly as storage Fe is depleted, but rises steeply as Fe supply to the marrow is compromised(23).
Non-haem Fe liberation from foods during digestion produces ferrous (Fe2þ) and ferric (Fe3þ) iron; the
equilibrium of these in the gut depends on the reducing power of the meal and other luminal factors, such as the gastric pH(2). Ferric iron can be converted to the ferrous form by food components (such as ascorbic acid) and/or the duodenal ferric reductase, duodenal cytochrome b, on the apical surface of the duodenal enterocyte(24). Fer-rous iron, but not ferric iron, is transported into the enter-ocyte by the apical Fe transporter divalent metal transport protein 1 (DMT1)(24). In duodenal biopsy specimens in human subjects, Fe deficiency results in a 4- to 12-fold increase in DMT1 expression v. normal controls(25 – 27). In these studies, DMT1 levels show significant inverse correlations with SF. In contrast, the effect of Fe status on duodenal cytochrome b expression in humans is unclear(25,26,28). Several studies have reported no signifi-cant up-regulation in Fe deficiency(25,28). Therefore, the stronger up-regulation of Fe absorption from FS compared with FPP in Fe deficiency may be at least partially explained as follows: in Fe-sufficient subjects, low expression of DMT1 becomes an important limiting factor in Fe absorption, reducing differences in absorption due to the varying solubility of the Fe compounds. But duodenal cytochrome b expression is not down-regulated, allowing available ferric iron to be converted to the ferrous form for absorption. In Fe deficiency, DMT1 is strongly up-regulated(25,26,28) and there is ample DMTI on the apical surface, allowing solubility to emerge as the princi-pal limiting factor in Fe absorption. At the same time, duodenal cytochrome b is not strongly up-regulated(25,28), further favouring the absorption of ferrous iron over ferric iron.
Our data suggest that Fe absorption from poorly soluble Fe compounds such as FPP (and possibly elemental Fe compounds) is less well up-regulated by Fe deficiency than Fe absorption from soluble Fe compounds such as FS. Our findings should be confirmed in young children, where the superior organoleptic properties of FPP may be an important consideration. However, they argue that FS should continue to be recommended for the fortification of foods in Fe-deficient populations, while the use of FPP may be less desirable. Compared with poorly soluble com-pounds, more soluble Fe compounds not only demonstrate better overall absorption and can be used at lower fortifica-tion levels, but they also may have the added advantage that, because their absorption is up-regulated in Fe deficiency, they innately ‘target’ Fe-deficient individuals in a population.
Acknowledgements
All authors contributed to the study design, data analysis and writing of the manuscript. R. B., I. E. and C. Z. super-vised the Fe absorption studies, and M. B. Z. and C. Z. supervised the fieldwork in Morocco. C. Z. was responsible for the stable isotope analysis. M. B. Z. wrote the first draft of the manuscript, and all authors contributed to its editing. –6 –4 –2 0 2 4 6 8 10 12 (b) (a) –6 –4 –2 0 2 4 6 8 Change in body F e (mg/k g) –10 –5 0 5 10 15 20 –14 –12 –10 –8 –6 –4 –2 0 2 4 6 8
Baseline body iron (mg/kg)
Change in body F
e
(mg/k
g)
Fig. 2. Relationship between body Fe at baseline, calculated from the serum
transferrin receptor:serum ferritin ratio(16), and the change in body Fe in
Moroccan children during the 10-month efficacy studies of the salt fortified
with (a) ferrous sulphate (n 183); y ¼ 2 0·8495x þ 2·6431; r2 0·4673 or
(b) ferric pyrophosphate (n 75); y ¼ 2 0·4543x þ 3·7082; r20·1689.
British
Journal
of
None of the authors declare any conflicts of interest. The present study was supported by the Swiss Federal Institute of Technology (ETH) Zu¨rich and the Swiss Foun-dation for Nutrition Research, Zu¨rich, Switzerland. We thank the subjects for their participation in the study and J. Tajeri Foman for her assistance with the study.
References
1. Zimmermann MB & Hurrell RF (2007) Nutritional iron
deficiency. Lancet 370, 511 – 520.
2. Hurrell RF (1997) Preventing iron deficiency through food
fortification. Nutr Rev 55, 210 – 222.
3. World Health Organization (2006) Guidelines on Food
Fortification with Micronutrients. Geneva: World Health Organization.
4. Bezwoda WR, Bothwell TH, Torrance JD, et al. (1979) The
relationship between marrow iron stores, plasma ferritin concentrations and iron absorption. Scand J Haematol 22, 113 – 120.
5. Ganz T & Nemeth E (2006) Iron imports IV. Hepcidin
and regulation of body iron metabolism. Am J Physiol Gastrointest Liver Physiol 290, 199 – 203.
6. Moretti D, Zimmermann MB, Wegmuller R, et al. (2006) Iron
status and food matrix strongly affect the relative bioavail-ability of FPP in humans. Am J Clin Nutr 83, 632 – 638.
7. Kastenmayer P, Davidsson L, Galan P, et al. (1994) A double
stable isotope technique for measuring iron absorption in infants. Br J Nutr 71, 411 – 424.
8. Walczyk T, Davidson L, Zavaleta N, et al. (1997) Stable
isotope labels as a tool to determine the iron absorption by Peruvian school children from a breakfast meal. Fresenius J Anal Chem 359, 445 – 449.
9. Taylor PDP, Maeck R & De Bie`vre P (1992) Determination
of the absolute isotopic composition and atomic-weight of a reference sample of natural iron. Int J Mass Spectrom Ion Proc 121, 111 – 125.
10. Brown E, Hopper J, Hodges JL, et al. (1962) Red cell, plasma,
and blood volume in the healthy women measured by radio-chromium cell-labeling and hematocrit. J Clin Invest 41, 2182 – 2190.
11. Zimmermann MB, Zeder C, Chaouki N, et al. (2003) Dual
fortification of salt with iodine and microencapsulated iron: a randomized, double-blind, controlled trial in Moroccan schoolchildren. Am J Clin Nutr 77, 425 – 432.
12. Zimmermann MB, Wegmueller R, Zeder C, et al. (2004) Dual
fortification of salt with iodine and micronized ferric pyro-phosphate: a randomized, double-blind, controlled trial. Am J Clin Nutr 80, 952 – 959.
13. WHO/UNICEF/UNU (2001) Iron Deficiency Anemia
Assess-ment, Prevention, and Control. Geneva: World Health Organization.
14. Cook JD, Flowers CH & Skikne BS (2003) The quantitative
assessment of body iron. Blood 101, 3359 – 3364.
15. Wegmu¨ller R, Camara F, Zimmermann MB, et al. (2006)
Salt dual-fortified with iodine and micronized ground ferric pyrophosphate affects iron status but not
hemo-globin in children in Cote d’Ivoire. J Nutr 136,
1814 – 1820.
16. Moretti D, Zimmermann MB, Muthayya S, et al. (2006)
Extruded rice fortified with micronized ground ferric pyro-phosphate reduces iron deficiency in Indian schoolchildren: a double-blind randomized controlled trial. Am J Clin Nutr 84, 822 – 829.
17. Andersson M, Thankachan P, Muthayya S, et al. (2008) Dual
fortification of salt with iodine and iron: a randomized, double-blind, controlled trial of micronized ferric pyropho-sphate and encapsulated ferrous fumarate in southern India. Am J Clin Nutr 88, 1378 – 1387.
18. Walters GO, Jacobs A, Worwood M, et al. (1975) Iron
absorp-tion in normal subjects and patients with idiopathic hemo-chromatosis: relationship with serum ferritin concentration. Gut 16, 188 – 192.
19. Baynes RD, Bothwell TH, Bezwoda WR, et al. (1987)
Relationship between absorption of inorganic and food iron in field studies. Ann Nutr Metab 31, 109 – 116.
20. Fomon SJ, Nelson SE, Serfass RE, et al. (2005) Absorption
and loss of iron in toddlers are highly correlated. J Nutr 135, 771 – 777.
21. Lynch MF, Griffin IJ, Hawthorne KM, et al. (2007) Iron
absorption is more closely related to iron status than to daily iron intake in 12- to 48-mo-old children. J Nutr 137, 88 – 92.
22. Hicks PD, Zavaleta N, Chen Z, et al. (2006) Iron deficiency,
but not anemia, upregulates iron absorption in breast-fed Peruvian infants. J Nutr 136, 2435 – 2438.
23. Finch C (1994) Regulators of iron balance in humans. Blood
84, 1697 – 1702.
24. Mackenzie B & Garrick MD (2005) Iron imports II. Iron
uptake at the apical membrane in the intestine. Am J Physiol Gastrointest Liver Physiol 289, G981 – G986.
25. Stuart KA, Anderson GJ, Frazer DM, et al. (2003) Duodenal
expression of iron transport molecules in untreated haemo-chromatosis subjects. Gut 52, 953 – 959.
26. Zoller H, Theurl I, Koch RO, et al. (2003) Duodenal
cyto-chrome b and hephaestin expression in patients with iron deficiency and hemochromatosis. Gastroenterology 125, 746 – 754.
27. Kelleher T, Ryan E, Barrett S, et al. (2004) Increased
DMT1 but not IREG1 or HFE mRNA following iron depletion therapy in hereditary haemochromatosis. Gut 53, 1174 – 1179.
28. Gleeson F, Ryan E, Barrett S, et al. (2005) Duodenal Dcytb
and hephaestin mRNA expression are not significantly modulated by variations in body iron homeostasis. Blood Cells Mol Dis 35, 303 – 308.