CD4+ T cell-dependent and CD4+ T cell-independent
cytokine-chemokine network changes in the
immune responses of HIV-infected individuals
The MIT Faculty has made this article openly available.
Please share
how this access benefits you. Your story matters.
Citation
Arnold, K. B., G. L. Szeto, G. Alter, D. J. Irvine, and D. A.
Lauffenburger. “CD4+ T Dependent and CD4+ T
Cell-Independent Cytokine-Chemokine Network Changes in the Immune
Responses of HIV-Infected Individuals.” Science Signaling 8, no. 399
(October 20, 2015): ra104–ra104.
As Published
http://dx.doi.org/10.1126/scisignal.aab0808
Publisher
American Association for the Advancement of Science (AAAS)
Version
Author's final manuscript
Citable link
http://hdl.handle.net/1721.1/108235
Terms of Use
Creative Commons Attribution-Noncommercial-Share Alike
CD4
+T cell–dependent and –independent cytokine-chemokine
network changes in the immune responses of HIV-infected
individuals
Kelly B. Arnold1,*, Gregory L. Szeto1,2,3,4,*, Galit Alter2, Darrell J. Irvine1,2,3,4,5,†, and Douglas A. Lauffenburger1,†
1Department of Biological Engineering, Massachusetts Institute of Technology, Cambridge, MA 02139, USA
2Ragon Institute of MGH, MIT, and Harvard, Cambridge, MA 02139, USA
3The David H. Koch Institute for Integrative Cancer Research, Cambridge, MA 02139, USA 4Department of Materials Science & Engineering, Massachusetts Institute of Technology, Cambridge, MA 02139, USA
5Howard Hughes Medical Institute, Massachusetts Institute of Technology, Cambridge, MA 02139, USA
Abstract
A vital defect in the immune systems of HIV-infected individuals is the loss of CD4+ T cells, resulting in impaired immune responses. We hypothesized that there were CD4+ T cell–dependent and –independent alterations in the immune responses of HIV-1+ individuals. To test this, we analyzed the secretion of cytokines and chemokines from stimulated peripheral blood
mononuclear cell (PBMC) populations from HIV+ donors, healthy donors, and healthy donors with CD4+ T cells experimentally depleted. Multivariate analyses of 16 cytokines and chemokines at 6 and 72 hours after three stimuli (antibody-coated beads to stimulate T cells and R848 or LPS to stimulate innate immune cells) enabled integrative analysis of secreted profiles. Two major effects in HIV+ PBMCs were not reproduced upon depleting CD4+ T cell in healthy PBMCs: (i) HIV+ PBMCs maintained T cell–associated secreted profiles after T cell stimulation; (ii) HIV+ PBMCs showed impaired IFN-γ secretion early after innate stimulation. These changes arose from hyperactive T cells and debilitated natural killer (NK) cell, respectively. Modeling and
experiments showed that early IFN-γ secretion predicted later differences in secreted profiles in vitro. This effect was recapitulated in healthy PBMCs by blocking the interferon-γ (IFN-γ) receptor. Thus, we identified a critical deficiency in NK cell responses of HIV-infected
individuals, independent of CD4+ T cell depletion, which directs secreted profiles. Our findings
†Corresponding author. djirvine@mit.edu (D.J.I.); lauffen@mit.edu (D.A.L.)..
*These authors contributed equally to this work.
Author contributions: K.B.A., G.L.S., D.J.I., and D.A.L. conceptualized and designed this study; K.B.A. and G.L.S. performed
systems analyses; G.L.S. performed all experiments; K.B.A. and G.L.S. prepared the figures; K.B.A., G.L.S., D.J.I., and D.A.L. wrote
HHS Public Access
Author manuscript
Sci Signal. Author manuscript; available in PMC 2015 November 05.
Published in final edited form as:
Sci Signal. ; 8(399): ra104. doi:10.1126/scisignal.aab0808.
Author Manuscript
Author Manuscript
Author Manuscript
illustrate a broad approach for identifying key disease-associated nodes in a multicellular, multivariate signaling network.
Introduction
The human immune system consists of a heterogeneous assembly of cells that controls homeostasis and confers protection against foreign agents. The function of this system relies upon complex immune cell-cell communication networks that convey information among cells in various sites throughout the body. The inherent complexity of these networks has made them difficult to study experimentally, especially in disease states in which multiple cellular alterations may contribute to altered phenotypes or network-level behaviors.
To characterize intercellular communication among immune cells, growing interest has been devoted to immune profiling, with efforts focused on the use of individual cytokines and chemokines, cell-surface receptors, and mRNAs towards improving predictions of immune function in various diseases and interventions. For example, correlation of individual plasma cytokine and chemokine profiles with diseased and healthy states has been commonly used to identify factors that could be decisive in predicting the immune response to pathogens (1-4). Highly multivariate transcriptomic and proteomic signatures have also been valuable for classifying immune responses to vaccines, such as those for influenza, yellow fever, and meningococcus (5-8), and for assessing the quality of cytotoxic T cells for adoptive transfer (9). Transcriptomic and proteomic analysis of signaling events within isolated individual immune cell types (10-12) provides important information about intracellular events. However, these studies typically involve analysis of a specific cell type of interest in isolation, removed from its interactions with other cells in the overall immune network. A second limitation is that such analyses are most often made at a single time point, and thus lack valuable information about the temporal dependence of synergistic crosstalk and feedback effects in immune signaling that can be captured by measurements made over time. Our current understanding of immune function is therefore largely lacking contextual considerations of the broader network of cell-cell interactions that collectively drive cell network behavior.
Because immune system behavior arises from cell-cell interactions, both direct and indirect and between different cell types, unique insights may be derived from examining the overall system output or “top down” measurements and models developed on the basis of
integrative secreted factors gathered from systems of cells in response to well-defined immune challenges. For example, a study in which multivariate analysis of cytokine and chemokine profiles in whole blood from healthy human donors was performed revealed robust stimulus-specific cytokine and chemokine profiles, which defined the range of natural inter-individual variation in healthy immune responses (13). These normal operating ranges may be extremely useful for systematic immunophenotyping and immunomonitoring to quantify shifts in the immune response that occur as a result of diseases or therapies. In addition to this reported use as a predictive classifier in immunophenotyping and
immunomonitoring, we hypothesized that multivariate analysis could also be used to enable inference of the intercellular communication networks that arise from interactions among the
Author Manuscript
Author Manuscript
Author Manuscript
diverse cell types found in common clinical samples, such as peripheral blood mononuclear cells (PBMCs). This would enable determination of the relative importance of multiple cellular and molecular alterations in the systems-level behavior of immune cell networks in disease states. We also envisioned that observations at multiple time points would enable insights into temporally dynamic effects to be made. We thus developed a top-down approach to the analysis of intercellular immune signaling networks focusing on dynamic cytokine and chemokine profiles (including early and late time points) generated from PBMCs in a disease state in response to diverse stimuli that elicit innate or adaptive responses. We analyzed these profiles by multivariate computational modeling rather than by a univariate statistical treatment.
The biological problem we addressed is the relative importance of reduced CD4+ T cell numbers in modulating the immune response of HIV-1–infected individuals to well-defined stimuli, which occurs in the context of simultaneous functional alterations in many different immune cell types. CD4+ T cells are often termed orchestrators of the immune system because of their central action in both soluble factor–mediated and contact-dependent cell-cell communication. HIV infection is a pandemic infectious disease that is characterized by a progressive collapse of the CD4+ T cell compartment. Specifically, end-stage disease (AIDS) is defined by a blood CD4+ T cell count of <200 cells/μl, at which point infected individuals are severely immunocompromised, and susceptible to an array of opportunistic infections that are not effectively controlled (14). CD4+ lymphopenia in AIDS is a disease in which cell-cell communication is disrupted by cell loss and HIV infection processes. Many potential pathogenic mechanisms involving CD4+ T cell loss have been identified (15-17), but it is difficult to parse the contribution of these alterations to immune responses when abnormalities have been reported in nearly every other immune cell type, including natural killer (NK) cells (18, 19), monocytes and macrophages (20, 21), and CD4+ (15, 22) and CD8+ T cells (23-27).
Using multivariate cytokine and chemokine profiles as robust indicators of the overall state of the cell network, we posed the question of how the loss of CD4+ T cells modulates cytokine and chemokine profiles in PBMCs from healthy donors in comparison to the profiles observed in PBMCs from HIV+ donors, which have low CD4+ T cell counts. We tested whether integrative analysis of quantitative signatures of multiple cytokines and chemokines could identify key differences in cytokine and chemokine network behavior after activation with an adaptive stimulus (anti-CD3 and anti-CD28 antibodies to stimulate T cells) or with innate stimuli [R848 to stimulate Toll-like receptor 7 (TLR7) and TLR8 and lipopolysaccharide (LPS) to stimulate TLR4] when comparing PBMCs from HIV+ donors (HIV+ PBMCs) to PBMCs from healthy donors or to healthy donor–derived PBMCs from which CD4+ T cells were depleted experimentally. We used a 16-plex Luminex panel to measure secreted cytokines and chemokines at early (6 hours) and late (72 hours) times after stimulation for all three donor categories and stimuli. Multiple cytokine and chemokine signatures determined by partial least-squares discriminant analysis (PLSDA) identified multivariate differences in cytokine responses based on donor and stimulus type, and a decision tree analysis (DTA) ascertained the most influential early cytokines and
chemokines for differentiating between adaptive-type and innate-type immune responses in
Author Manuscript
Author Manuscript
Author Manuscript
HIV+, CD4+ T cell–depleted, and healthy cohorts of PBMCs: interleukin-2 (IL-2), IL-10, and interferon-γ (IFN-γ). Follow-up experiments discerned the key cell types responsible for these changes. One particular finding was of a critical deficiency in the early secretion of IFN-γ by PBMCs from HIV+ donors, but not by CD4+ T cell–depleted PBMCs from healthy donors, in response to innate stimuli. We found that NK cells were responsible for this deficiency and it served as a predictor of divergences among PBMCs from the different donors in their cytokine and chemokine signatures at later times. Furthermore, the
integrative output of this deficiency was experimentally reproduced by incubating PBMCs from healthy donors with a blocking antibody against the IFN-γ receptor (IFN-γR). Thus, our integrative approach both identified the most influential secreted cytokines that underlie complex heterogeneous immune cell network operation, and enabled the elucidation of specific cellular actors in a disease state.
Results
PLSDA of secreted cytokines enables identification of distinct cytokine and chemokine profiles associated with innate or adaptive immune stimuli
To investigate the role of CD4+ T cell depletion in the immune responses of HIV-infected individuals, we first established a reliable analytical method for relating key aspects of cytokine and chemokine network behavior to donor categories. For our experimental approach, we used three well-defined stimulus types to examine the cytokines and
chemokines secreted by human PBMCs in response to adaptive and innate immune stimuli: beads coated with anti-CD3 and anti-CD28 antibodies (anti-CD3/CD28 beads) to stimulate polyclonal T cells, LPS to activate TLR4 on innate immune cells, and the synthetic
imidazoquinoline compound R848 to activate TLR7 and TLR8 in innate immune cells. LPS and R848 mimic bacterial and viral stimulation, respectively. For each donor and stimulus, we obtained a set of 32 measurements (secretion of 16 cytokines at 6 and 72 hours after stimulation) by Luminex bead-based assays, and compared the three stimulation conditions with unstimulated controls. Considerable donor-to-donor variability was observed in the ranges of individual cytokine and chemokine concentrations that were secreted (Fig. 1, A to D). None of the 32 individual cytokine and chemokine measurements was capable of differentiating all three stimulus conditions and controls with statistical significance (fig. S1 and table S1). In contrast, despite the large donor-to-donor variability in the concentrations of the individual cytokines and chemokines secreted, multivariate analysis identified distinct cytokine and chemokine profiles associated with each stimulus. PLSDA was used to identify, as independent variables (termed “latent variables”, or LVs), weighted linear combinations of individual cytokine and chemokine measurements that most effectively classified the dependent variables (the stimulus types). PLSDA is an especially useful analytical method for gaining biological insight in this setting, because (i) it is a supervised approach, and therefore enables specific identification of cytokine and chemokine profiles associated with various stimuli and donor types, and (ii) latent variables identified by the model are often biologically meaningful (47-48).
Variable importance in projection (VIP) scores can be used to estimate the importance of each cytokine or chemokine in the multivariate cytokine and chemokine profiles identified
Author Manuscript
Author Manuscript
Author Manuscript
by PLSDA models, and were used to eliminate variables that did not contribute to classification (see Materials and Methods). The PLSDA model identified 21 cytokine and chemokine measurements as being useful for distinguishing among the stimulus classes. A reduced PLSDA model using only these 21 cytokine and chemokine measurements was able to distinguish between anti-CD3/CD28–, R848-, and LPS-induced cytokine and chemokine profiles with a calibration accuracy of 95% and a cross-validation accuracy of 89%. Our PLSDA model identified latent variable 1 (LV1), LV2, and LV3 as the three best linear combinations of cytokines and chemokines (or “profiles”) able to differentiate between donors based on stimulus class. This discrimination of stimulus responses is illustrated on a plot showing the projections (termed “scores”) of the cytokine and chemokine
measurements for each donor and each stimulus onto LV1, LV2, and LV3 (Fig. 1, E and F). These three latent variables were able to capture the predominant statistical distribution of the data across all experimental conditions [63% of the variance in the cytokine and chemokine data (“X block”) and 75% of stimulus class variance (“Y block”)] (Fig. 1E). The contribution of individual cytokines and chemokines to each latent variable can be
visualized as loadings (Fig. 1F) in the profiles that were most important for classifying each stimulus.
Side-by-side comparison of the “loadings” and “scores” plots enabled visualization of the integrated cytokine and chemokine signatures most strongly associated with each of the treatment conditions. The plots of scores and loadings (Fig. 1, E to J) indicate that LV1 discriminates innate stimuli from the adaptive stimulus and the unstimulated condition; LV2 differentiates the adaptive condition from all other responses; and LV3 distinguishes the two different innate stimuli from each other. In the scores (Fig. 1E) and loadings (Fig. 1F) graphs, colocalization of the anti-CD3/CD28 scores (Fig. 1E) and the cytokine and chemokine loadings (Fig. 1F) in the negative region of LV1 indicated that the adaptive immune stimulus profile was composed of IL-2 (at 6 and 72 hours), IL-9 (72 hours), IL-17A (6 and 72 hours), IL-5 (6 and 72 hours), IL-4 (6 and 72 hours), and IFN-γ (72 hours), which are all known T cell–derived cytokines. The R848 profile had strong contributions from IL-15 (6 and 72 hours), IL-9 (6 hours), and IL-12p70 (6 hours) (negatively loaded on LV3), whereas the LPS profile contained IL-1β (6 and 72 hours) and IL-18 (6 and 72 hours) (positively loaded on LV3) (Fig. 1F). Positive loadings for IL-6 (6 and 72 hours) and IL-12p70 (72 hours) on LV1 (Fig. 1F) indicated that both were associated with innate stimuli, which scored positively on LV1 (Fig. 1E). As expected, cytokine profiles were far more useful for distinguishing between immune responses than were individually evaluated cytokines. Separate PLSDA models using only the most statistically significant individual cytokines were only 60% accurate for classification compared to the 95% accuracy that was achieved with the VIP cytokine profile (fig. S2). No individual cytokine was able to distinguish among the different immune stimuli.
Although we performed this initial analysis on thawed PBMCs (previously frozen) from five healthy donors (to match the previously frozen HIV+ donor samples that were available), we confirmed the relevance and validity of our approach by testing the measurements from thawed PBMCs on a separate PLSDA model generated from fresh (never frozen) PBMCs from nine additional healthy donors (fig. S3A). Given associated cytokine measurements, the PLSDA model generated from fresh PBMCs accurately predicted the responses of the
Author Manuscript
Author Manuscript
Author Manuscript
five thawed sets of PBMCs to anti-CD3/CD28, R848, and LPS with 95% accuracy (fig. S3A). VIP cytokines and associated loadings (fig. S3B) in the fresh PBMC model were very similar to those of the thawed PBMC model (Fig. 1). One exception was the selection of IFN-α as a VIP cytokine for the responses of fresh PBMCs (fig. S3B), but not the thawed PBMCs (Fig. 1F); a previous study documented the decreased production of type I IFN from thawed PBMCs (28). Thus, we established an integrative experimental and computational approach for identifying multivariate cytokine and chemokine profiles associated with donor source categories and stimuli.
Multivariate cytokine and chemokine profiles reveal altered immune responses in PBMCs from HIV+ patients that are independent of CD4+ T cell loss
We next sought to apply our integrative approach to understand key alterations in the immune cell network that are associated with HIV infection. The loss of CD4+ T cells as
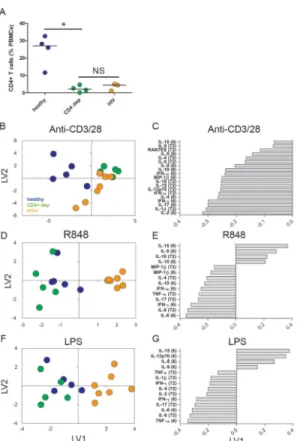
HIV infection progresses to AIDS is the defining feature of immune system deficiency. We therefore designed experiments to answer two fundamental questions. First, what changes in secreted cytokine and chemokine profiles are elicited from healthy PBMCs by adaptive and innate immune stimuli when CD4+ T cells are absent? Second, which of these changes are recapitulated in HIV-infected patients, which have low CD4+ T cell counts? To answer these questions, we depleted CD4+ T cells from healthy PBMCs by positive selection with magnetic beads (“CD4+ dep”), such that CD4+ T cell numbers were similar to those in selected HIV+ donors that had substantially reduced CD4+ T cell counts because of
infection (Fig. 2A). HIV+ donors were selected with CD4 counts < 200 cells/μl (range: 26 to 183) and <10% CD4+ T cells (range: 2 to 8%); donors were also male, on active
antiretroviral (ARV) therapy at the time of sample acquisition, and had either low or high viral loads (table S2). We subsequently compared multivariate cytokine and chemokine responses to adaptive and innate immune stimuli across the three cohorts: untouched PBMCs from healthy donors, donor-matched PBMCs depleted of CD4+ T cells, and PBMCs from HIV+ patients.
To determine multivariate differences in cytokine and chemokine profiles between these three cohorts, we generated three separate PLSDA models (one for each stimulus type) and eliminated those cytokine and chemokine measurements that did not contribute substantially to cohort classification in each model (defined as variables with a VIP score < 1 in the initial model). In all three models, differentiation of profiles from untouched PBMCs from healthy donors, PBMCs depleted of CD4+ T cells, and PBMCs from HIV+ patients classeswas
captured by the first two latent variables (LV1 and LV2), yielding results that were most easily visualized in plots of scores and loadings with two LVs (Fig. 2, B to G). These models are represented in terms of scores plots (Fig. 2, B, D, and F) and loadings plots (Fig. 2, C, E, and G) for each of the stimuli. The multivariate cytokine and chemokine profiles produced by CD4+ T cell–depleted PBMCs stimulated with anti-CD3/CD28 beads were characterized by a near-complete loss of the cytokine and chemokine profile of similarly stimulated healthy PBMCs (IL-2 at 6 hours, IL-4 at 6 and 72 hours, IL-5 at 6 and 72 hours, IL-9 at 6 and 72 hours, and IL-17A at 6 hours), confirming previous studies that identified CD4+ T cells as a predominant secretory population in healthy donors (Fig. 2, B and C) (29).
Author Manuscript
Author Manuscript
Author Manuscript
Whereas the profiles of CD4+ T cell–depleted PBMCs lacked many cytokines (especially early adaptive cytokines, such as IL-4, IL-2, and IL-17 at 6 hours, which were in the top five loadings on LV1), our PLSDA model showed that PBMCs from HIV+ donors partially maintained many of these cytokines when stimulated with anti-CD3/28 beads. This was specifically illustrated by the fact that the responses of all PBMCs from healthy donors in our PLSDA model scored negatively on LV1 (Fig. 2B), co-localizing with early adaptive cytokines, (such as IL-4, IL-2, and IL-17 at 6 hours; Fig. 2C). In contrast, the responses of CD4+ T cell–depleted PBMCs scored positively on LV1, indicating a reduction in the secretion of these cytokines and chemokines (Fig. 2B). PBMCs from HIV+ donors had intermediate scores relative to those of CD4+ T cell–depleted PBMCs and healthy PBMCs on LV1 (including some overlap with both cohorts); thus, they preserved some secretion of cytokines (especially the adaptive cytokines mentioned earlier) in response to stimulation with anti-CD3/CD28 beads compared to CD4+ T cell–depleted PBMCs (Fig. 2B).
In contrast to the response to the adaptive stimulus, the innate immune responses of PBMCs from HIV-infected individuals were distinct from those of healthy PBMCs and CD4+ T cell–depleted PBMCs (Fig. 2, D to G). All of the responses of HIV+ PBMCs scored positively on LV1 in these models, in contrast to the responses of CD4+ T cell–depleted PBMCs and PBMCs from healthy donors, which both scored negatively on LV1 (Fig. 2, D and F). The loadings on LV1 in the R848 and LPS models indicated that the responses of PBMCs from HIV+ donors were characterized by the lack of secretion of many cytokines, including IFN-γ and tumor necrosis factor α (TNF-α), both of which were negatively loaded on LV1, as well as increases in IL-5 and IL-15, both of which were positively loaded on LV1, compared to the responses of healthy PBMCs and CD4+ T cell–depleted PBMCs (Fig. 2, E and G). Thus, the cytokine and chemokine secretory responses of PBMCs from healthy donors triggered by an adaptive stimulus appeared to be somewhat robust to the depletion of CD4+ T cells per se, suggesting that even a relatively low number of CD4+ T cells may be sufficient for proper function of the immune network in the adaptive immune responses of healthy people. In contrast, the immune network of PBMCs from HIV+ patients was impaired in response to innate stimuli in a manner more complex than that predicted by the depletion of CD4+ T cells alone.
Although the numbers of CD4+ T cells were not statistically significantly different between PBMCs from HIV+ individuals and CD4+ T cell–depleted PBMCs from normal donors, we explored whether differences in the percentages of other immune cell types might have caused the alterations in the cytokine and chemokine profiles of the HIV+ PBMCs in response to adaptive and innate immune stimuli. We compared the percentages of CD19+ B cells, CD8+ T cells, monocytes, and NK cells among healthy PBMCs, CD4+ T cell–
depleted PBMCs, and PBMCs from HIV+ donors (fig. S4). We found that HIV+ individuals had trends towards having increased percentages of CD8+ T cells and statistically
significantly decreased percentages of monocytes compared to PBMCs from healthy donors, (fig. S4). Because CD8+ T cells secrete IL-2, IFN-γ, and other T cell–derived cytokines in response to anti-CD3/CD28 stimulation, it is possible that this change could have
contributed to the production of cytokines by HIV+ PBMCs in response to the adaptive immune stimulus. The decreased percentages of monocytes in HIV+ PBMCs could likewise potentially account for the loss of some cytokines in response to innate immune stimuli,
Author Manuscript
Author Manuscript
Author Manuscript
although this was difficult to assess directly for all 14 of the cytokines that differentiated the innate immune responses of HIV+ PBMCs from the other cohorts. We chose to further explore the immune cell types involved in the observed cytokine and chemokine profile changes by first using decision tree analysis (DTA) to determine the most influential cytokines for differentiating the response profiles of HIV+ PBMCs from those of healthy PBMCs and CD4+ T cell–depleted PBMCs. We then used flow cytometry to identify specific immune cell types involved in these influential changes.
The enhanced response of HIV+ PBMCs to adaptive immune stimuli is driven by enhanced IL-2 and IFN-γ secretion by CD4+ and CD8+ T cells
Cytokine profiles identified by PLSDA suggested that PBMCs from HIV-infected individuals partially maintained the ability to secrete cytokines in response to an adaptive immune stimulus, which was lost by CD4+ T cell–depleted PBMCs from healthy donors. We used DTA to identify the most influential cytokines within these profiles that
differentiated HIV+ PBMCs from CD4+ T cell–depleted PBMCs. DTA is a complementary multivariate computational technique that emphasizes contingent, rather than independent, contributions of cytokines and chemokines to classifying diverse conditions of donor sources and stimuli. We applied DTA to the complete data set from the three donor categories and three stimuli. The resulting full tree classified cohort responses to various stimuli with 77% overall classification accuracy, whereas it classified the responses of PBMCs from HIV+ donors to adaptive and innate immune stimuli with 85% accuracy (fig. S5). A decision tree with many nodes is prone to being overfit, and can be affected by noise rather than by actual relationships, resulting in poor predictive value. To prevent overfitting, we performed cross-validation and pruned the tree to minimize both cross-validation and calibration accuracy. This process involved removing lower cytokine nodes that did not contribute to classification during cross-validation. Similar to the full tree (fig. S5), the pruned tree (Fig. 3A) was effective in differentiating among the adaptive immune responses of the three cohorts, as well as for differentiating between the innate immune responses of the HIV+ PBMCS and those of the healthy PBMCs and CD4+ T cell–depleted PBMCs (overall classification accuracy of 94%). However, similar to PLSDA, the pruned treewas not as useful for differentiating between the innate immune responses of the healthy PBMCs and those of the CD 4+ T cell–depleted PBMCs, or between the R848- and LPS-stimulated responses of any cohort (Fig. 3A). Examination of the adaptive immune responses (Fig. 3A, ovals) confirmed the results of the PLSDA; the adaptive immune response of the HIV+ PBMCs clustered closely to that of the PBMCs from healthy donors, whereas the adaptive immune response of the CD4+ T cell–depleted PBMCs were in a different region of the tree (Fig. 3A). DTA identified IL-2 secretion at 6 hours as the primary, most decisive node (at the top of the tree) for the hierarchical discrimination of adaptive cytokine and chemokine profiles, with IFN-γ secretion at 6 hours as the secondary node (Fig. 3A). The adaptive immune responses of CD4+ T cell–depleted PBMCs from four of five donors resulted in the amount of IL-2 secreted at 6 hours being <112 pg/ml, whereas PBMCs from healthy and HIV+ donors all secreted greater amounts of IL-2 at 6 hours.
We next used intracellular cytokine staining and flow cytometric analysis to determine the cell types most responsible for these critical network-level changes. The only statistically
Author Manuscript
Author Manuscript
Author Manuscript
significant differences we found in the amounts of IL-2 and IFN-γ that were secreted across the three cohorts were in the CD4+ T cell compartment, although there were considerable trends in the CD8+ cell compartment. Flow cytometric analysis showed that a greater percentage of anti-CD3/CD28-stimulated PBMCs from healthy donors produced IL-2 at 6 hours than did similarly stimulated CD4+ T cell–depleted PBMCs (Fig. 3, B and C). In contrast, the percentages of CD4+ T cells producing IL-2 at this time point in HIV+ PBMCs were statistically significantly increased (Fig. 3, B and C). We found similar trends for
IFN-γ secretion by CD4+ and CD8+ T cells (Fig. 3, D and E). We found no statistically
significant differences in the percentages of IL-2–producing cells among other immune cell types, including B cells, monocytes, and NK cells, in each of the cohorts (fig. S6). Whereas experimental depletion of CD4+ T cells from the PBMCs of healthy donors reduced the responsiveness of CD8+ T cells, the chronic loss in of CD4+ T cells from the PBMCs of HIV+ patients did not produce an equivalent effect. The percentages of CD8+ T cells were greater in the PBMCs of HIV-infected donors than in the other cohorts (fig. S4), which together could account for some of the observed maintenance of cytokine and chemokine secretion in response to an adaptive immune stimulus. The enhanced responsiveness of CD4+ T cells may contribute to the enhanced production of cytokines by CD8+ T cells during HIV infection, along with other documented changes, such as the increased number of circulating memory cells (30). Whereas the enhanced activation of T cells has been previously documented in HIV infection and pathogenesis (31, 32), our analysis suggests how this increased activation may influence overall cytokine and chemokine profiles, even in the context of the many other alterations in cellular phenotype and frequency present in HIV.
The impaired response of HIV+ PBMCs to innate immune stimuli is driven by the loss of early IFN-γ secretion by NK cells
The cytokine profiles identified by PLSDA suggested that the PBMCs from HIV-infected individuals had a substantial impairment in their responses to innate immune stimuli (R848 and LPS) compared to those of CD4+ T cell–depleted PBMCs. The DTA model described earlier identified the most influential cytokines involved in this impairment. Examination of innate responses (Fig. 3A, squares) indicated that all of the innate immune responses of the HIV+ PBMCs were differentiated from those of healthy PBMCs and CD4+ T cell–depleted PBMCs by a marked reduction in IFN-γ secretion at 6 hours (Fig. 3A; <580 pg/ml), suggesting that PBMCs from HIV+ donors had a substantial deficit in the early IFN-γ response to innate stimuli. Intracellular staining for cytokines showed that this impairment arose from the NK cell compartment. CD56+ NK cells were the major producers of IFN-γ in response to R848 and LPS in healthy PBMCs, and depletion of CD4+ T cells from healthy PBMCs reduced the percentage of responding NK cells by ~33% (Fig. 3F). Because these experiments were performed in the presence of the secretory inhibitor brefeldin A, these data were suggestive of a CD4+ T cell–dependent potentiation of the innate immune responses of the NK cells, which likely occurred through a cell-cell contact mechanism because activation-induced secretion was blocked. The responses of the HIV+ PBMCs were more substantially decreased; less than 1% of all NK cells responded to the innate immune stimuli by secreting IFN-γ (Fig. 3F). We found no statistically significant differences in amounts of IFN-γ secreted by other cell types (including B cells, monocytes, and NK cells)
Author Manuscript
Author Manuscript
Author Manuscript
in response to an adaptive stimulus (fig. S7), suggesting that NK cells were the major cell responsible for the deficient production of IFN-γ by PBMCs from HIV+ donors. Although the percentages of monocytes in PBMCS from HIV+ donors were reduced compared to those in PBMCs from the other cohorts (fig. S3), we did not find any statistically significant differences in the amounts of IFN-γ secreted by monocytes in the HIV+ PBMCs in response to either innate immune stimulus to those of monocytes from the other cohorts (fig. S7. However, there was not a global deficit in cytokine and chemokine production by HIV+ PBMCs in response to innate immune stimuli: PBMCs from all three cohorts showed similar percentages of TNF-α–secreting monocytes (fig. S8). This result suggests that PBMCs from HIV+ donors were not wholly defective in their responses to TLR4 and TLR7/8 stimulation (33).
These results suggested that the NK cells in HIV+ PBMCs had a secretory impairment; however, reduced percentages of monocytes within the PBMCs from HIV+ donors could contribute to this impairment through cell-cell contact mechanisms (PMID: 23316194). There are several alterations in NK cell function that have been reported by studies of HIV-infected individuals, including impairments in the TLR-induced increase in the cell-surface expression of CD69 (an activation marker) and associations between human leukocyte antigen (HLA) receptor and killer-cell immunoglobulin-like receptor (KIR)genetics and susceptibility (18,19). Our results suggest that the further study of NK cells in HIV infection could be especially important relative to other immune cell alterations (including the depletion of CD4+ T cells), because they may be linked to functional deficiencies in IFN-γ secretion and thus could considerably affect the overall immune response to viral and bacterial stimuli.
Additional branches of the full DTA (fig. S5) subsequent to the IFN-γ node distinguished mainly between the responses of healthy PBMCs and CD4+ T cell–depleted PBMCs to innate stimuli, based on IL-15, IL-12p70, and IFN-α, although differentiation of these nodes was much less accurate. IL-10, the other secondary node for adaptive responses,
distinguished between the adaptive immune response of healthy PBMCs and that of HIV+ PBMCs in a single branch. Together, PLSDA, DTA, and flow cytometry identified the secretion of IFN-γ at 6 hours after exposure to an innate immune stimulus as an important hierarchical node in differentiating between the innate immune responses of HIV+ PBMCs and healthy PBMCs.
To determine the sensitivity of our decision tree to the identified cytokine rules, we
performed a sensitivity analysis by iteratively removing each of the three top cytokines rules from the data set before generating another decision tree. Because our original tree correctly classified the adaptive and innate immune responses of the PBMCs from all three cohorts with four cytokine rules, we evaluated the ability of each new decision tree to do the same. We found that when we removed IL-2 (the top node in our original tree), it was replaced by IL-5 (another adaptive cytokine) without any reduction in classification accuracy (fig. S9). This suggests that the enhanced activity of T cells that we observed in HIV+ PMBCs is not limited to increased secretion of IL-2, but may also extend to other adaptive cytokines. In contrast, when we removed IFN-γ from the dataset the classification accuracy of the tree was statistically significantly reduced (48/51 donor responses)in the original tree were
Author Manuscript
Author Manuscript
Author Manuscript
correctly classified as compared to 28/51 when IFN-γ was removed; fig S9). This result further emphasizes the impaired secretion by NK cells of IFN-γ as a critical cytokine node in the altered immune responses of PBMCs from HIV-infected individuals to bacterial and viral stimuli.
Multivariate and prior knowledge models predict that the reduced secretion of IFN-γ by HIV+ PBMCs early in the response markedly influences later cytokine and chemokine profiles
Computational models and flow cytometry experiments indicated that a vital difference in the cytokine and chemokine profiles generated by HIV+ PBMCs in response to innate immune stimuli was the reduction in the secretion of IFN-γ early in the response, and that this deficiency could be attributed predominantly to NK cells. We chose to focus on this result and test whether the divergence in the cytokine and chemokine profiles of the
differently sourced PBMCs after 72 hours of stimulation could be related to this early loss of NK cell–secreted IFN-γ. This would validate the notion that individual cellular and
molecular effects propagate through the cell-cell communication network to achieve broader effects.
For this test, we generated new PLSDA models for R848 and LPS on the basis of only the 72-hour cytokine and chemokine measurements to differentiate among the responses of HIV +, CD4+ T cell–depleted, and healthy PBMCs. VIP scores were used to eliminate cytokines and chemokines that did not contribute strongly to class differentiation. In the R848 model, we found that five of the cytokine and chemokine measurements at 72 hours (TNF-α, IL-6, IL-4, IL-17A, and IL-10) distinguished the responses of HIV+ PBMCs from those of healthy and CD4+ T cell–depleted PBMCs with 88% cross-validation accuracy and 94% calibration accuracy (Fig. 4A). The first two latent variables cumulatively captured 61% of the variance in the cytokine and chemokine data (X block). LV1 separated the responses of the HIV+ PBMCs from those of the CD4+ T cell–depleted and healthy PBMCs, representing the quantitative combination of cytokines and chemokines at 72 hours that best distinguished this group (Fig. 4B). To determine the magnitude and direction of the relationship between the differences in the 72-hour profiles and deficiencies in the secretion of IFN-γ at six hours, we computed Pearson correlation coefficients for the secretion of IFN-γ at six hours and the corresponding score on LV1 of the 72-hour cytokine model across all R848 responses. We found a statistically significant inverse relationship (r = −0.54, P < 0.05), confirming correspondence between the loss of IFN-γ secretion at 6 hour and the divergence in the cytokine and chemokine profiles at 72 hours (table S3). In contrast, there was no significant correlation between any of the cytokines and chemokines at 6 hours that were excluded by VIP in the original model and the scores on LV1 of the 72-hour model (table S3).
With a similar approach for the LPS model (Fig. 4, C and D), we again found a statistically significant correlation between the amount of IFN-γ secreted at 6 hours and the LV1 scores from the 72-hour model (r = −0.55, P < 0.05, table S3), but no significant correlations for the non-VIP cytokines and chemokines (table S3). We did observe statistically significant correlations between other VIP cytokines at 6 hours (especially IL-15 and IL-6) and the 72-hour profiles (table S3); however, this was not surprising given the complex nature of the
Author Manuscript
Author Manuscript
Author Manuscript
cytokine and chemokine signaling networks. Although DTA enabled the identification of IFN-γ as an especially critical node for experimental follow-up, other cytokines are likely to the involved in the dynamic shaping of the cytokine response. Under both stimulus
conditions, divergence of the late profiles involved both innate (TNF-α) and adaptive (IL-4 and IL-17) cytokines (Fig. 4, B and D), which suggests that early deficiencies in NK cells from HIV+ PBMCs substantially affected later cytokine secretion events in both innate and adaptive immune cells. Together, these results suggest that the IFN-γ secreted early in the response plays a critical and dominant role in orchestrating subsequent cytokine and chemokine profiles at later times, especially in response to innate immune stimuli. We used prior knowledge network tools (Ingenuity Pathways Analysis, IPA) to determine whether this finding was consistent with the collective literature. First, we constructed regulatory networks by importing the relative loadings from LV1 of late cytokine and chemokine profiles of each of the R848 and LPS PLSDA models (for R848: IL-10, IL-17A, IL-4, IL-6, and TNF-α; for LPS: IL-17A, IL-1β, IL-2, IL-4, IL-6, and TNF-α). We then used IPA to predict master regulators of the cytokine and chemokine profiles for both innate stimuli and the associated cytokine and chemokine profiles given existing data from immune cells in prior knowledge databases manually curated for Ingenuity Pathways Analysis database. IFN-γ was identified in silico as the top predicted positive regulator shared by both conditions (activation z-scores of 1.96 and 1.94 for R848 and LPS, respectively; Fig. 5A). Cytokine and chemokine regulatory networks constructed with prior knowledge
demonstrated the connectivity between IFN-γ and the late cytokine and chemokine responses to R848 and LPS (Fig. 5, B and C). The multitude of connections (>50) supports our findings that IFN-γ is a potential driver of cytokine and chemokine profiles through multiple direct and indirect two-way interactions, including well-characterized direct downstream mediators of innate immune signaling Janus-activated kinase 3 (JAK3) and signal transducer and activator of transcription 3 (STAT3), as well as multiple TLRs. There also exist substantial numbers of three-way cytokine connections, supporting a complex soluble communication network.
Subsequently, we used these networks from a non-data driven, qualitative starting point by querying the predicted downstream effects of increased IFN-γ using Ingenuity database connections. This perturbation yielded high-confidence predicted increases in the secretion of every cytokine and chemokine in the late R848 and LPS profiles, except for the
negatively loaded nodal regulator IL-10 in the R848 network and the intermediate (not directly measured) cytokines and chemokines IL-8 and IL-27 in the LPS network. Thus, prior knowledge network comparison and in silico modeling of regulatory network perturbations predicted that early activation of IFN-γ could be amplified to initiate a complex late cytokine and chemokine profile, and these results were consistent with and supported our computational (DTA and PLSDA) and experimental analyses.
Receptor blockade experimentally validates the role of early IFN-γ on late cytokine and chemokine profiles
Given the importance of early IFN-γ secretion in both of our data-driven multivariate analyses, we sought to experimentally validate the effects of blocking IFN-γ receptor
(IFN-Author Manuscript
Author Manuscript
Author Manuscript
γR) signaling on the progression of the immune response after R848 and LPS stimulation.
We isolated PBMCs from healthy donors and stimulated them in the presence of either an antibody blocking IFN-γR (34) or the equivalent isotype control, and subsequently measured late cytokine and chemokine secretion profiles in response to R848 and LPS. We
hypothesized that elimination of the hierarchically dominant 6-hour IFN-γ signaling node in healthy PBMCs would cause a shift in the 72-hour profiles along LV1 in both innate models, making them more similar to the profiles of PBMCs from HIV+ individuals. The individual cytokine and chemokine profiles at 72 hours changed as expected in response to IFN-γR blockade, with an average reduction in the amounts of secreted TNF-α, IL-6, IL-4, IL-17A, IL-1β ranging from 10 to 40% (Fig. 6, A and B). Despite the consistent trend for decreased cytokine and chemokine secretion at this late time point, because of donor variability, only IL-17A and TNF-α were secreted at statistically significantly decreased abundances in LPS-treated PBMCs as determined by univariate analyses. We evaluated the multivariate cytokine profiles of these responses by generating a new 72-hour PLSDA model to include the data from the experiments with PBMCs from healthy controls that were subjected to IFN-γR signaling blockade. When we used the VIP cytokine measurements to test the responses of cells in which IFN-γR signaling was blocked, we found that, as hypothesized, the blockade of IFN-γR signaling resulted in a substantial positive shift along LV1 for healthy PBMCs in response to either LPS or R848 (Fig. 6, C to F), which was similar to the responses of HIV+ PBMCs. Thus, these data suggest that IFN-γ is an early nodal orchestrator of cytokine and chemokine profiles that is important in the innate immune responses of PBMCs from healthy donors, but is deficient in PBMCs from HIV+
individuals. Together, these data suggest that early impaired IFN-γ secretion by PBMCs from HIV+ individuals critically affects the shaping of the immune response to innate stimuli, which was experimentally reproduced in healthy PBMCs by blocking IFN-γ from activating its receptor
Discussion
Here, we addressed the question of how the cytokine and chemokine secretion profiles of PBMCs from HIV+ patients induced by well-defined adaptive and innate immune stimuli differed from those of healthy patient PBMCs that were experimentally depleted of CD4+ T cells. PLSDA enabled the integration of many cytokine and chemokine measurements, as well as the identification of relationships between the cytokines and chemokines that were critical for differentiating the three stimuli and cohort responses (Figs. 1 and 2). Moreover, the latent variables in this PLSDA model produced smaller cytokine and chemokine signatures corresponding to each of the permutations, offering information concerning the key cytokine and chemokine subsets that most powerfully characterized each type of response (Fig. 2). DTA enabled the identification of the most influential cytokine and chemokine events in differentiating responses, which facilitated follow-up experiments that identified the cell types responsible for the most critical network-level events.
Surprisingly, PBMCs from HIV+ patients differed from those of healthy donors less than did CD4+ T cell–depleted PBMCs with respect to the cytokines and chemokines, such as IL-2, that are secreted in response to adaptive immune stimuli, but more with respect to those cytokines and chemokines secreted in response to innate immune stimuli, especially
Author Manuscript
Author Manuscript
Author Manuscript
IFN-γ. An appreciation of a vital role for IL-2 in discriminating between the responses of CD4+ T cell-depleted PBMCs and those of PBMCs from healthy donors or HIV+ patients, as well as for IFN-γ in discriminating between the responses of PBMCs from HIV-infected patients and those of PBMCs from healthy donors, was sharpened explicitly by DTA (Fig. 3). Through flow cytometric analysis, we showed that the maintenance by PBMCs from HIV+ patients of a substantial response to an adaptive immune stimulus arose because of the relatively substantial secretion of cytokines by CD8+ T cells together with that by residual CD4+ T cells (Fig. 3, A to E). This may be partially explained by previous studies that showed enhanced activation of immune cells and the skewing of T cell subsets towards memory phenotypes in HIV pathogenesis (35, 36). In contrast, IFN-γ secretion by CD56+ NK cells was the major locus of the compromised secretion of cytokines and chemokines by PBMCs from HIV-infected patients in response to innate immune stimuli (Fig, 3A), which was beyond what would have been expected from the depletion of CD4+ T cells alone (Fig. 3F). Furthermore, a network informatics analysis predicted that the early secretion of IFN-γ is a vital node for the subsequent secretion of cytokines and chemokines in response to innate stimuli, not only by NK cells, but also by other immune cell types in the PBMCs (Figs. 4 and 5). Ultimately, this central role was confirmed by direct experimental tests of the ability of differences in the extent of IFN-γ secretion at 6 hours among the various donor types and stimuli to predict their respective corresponding full cytokine and chemokine signatures at 72 hours (Fig. 6).
The disparities between the responses of PBMCs from HIV+ patients and those of CD4+ T cell–depleted PBMCs from healthy donors could have arisen from synergistic cell-cell interactions (both direct and indirect) within the complex PBMC population. One potential reason for the disparities may be that the depletion of CD4+ T cells from the PBMCs of healthy donors was performed in vitro, whereas the HIV-related effects on CD4+ T cell number occurred in vivo over longer durations. Another potential reason is that the depletion of CD4+ T cells from the healthy donor PBMCs did not involve the viral infection of the CD4+ T cells and the ensuing modifications of cell behavior, although previous studies suggest that this may not be a major pathogenic contributor (37). Both of these potential explanations could be tested in future studies. Additionally, IFN-γR blockade of PBMCs from healthy donors reproduced only some of the phenotype found in HIV+ PBMCs subjected to innate immune stimuli, which suggests that other major signals are at play. A technical issue on this point is the use in our study of frozen PBMC samples, which was required as a control for the handling of the samples from the HIV+ donors. It is conceivable that the freezing procedure altered the cellular processes or cell-cell interactions in a manner that led to the observed disparities; however, this technical limitation is broadly applicable given the nature of cell sampling and the cryopreservation of PBMCs throughout the field. Additionally, we found that the cytokine and chemokine profiles that we measured with fresh (never frozen) PBMCs isolated from healthy donors were similar to those that we measured with thawed PBMCs. Indeed, these profiles were able to predict stimulus responses with 95% accuracy (fig. S2).
Our analyses thus have identified a critical deficit in the response of NK cells in HIV+ PBMCs to innate immune stimuli that was independent of the reduction in CD4+ T cell
Author Manuscript
Author Manuscript
Author Manuscript
numbers, as supported by the inability of experimental depletion of CD4+ T cells from healthy donor PBMCs to fully recapitulate this deficit. This finding adds to the reported HIV-related deficiencies in NK cells. Much of the field has focused on alterations in NK cell receptors, including how HLA and KIR genetics affect the susceptibility of NK cells to HIV infection as well as disease progression (18, 19, 38). Fewer studies have examined the TLR responses of NK cells. NK cells from HIV+ individuals are refractory to TLR7/8 stimulation as determined by measurement of the increased cell-surface abundance of CD69, a marker of activation (39). Our data expand upon these results by showing functional deficiencies in NK cell responses to both TLR4 and TLR7/8 ligands in HIV+ ARV-treated donors. A previous study showed that NK cells are directly activated by LPS to produce IFN-γ (40); however, accessory cell–derived IL-12 is required for IFN-γ production by NK cells in response to R848 (41). Given these divergent mechanisms of NK cell stimulation by innate immune stimuli, we speculate that a major downstream innate signaling node is deficient in NK cells from HIV+ donors, that this node may be sensitized by CD4+ T cells, and that it is largely responsible for the early secretion of IFN-γ. These results echo the communication between NK cells and CD4+ T cells described by Waggoner et al. (42). Furthermore, our findings complement existing knowledge by emphasizing the critical effect of NK cell deficiencies on the impaired innate immune response of HIV-infected individuals, even in the context of CD4+ T cell depletion and many other HIV-associated immune cell alterations that have been previously reported.
Finally, our results implicate early IFN-γ as a critical communication node in network operation in response to innate immune stimuli. Whereas IFN-γ is considered a master regulator cytokine, our analyses suggest its hierarchical importance as a nodal initiator for TLR4 and TLR7/8 responses. Dysregulation of TLR4- and TLR7/8-mediated IFN-γ production is a major concern for any defense against opportunistic co-infections with microbes that stimulate these receptors, including immunopathogenic mechanisms, such as gut microbial translocation in AIDS (which provides systemic TLR4 stimulation), and the response to novel vaccine formulations in HIV that rely on molecular adjuvants that target TLRs (43-45). Together, the nature of innate immune responses in HIV-infected cell networks is of increasing relevance and should be considered in the disease progression and treatment of chronically CD4+ T cell–depleted HIV+ patients. Our results suggest that targeting IFN-γ signaling in NK cells may be a potential therapeutic approach in addressing HIV immunopathogenesis. More broadly, we illustrate the use of an integrative approach to assess the relative importance of multiple disease-related cell alterations in immune responses at the level of the cellular network.
Materials and Methods
Isolation of PBMCs from healthy human donors, depletion of CD4+ T cells, and cryopreservation
Whole blood from healthy human donors was purchased from Research Blood Components. PBMCs were isolated by density centrifugation. Briefly, whole blood was layered on Ficoll-Paque PLUS (GE Healthcare Life Sciences) and centrifuged at 400g for 20 min at room temperature in a swinging bucket rotor. PBMCs were collected from the interface buffer
Author Manuscript
Author Manuscript
Author Manuscript
layer, washed at least twice with Hank’s balanced salt solution supplemented with 2 mM EDTA, and then counted with Trypan blue. For some samples, CD4+ T cells were depleted by positive selection with magnetic beads (Miltenyi Biotec) on LS columns according to the manufacturer’s instructions. CD4+ T cell–depleted (>90% CD4+ T cell depletion with no observed loss of CD4+ monocytes) PBMCs or total PBMCs were suspended at > 10 million cells per ml in freezing medium [90% fetal bovine serum (FBS), 10% DMSO]. Cells were subsequently frozen in controlled-rate containers at −80°C overnight, and then stored in liquid nitrogen until needed for use. These experiments were approved by the MIT Committee On the Use of Humans as Experimental Subjects (protocol #1102004321).
HIV-1–infected donors
Cryopreserved PBMCs were obtained from antiretroviral (ARV)-treated male HIV-1– infected donors with low CD4+ T cell counts (defined as <200 cells/μl). The local and MGH Institutional Review Boards approved the study. Each subject provided written informed consent for participation under the Ragon Institute HIV+ Protocol; 2010P002463; Approval Date: 6/19/2014.
Immune cell stimulation
PBMCs were cultured in 96-well U-bottom plates in R10 medium [RPMI 1640
supplemented with 10% heat-inactivated fetal bovine serum (FBS), HEPES] alone or with anti-CD3/CD28 beads (Life Technologies, 1 bead:2 cells), R848 (1 μg/ml), or LPS (1 μg/ml, Invivogen) (46). All cultures included anti-retroviral agents (5 μM tenofovir, 50 nM
raltegravir; Selleck Chemicals) to prevent viral replication from HIV donors and to account for the immunomodulatory effects of anti-retroviral agents on the stimulation of PBMCs from healthy donors. Supernatants were collected and HIV-1 virus was undetectable by p24 ELISA (Perkin Elmer). For IFN-γR blockade experiments, PBMCs were stimulated with R848 or LPS as described earlier in the presence of either anti-human CD119/IFN-γR α-chain (clone GIR-208) or isotype control mouse IgG1 κ (Biolegend). Both antibodies were used at a final concentration of 50 μg/ml and culture medium was supplemented every day to maintain this concentration of antibody. Cells from each HIV+ donor were run as an independent experiment (batch), whereas CD4+ T cell–depleted PBMCs were analyzed in parallel with whole PBMCs from the same donor (paired batch).
Luminex assays to quantify secreted cytokines
Custom 16-analyte Bio-plex magnetic bead assays were purchased from Bio-Rad. Assays were performed according to the manufacturer’s instructions with minor modifications. Briefly, standard curve ranges were previously optimized to use 20% the recommended concentration of beads and detection antibodies with no loss in standard curve fit. All samples were assayed in duplicate with 20% the manufacturer’s recommended concentrations of beads and detection antibodies; phycoerythrin (PE)-conjugated
streptavidin was used at 1X. Cell culture medium samples were analyzed in batches of 1 to 2 donors (minimum of two batches in each donor cohort), with single-use, manufacturer-validated standard curves run on each plate. We gained confidence in low batch variability by comparing standard curves across Luminex assay plates used in our study. These curves
Author Manuscript
Author Manuscript
Author Manuscript
were similar between batches when comparing background-subtracted mean fluorescent intensity (MFI) vs. concentration (IFN-γ shown in fig. S10).
Flow cytometry and intracellular cytokine staining
PBMCs were stimulated for 8 hours in the presence of 1x brefeldin A (eBioscience) as described earlier. Cells were washed and stained with viability dye (Live/Dead Aqua, Life Technologies), followed by staining of extracellular surface markers with fluorescently conjugated antibodies specific for CD14, CD4, CD8, CD19, and CD56 (BD Biosciences). After washing, the cells were fixed and permeabilized with the Foxp3 / Transcription Factor Staining Buffer Set (eBioscience) according to the manufacturer’s recommendations. Intracellular staining was subsequently performed for IL-2, IFN-γ, and TNF-α with specific antibodies (all from BD Biosciences). Cells were washed again and immediately analyzed on a BD LSR Fortessa HTS flow cytometer. Data were then analyzed with FlowJo v7.6.5 or vX software (Tree Star).
PLSDA and DTA
PLSDA (47, 48) was used to determine multivariate cytokine profiles that best distinguished between the responses of PBMCs to anti-CD3/CD28 beads, R848, and LPS. PLSDA uses co-variance to identify linear combinations of independent variables (in our case 16 cytokines and chemokines at two time points) or latent variables that best differentiate between dependent variables (in our case stimuli class or cohort class). Every sample was assigned a score and visualized in the latent variable space (score plots). We used latent variable loadings (loadings plots) to identify cytokine and chemokine profiles associated with different stimuli or cohort classes. All data were normalized with mean centering and variance scaling before analysis. Cross-validation was performed by iteratively excluding random subsets of data during model calibration and then using excluded data samples to test model predictions. Orthogonal signal correction was used to improve model
interpretability. Feature reduction was performed by calculating variable importance projection (VIP) scores for each cytokine and then removing cytokines with VIP scores <1 from the model. We used DTA (49, 50) to determine the hierarchical importance of cytokine secretion events in classifying the responses of PBMCs from healthy donors, CD4+ T cell-depleted PBMCs, and PBMCs from HIV+ patients to various stimuli. Each set of cytokine and chemokine measurements was labeled based on cohort and stimulus class (healthy-CD3/28, healthy-R848, healthy-LPS, CD4+ dep-(healthy-CD3/28, CD4+ dep R848, CD4+ dep LPS, HIV-CD3/28, HIV-R848, or HIV-LPS). A classification decision tree algorithm (Matlab, MathWorks) (49) was used to predict each class as a function of the 32 cytokine and chemokine measurements made from the corresponding sample. Gini’s diversity index was chosen as the split criterion. Decision tree classification accuracy was determined by comparing the predicted and actual class of each response.
Network analysis and construction
We utilized Ingenuity Pathway Analysis software (Qiagen) to construct regulatory networks based on prior knowledge. Cytokine and chemokine profiles from cells stimulated with R848 or LPS were imported using LV1 loadings from stimulus-specific PLSDA models.
Author Manuscript
Author Manuscript
Author Manuscript
Core analyses were run for each network, and a comparison analysis was used together with the Upstream Regulators module to identify shared, predicted regulators by activation z-scores. Activation z-scores were calculated as previously reported (51). In brief, the activation Z-score for a given node is defined by the equation:
Where N+ and N− are the number of connected edges that are consistent and inconsistent,
respectively, with the activation state of the node, and N is the total number of relationships. After expanding the network to include molecules in LV1 loadings and downstream molecules, we used the Path Explorer tool to link both shortest paths (edges directly connecting nodes) and shortest paths+1 (edges connecting nodes through one intermediate molecule) to connect IFN-γ to all molecules in a downstream network.
Statistical analysis
Data were analyzed for statistical significance with Prism v6.0 software (GraphPad). Raw cytokine data were analyzed univariately by Friedman tests (paired one-way non-parametric ANOVA) treating each time point as an independent data set. Multiplicity adjusted P values were calculated by Dunn’s post-tests. Cell subset compositions between donors and
percentages of cytokine-secreting cells within subsets were analyzed by Kruskal-Wallis tests followed by Dunn’s post-test correcting for multiple comparisons. Multiplicity adjusted P values were reported for all multiple comparisons. Kruskal-Wallis tests followed by Dunn’s post-test were performed for intracellular cytokine responses. P < 0.05 was considered statistically significant. Statistical significance is denoted in the figures.
Supplementary Material
Refer to Web version on PubMed Central for supplementary material.
Acknowledgments
We are grateful to all donors and patients for the samples used in this study. We thank P. Sebastiani (Boston University Medical Center, Department of Biostatistics) for reviewing the statistical analysis used in this work. We also acknowledge Anne-Sophie Dugast (Ragon Institute) for assistance with the acquisition of patient samples and Brian Joughin (MIT) for helpful discussion. Funding: This work was supported in part by the Ragon Institute of MGH, MIT, and Harvard and the NIH (AI6922694). G.L.S. is supported by the National Institutes of Health under the Ruth L. Kirschstein National Research Service Award #F32-CA180586. Resources were also provided by the Koch Institute Support (core) grant P30-CA14051 from the National Cancer Institute. D.J.I. is an investigator of the Howard Hughes Medical Institute. The efforts of K.B.A. and D.A.L. were partially supported by NIH grant U19-AI6922694.
REFERENCES AND NOTES
1. Vaidya SA, Korner C, Sirignano MN, Amero M, Bazner S, Rychert J, Allen TM, Rosenberg ES, Bosch RJ, Altfeld M. Tumor Necrosis Factor alpha Is Associated With Viral Control and Early Disease Progression in Patients With HIV Type 1 Infection. J Infect Dis. 2014; 210:1042–1046. [PubMed: 24688071]
Author Manuscript
Author Manuscript
Author Manuscript
2. Cabral VR, Souza CF, Guimaraes FL, Saad MH. Heterogeneity in human IFN-gamma responses to clinical Mycobacterium tuberculosis strains. J Bras Pneumol. 2010; 36:494–497. [PubMed: 20835598]
3. Geluk A, van Meijgaarden KE, Wilson L, Bobosha K, van der Ploeg-van Schip JJ, van den Eeden SJ, Quinten E, Dijkman K, Franken KL, Haisma EM, Haks MC, van Hees CL, Ottenhoff TH. Longitudinal immune responses and gene expression profiles in type 1 leprosy reactions. J Clin Immunol. 2014; 34:245–255. [PubMed: 24370984]
4. Chang JJ, Woods M, Lindsay RJ, Doyle EH, Griesbeck M, Chan ES, Robbins GK, Bosch RJ, Altfeld M. Higher expression of several interferon-stimulated genes in HIV-1-infected females after adjusting for the level of viral replication. J Infect Dis. 2013; 208:830–838. [PubMed: 23757341] 5. Querec TD, Akondy RS, Lee EK, Cao W, Nakaya HI, Teuwen D, Pirani A, Gernert K, Deng J,
Marzolf B, Kennedy K, Wu H, Bennouna S, Oluoch H, Miller J, Vencio RZ, Mulligan M, Aderem A, Ahmed R, Pulendran B. Systems biology approach predicts immunogenicity of the yellow fever vaccine in humans. Nat Immunol. 2009; 10:116–125. [PubMed: 19029902]
6. Nakaya HI, Wrammert J, Lee EK, Racioppi L, Marie-Kunze S, Haining WN, Means AR, Kasturi SP, Khan N, Li GM, McCausland M, Kanchan V, Kokko KE, Li S, Elbein R, Mehta AK, Aderem A, Subbarao K, Ahmed R, Pulendran B. Systems biology of vaccination for seasonal influenza in humans. Nat Immunol. 2011; 12:786–795. [PubMed: 21743478]
7. Furman D, Hejblum BP, Simon N, Jojic V, Dekker CL, Thiebaut R, Tibshirani RJ, Davis MM. Systems analysis of sex differences reveals an immunosuppressive role for testosterone in the response to influenza vaccination. Proc Natl Acad Sci U S A. 2014; 111:869–874. [PubMed: 24367114]
8. Li S, Rouphael N, Duraisingham S, Romero-Steiner S, Presnell S, Davis C, Schmidt DS, Johnson SE, Milton A, Rajam G, Kasturi S, Carlone GM, Quinn C, Chaussabel D, Palucka AK, Mulligan MJ, Ahmed R, Stephens DS, Nakaya HI, Pulendran B. Molecular signatures of antibody responses derived from a systems biology study of five human vaccines. Nat Immunol. 2014; 15:195–204. [PubMed: 24336226]
9. Rivet CA, Hill AS, Lu H, Kemp ML. Predicting cytotoxic T-cell age from multivariate analysis of static and dynamic biomarkers. Mol Cell Proteomics. 2011; 10:M110 003921. [PubMed: 21193537] 10. Longo DM, Louie B, Putta S, Evensen E, Ptacek J, Cordeiro J, Wang E, Pos Z, Hawtin RE,
Marincola FM, Cesano A. Single-cell network profiling of peripheral blood mononuclear cells from healthy donors reveals age- and race-associated differences in immune signaling pathway activation. J Immunol. 2012; 188:1717–1725. [PubMed: 22246624]
11. Newell EW, Sigal N, Bendall SC, Nolan GP, Davis MM. Cytometry by time-of-flight shows combinatorial cytokine expression and virus-specific cell niches within a continuum of CD8+ T cell phenotypes. Immunity. 2012; 36:142–152. [PubMed: 22265676]
12. Ciofani M, Madar A, Galan C, Sellars M, Mace K, Pauli F, Agarwal A, Huang W, Parkurst CN, Muratet M, Newberry KM, Meadows S, Greenfield A, Yang Y, Jain P, Kirigin FK, Birchmeier C, Wagner EF, Murphy KM, Myers RM, Bonneau R, Littman DR. A validated regulatory network for Th17 cell specification. Cell. 2012; 151:289–303. [PubMed: 23021777]
13. Duffy D, Rouilly V, Libri V, Hasan M, Beitz B, David M, Urrutia A, Bisiaux A, Labrie ST, Dubois A, Boneca IG, Delval C, Thomas S, Rogge L, Schmolz M, Quintana-Murci L, Albert ML. Functional analysis via standardized whole-blood stimulation systems defines the boundaries of a healthy immune response to complex stimuli. Immunity. 2014; 40:436–450. [PubMed: 24656047] 14. W. H. Organization. 2007.
15. Okoye AA, Picker LJ. CD4(+) T-cell depletion in HIV infection: mechanisms of immunological failure. Immunol Rev. 2013; 254:54–64. [PubMed: 23772614]
16. Matloubian M, Concepcion RJ, Ahmed R. CD4+ T cells are required to sustain CD8+ cytotoxic T-cell responses during chronic viral infection. J Virol. 1994; 68:8056–8063. [PubMed: 7966595] 17. Aubert RD, Kamphorst AO, Sarkar S, Vezys V, Ha SJ, Barber DL, Ye L, Sharpe AH, Freeman GJ,
Ahmed R. Antigen-specific CD4 T-cell help rescues exhausted CD8 T cells during chronic viral infection. Proc Natl Acad Sci U S A. 2011; 108:21182–21187. [PubMed: 22160724]
Author Manuscript
Author Manuscript
Author Manuscript
18. Iannello A, Debbeche O, Samarani S, Ahmad A. Antiviral NK cell responses in HIV infection: I. NK cell receptor genes as determinants of HIV resistance and progression to AIDS. Journal of leukocyte biology. 2008; 84:1–26. [PubMed: 18388298]
19. Jost S, Altfeld M. Evasion from NK cell-mediated immune responses by HIV-1. Microbes and infection / Institut Pasteur. 2012; 14:904–915. [PubMed: 22626930]
20. Gekonge B, Giri MS, Kossenkov AV, Nebozyhn M, Yousef M, Mounzer K, Showe L, Montaner LJ. Constitutive gene expression in monocytes from chronic HIV-1 infection overlaps with acute Toll-like receptor induced monocyte activation profiles. PloS one. 2012; 7:e41153. [PubMed: 22815948]
21. Patro SC, Pal S, Bi Y, Lynn K, Mounzer KC, Kostman JR, Davuluri RV, Montaner LJ. Shift in monocyte apoptosis with increasing viral load and change in apoptosis-related ISG/Bcl2 family gene expression in chronically HIV-1-infected subjects. J Virol. 2015; 89:799–810. [PubMed: 25355877]
22. Catalfamo M, Wilhelm C, Tcheung L, Proschan M, Friesen T, Park JH, Adelsberger J, Baseler M, Maldarelli F, Davey R, Roby G, Rehm C, Lane C. CD4 and CD8 T cell immune activation during chronic HIV infection: roles of homeostasis, HIV, type I IFN, and IL-7. J Immunol. 2011; 186:2106–2116. [PubMed: 21257970]
23. Lane HC, Depper JM, Greene WC, Whalen G, Waldmann TA, Fauci AS. Qualitative analysis of immune function in patients with the acquired immunodeficiency syndrome. Evidence for a selective defect in soluble antigen recognition. The New England journal of medicine. 1985; 313:79–84. [PubMed: 2582258]
24. Jones RB, Ndhlovu LC, Barbour JD, Sheth PM, Jha AR, Long BR, Wong JC, Satkunarajah M, Schweneker M, Chapman JM, Gyenes G, Vali B, Hyrcza MD, Yue FY, Kovacs C, Sassi A, Loutfy M, Halpenny R, Persad D, Spotts G, Hecht FM, Chun TW, McCune JM, Kaul R, Rini JM, Nixon DF, Ostrowski MA. Tim-3 expression defines a novel population of dysfunctional T cells with highly elevated frequencies in progressive HIV-1 infection. The Journal of experimental medicine. 2008; 205:2763–2779. [PubMed: 19001139]
25. Trautmann L, Janbazian L, Chomont N, Said EA, Gimmig S, Bessette B, Boulassel MR, Delwart E, Sepulveda H, Balderas RS, Routy JP, Haddad EK, Sekaly RP. Upregulation of PD-1 expression on HIV-specific CD8+ T cells leads to reversible immune dysfunction. Nat Med. 2006; 12:1198– 1202. [PubMed: 16917489]
26. Hasley RB, Hong C, Li W, Friesen T, Nakamura Y, Kim GY, Park JH, Hixon JA, Durum S, Hu Z, Sneller MC, Oguariri R, Imamichi T, Lane HC, Catalfamo M. HIV immune activation drives increased Eomes expression in memory CD8 T cells in association with transcriptional downregulation of CD127. AIDS. 2013; 27:1867–1877. [PubMed: 23965471]
27. Favre D, Mold J, Hunt PW, Kanwar B, Loke P, Seu L, Barbour JD, Lowe MM, Jayawardene A, Aweeka F, Huang Y, Douek DC, Brenchley JM, Martin JN, Hecht FM, Deeks SG, McCune JM. Tryptophan catabolism by indoleamine 2,3-dioxygenase 1 alters the balance of TH17 to regulatory T cells in HIV disease. Science translational medicine. 2010; 2:32ra36.
28. Hillyer P, Mane VP, Schramm LM, Puig M, Verthelyi D, Chen A, Zhao Z, Navarro MB, Kirschman KD, Bykadi S, Jubin RG, Rabin RL. Expression profiles of human interferon-alpha and interferon-lambda subtypes are ligand- and cell-dependent. Immunology and cell biology. 2012; 90:774–783. [PubMed: 22249201]
29. Han Q, Bagheri N, Bradshaw EM, Hafler DA, Lauffenburger DA, Love JC. Polyfunctional responses by human T cells result from sequential release of cytokines. Proc Natl Acad Sci U S A. 2012; 109:1607–1612. [PubMed: 22160692]
30. Roederer M, Dubs JG, Anderson MT, Raju PA, Herzenberg LA. CD8 naive T cell counts decrease progressively in HIV-infected adults. The Journal of clinical investigation. 1995; 95:2061–2066. [PubMed: 7738173]
31. Bastidas S, Graw F, Smith MZ, Kuster H, Gunthard HF, Oxenius A. CD8+ T cells are activated in an antigen-independent manner in HIV-infected individuals. J Immunol. 2014; 192:1732–1744. [PubMed: 24446519]
32. Grossman Z, Meier-Schellersheim M, Paul WE, Picker LJ. Pathogenesis of HIV infection: what the virus spares is as important as what it destroys. Nat Med. 2006; 12:289–295. [PubMed: 16520776]