Characterization of the Vocal Fold Lamina Propria
towards Voice Restoration
by
Mariah Somer Hahn B.S. Chemical Engineering University of Texas at Austin, May 1998
M.S. Electrical Engineering
Stanford University, January 2001
Submitted to the Department of Electrical Engineering and Computer Science in Partial Fulfillment of the Requirements for the Degree of
Doctor of Philosophy in Electrical Engineering and Computer Science. September 2004
0 2004 Massachusetts Institute of Technology. All rights reserved.
The author hereby grants to MIT permission to reproduce and to distribute publicly paper and electronic copies of this thesis document in whole or in part.
/7
-Signature of Author:
Certified by:
Department of Electrical Engineering and Computer Science July 21, 2004
Robert S. Langer Germeshausen Professor, Chemical and Biomedical Engineering Dissertation Supervisor
Accepted by:
Professor Emeritus of
Arthur C. Smith Electrical Engineering an ter Science
Chairman, Committee fT TTUT
OCT
2
3
2004
RT
ARI '
Characterization of the Vocal Fold Lamina Propria
towards Voice Restoration
by
Mariah Somer Hahn
Submitted to the Department of Electrical Engineering and Computer Science on July 21, 2004 in Partial Fulfillment of the Requirements for the Degree of
Doctor of Philosophy in Electrical Engineering and Computer Science
ABSTRACT
During normal speech, human vocal folds sustain greater than 100 high impact collisions each second. When the pliability of this complex biomechanical system is reduced by scarring, voice quality may be compromised. Currently, little can be done to treat patients affected with voice loss or chronic voice impairment due to scarring. Because of the size of the patient population suffering from voice impairment secondary to scarring, alternate treatment methods are currently being actively investigated. An implant-based approach is one strategy for treating lamina propria scarring.
To rationally design an implant material for this purpose, it is important to have a more complete understanding of lamina propria biochemistry and microstructure than is currently in literature. This dissertation presents the following critical insights into normal human lamina propria biochemical structure:
1.) quantitative analysis of collagen, elastin, hyaluronan, and proteoglycan presence;
2.) quantitative examination of the spatial distributions of collagen, elastin, and hyaluronan, and qualitative investigation of the spatial distributions of specific
proteoglycan types; and
3.) assessment of total cellularity and spatial variations in extracellular matrix turnover.
Similar analyses have been carried out on the vocal fold lamina propria of normal dog, pig, and ferret towards identifying an appropriate animal model for implant trials.
Dissertation Supervisor: Robert S. Langer
Vita
Mariah Hahn was born to Janet and Larry Douglas in 1977. She received her Bachelors of Science in chemical engineering from the University of Texas at Austin in May 1998. With her husband's encouragement, she decided to pursue a long-standing interest and apply to graduate school in electrical engineering. She received her Masters of Science in electrical engineering from Stanford in January 2001. In February 2001, she began her doctoral work in electrical engineering and computer science at MIT.
Dedication
To my husband, Juergen, who supported me when I chose to go to graduate school in a different state, even though our time apart was a hardship for us both, and who provided constant encouragement throughout my graduate work. In so many ways, the honor of this degree belongs to us both.
Acknowledgements
I would like to express my gratitude to Prof. Robert Langer and Dr. Steven Zeitels for their
personal and financial support during my research program. I would also like to thank the other members of my dissertation committee, Prof. Freeman and Prof. Grodzinsky, for their time and assistance in helping me complete this work, and the National Science Foundation for financial support during my first three years as a graduate student. I would also like to extend a special thanks to Dr. Rox Anderson, who has often gone out of his way for me, and to Prof. Barry Starcher for analyzing the desmosine levels reported in this dissertation.
A number of people have helped me in this journey - each contributing in substantial ways, even if our interactions were brief. Among these individuals are: Prof. James Kobler, Prof. Robert Hillman, and Diane Jones of the Massachusetts Eye and Ear Infirmary; Constance Beal, Ilda Moura, Prof. Martha Gray, Dr. Robert Marini, Kathyrn Madden, and Kathleen Cormier of MIT. I am indebted to all my colleagues in the Langer lab, but in particular to Jason Fuller, Xinqiao Jia, Joe Seidel, Erin Lavik, Shulamit Levenberg, Ben Teply, Akin Akinc, Greg Zugates, David Lavan, Hyoungshin Park, Thanh-Nga Tran, Tommy Thomas, and Elise Westmeyer. I have also had the help of several great undergraduate researchers, including Cindy Jao, Johanna Salazar-Lazaro, Leila Agha, Rachel Livingston, and Andy Lin. Outside of academia, Deborah Dowd, Nisha Abraham, and Jenny McDonald have encouraged and supported me through difficult times during my PhD and have been wonderful friends. And always, always behind the scenes supporting me has been my husband, Juergen. So many people have come into play to make this day happen for me, and all of them are in my heart.
Table of Contents
Title Page 1 Abstract 2 Vita 3 Dedication 4 Acknowledgements 5 List of Figures 9 List of Tables 11Chapter 1. Motivation and Approach 12
1.1 Introduction to vocal fold anatomy and scarring 12
1.2 Current methods in scar treatment 13
1.3 Current understanding of LP biochemistry and microstructure 14
1.4 Method of approach 15
1.5 Literature cited 16
Chapter 2. Proteoglycans 19
2.1 Introduction 19
2.2 Materials and methods 19
2.2.1 Tissue procurement 19
2.2.2 Tissue preparation for biochemical and histological analysis 20
2.2.3 Biochemical analyses 21
2.2.3.1 Total protein quantification 21
2.2.3.2 sGAG quantification 21
2.2.4 Immunohistochemical analyses 21
2.2.4.1 Antibodies 21
2.2.4.2 Immunohistochemical procedure 23
2.2.5 Immunohistochenical image analysis 24
2.2.5.1 Image capture 24
2.2.5.2 Schematic development 24
2.2.5.3 Semi-quantitative image analysis 25
2.2.6 Statistical analysis 28 2.3 Results 29 2.3.1 Biochemical results 29 2.3.2 Immunohistochemical results 29 2.4 Discussion 35 2.4.1 Biochemical results 35 2.4.2 Immunohistochemical results 35 2.5 Literature cited 38
Chapter 3. Collagen and Fibronectin Glycoproteins 41
3.1 Introduction 41
3.2 Materials and methods
3.2.1 Tissue samples and preparation 3.2.2 Biochemical analyses
3.2.2.1 Tissue digestion and total protein quantitation 3.2.2.2 Total collagen quantitation
3.2.3 Histochemical analyses
3.2.3.1 Immunohistochemical staining 3.2.3.2 Picrosirius staining
3.2.3.2.1 Bright field information 3.2.3.2.2 Cross-polarized information
3.2.4 Histochemical image analysis 3.2.4.1 Image capture
3.2.4.2 Semi-quantitative image analysis 3.2.4.3 Quantitative image analysis
3.2.5 Statistical analysis 3.3 Results 3.3.1 Biochemical results 3.3.2 Histochemical results 3.4 Discussion 3.4.1 Biochemical results 3.4.2 Histochemical results 3.5 Literature cited
Chapter 4. Elastin and Hyaluronan
4.1 Introduction
4.2 Materials and methods
4.2.1 Tissue samples and preparation 4.2.2 Biochemical analyses
4.2.2.1 Tissue digestion and total protein quantitation 4.2.2.2 Desmosine quantitation
4.2.2.3 Hyaluronan quantitation 4.2.3 Histochemical analyses
4.2.3.1 Hyaluronan staining
4.2.3.2 Immunohistochemical staining 4.2.4 Histochemical image analysis
4.2.4.1 Image capture
4.2.4.3 Semi-quantitative image analysis 4.2.4.3 Quantitative image analysis 4.2.5 Statistical analyses 4.3 Results 4.3.1 Biochemical results 4.3.2 Histochemical results 4.4 Discussion 4.4.1 Biochemical results 4.4.2 Histochemical results 41 41 42 42 42 42 42 43 44 44 44 44 45 45 46 46 46 46 54 54 55 56 58 58 58 58 58 58 59 59 59 59 59 61 61 61 61 62 62 62 63 69 69 69 7
4.5 Literature cited
Chapter
5.
Cellularity and Extracellular Matrix Turnover
5.1 Introduction
5.2 Materials and methods
5.2.1 Tissue samples and preparation 5.2.2 Biochemical analyses
5.2.2.1 Tissue digestion and total protein quantitation
5.2.2.2 DNA quantitation
5.2.3 Immunohistochemical analyses
5.2.4 Immunohistochemical image analysis 5.2.4.1 Image capture
5.2.4.2 Semi-quantitative image analysis
5.2.5 Statistical analysis 5.3 Results 5.3.1 Biochemical results 5.3.2 Histochemical results 5.4 Discussion 5.4.1 Biochemical results 5.4.2 Histochemical results 5.5 Literature cited
Chapter 6. Final Observations, Summary, and Recommendations
6.1 Final observations and summary6.1.1 Biochemical results 6.1.2 Microstructural results 6.1.3 Morphological results 6.2 Recommendations
6.3 Literature cited
Chapter 7. Contributions and Future Directions
7.1 Contributions7.2 Future directions 7.3 Literature cited
Appendix A. Optical Coherence Tomography Imaging of the Larynx
A.1 BackgroundA.2 Optical coherence tomography: introduction A.3 OCT imaging of the larynx: preliminary results
A.4 Polarization sensitive optical coherence tomography
A.5 Summary A.6 Literature cited
Appendix B. Vocal Fold Cell Isolation and Culture
B. 1 Introduction B.2 Cell isolation
B.3 Analysis of media types B.4 Recommendations
B.5 Literature cited
List of Figures
1.1 Diagrammatic representation of a coronal section through the
midmembranous human vocal folds 12
2.1 Schematics of repeatedly observed subdivisions within the vocal
fold LP by species 24
2.2 Demonstration of the development of the dog LP schematic 26 2.3 Demonstration of the development of the human LP schematic 27
2.4 Demonstration of the development of the pig LP schematic 27
2.5 Demonstration of the development of the ferret LP schematic 28 2.6 Segmentation of dog, pig, and ferret LP into superficial, intermediate
and deep regions 28
2.7 Total sGAG content by species 29
2.8 Representative staining for versican, decorin, and C4S by species 30
2.9 Representative staining for C6S 31
2.10 Representative staining for KS 31
2.11 Representative staining for biglycan and HS 32
2.12 Semi-quantitative images for versican, decorin, and C4S staining 33 2.13 Semi-quantitative images for C6S, KS, HS, and human biglycan
staining 34
3.1 Total collagen content by species 47
3.2 Total collagen content by gender 47
3.3 Representative picrosirius stained sections viewed under bright
field and cross-polarization 49
3.4 Representative collagen type I and collagen type III staining by species 50 3.5 Representative collagen type IV staining by species 51
3.6 Representative fibronectin staining by species 52 3.7 Semi-quantitative images for total collagen and fibronectin staining 53 3.8 Fraction of overall collagen IOD by region 54
4.1 Desmosine content by species 62
4.2 Hyaluronan content by species 63
4.3 Representative staining for elastin and fibrillin- I by species 65
4.4 Representative alcian blue staining for hyaluronan detection 66
4.5 Semi-quantitative images for elastin, fibrillin- 1, and hyaluronan
staining 67
4.6 Fraction of overall elastin IOD by region 68
4.7 Fraction of overall hyaluronan IOD by region 68
5.1 LP cellularity by species as compared to hyaline cartilage 75 5.2 Representative MMP-1 and tropoelastin staining by species 76 5.3 Representative procollagen type I staining by species 77
5.4 Semi-quantitative images for tropoelastin, MMP- 1, and procollagen
type I staining 78
6.1 Combined LP biochemical results by dry weight 83
A. 1 Correlation of pig vocal fold OCT images with parallel histology 90 A.2 Comparison of PS-OCT and OCT human vocal fold images 92
B. 1 Contaminant cell populations characteristic of dispase-trypsin
isolation procedures 95
B.2 Cell size and morphology by media type 97
List of Tables
2.1 Human specimen information 20
2.2 Pre-treatment and antibody dilution factors 22
3.1 Pre-treatment and antibody dilution factors 43 4.1 Pre-treatment and antibody dilution factors 60
5.1 Pre-treatment and antibody dilution factors 73 6.1 Collagen and elastin in various tissues by dry weight 82
B. 1 Cell number and viability by media type 96
B.2 Cell viability following exposure to prolonged stress 97
Chapter 1. Motivation and Approach
1.1 Introduction to vocal fold anatomy and scarring
The human vocal folds are paired structures roughly 10-15 mm in length and 5mm thick, which are brought into apposition across the airway for sound production. Each vocal fold is a laminated structure consisting of pliable vibratory layer of connective tissue, known as the lamina propria (LP), sandwiched between epithelium and muscle [1]. (See Figure 1.1).
epithelium
lamina propria
vocalis nmscle
Figure 1.1 Diagrammatic representation of a coronal section through the midmembranous human vocal folds
The human LP is often further subdivided into the superficial (SLP), intermediate (ILP), and deep (DLP) layers [2]. These subdivisions have traditionally been based on histologically-observed changes in elastin and collagen concentration within human LP [3]. The intermediate and deep layers, also known as the vocal ligament, are thought to be involved in balancing the tension present in the vocalis muscle with that in the SLP [4]. The SLP is believed to be the region of the vocal fold that sustains the most stress during vibration [5], and most patients suffering from vocal fold scarring have trauma limited to this layer [6]. As air is forced out of the lungs, the muscle and overlying LP of the vocal folds are driven into vibration, creating a quasi-periodic valving of air flow. During normal speech, human vocal folds sustain greater than 100 high impact collisions per second [7]. Thus, the vocal folds are vulnerable to mechanical damage or scarring from overuse and abuse of the voice. Scarred SLP can also result from benign and malignant disease processes requiring ablative surgery or radiation therapy, or from prolonged endotracheal intubation [8]. The altered geometry and increased tissue stiffness associated with vocal fold scarring cause voice changes ranging from hoarseness to complete voice loss. Since little can currently be done to treat patients suffering from voice impairment secondary to scarring and because of the size of this patient population, alternate treatment methods are currently being actively pursued [6,
9-18]. One such alternate approach, and the one which has formed the underlying basis for
this project, is the use of an implant to restore normal function.
This intricate vibratory system has an additional layer of complexity that arises from the high levels of neurological control needed to express emotional states through voice [19]. In fact, voice and mind are so connected that psychological dysfunction can create voice dysfunction in the absence of any vocal fold defect [20]. Or vice versa, the effects of LP abnormalities on fold vibration can be markedly reduced by this same neurological input. This situation has significant implications for the potential of implant-based strategies to restore functionally normal voice as well as for methods that can be used to assess restoration quality. Specifically, LP restoration does not need to be complete for near-complete functional restoration to occur. At the same time, the intimate neurological control of the vocal folds creates ambiguity in the use of phonation-based assessment tools for implant evaluation.
1.2 Current methods in scar treatment
Aspects of vocal fold scarring are currently addressed with a variety of surgical techniques, from scar lysis to tissue replacement with flaps, grafts, and injectable materials [6, 14]. Whereas scar lysis, flaps, and grafts attempt to remove the scar tissue and/or replace it with new tissue, injectable materials are used to augment the amount of "functional" tissue, reducing the impact of the scarred portion on the overall vibration. Effectively, the implant is meant to alter the mass distribution in and pliability of the scarred region of the LP so that normal functionality is restored. Synthetic materials such as Teflon and silicone [21], and biologically-related or derived materials, such as fascia [22], fat [23], and collagen [24], have previously been used as augmentation substances. More recently, patients have been injected with hylaform (hylan b), a modified form of hyaluronan [17].
Important starting points can be gained from these previous research studies, including that:
1.) biodegradable implant materials have generally been resorbed prior to generation of
lasting replacement tissue, and as such restoration has often been temporary; 2.) non-biodegradable implant strategies have generally resulted in foreign body responses over the long term, often exacerbating the scarring and voice dysfunction originally present [6, 14]. Beyond this, however, how voice outcome specifically relates to the chemical and structural properties of a given implant material remains largely unclear, limiting the ability to predict how modification of a given implant material will affect functional outcome.
This lack of clarity arises in part from the reliance on phonation-based assessment tools as common measures of "success" in most of these implant trials. Although these criteria have an intuitive appeal in that the desired output of the implant-"input" into the "host-implant interactions" black-box is functional restoration of voice, relating these phonation-based measures back to the implant material is complicated by the diverse variables that impact voice. The result is that observed vocal range and quality and vibratory behavior cannot be unambiguously correlated with the implant material and, thus, do not clearly indicate how a
material should be changed to improve outcome. This additional level of insight requires objective information concerning cellular level implant-host interactions. It is a goal of this thesis is to identify and develop measurable "outputs" which not only are correlated with vibratory function but also give key insight into implant-host interactions at the cellular and microstructural level.
Two possible "outputs" sets that meet these joint criteria are: 1.) combined quantitative biochemical and histological implant assessment, or 2.) combined biomechanical and histological implant examination. These two sets are linked through the structure-function relationship [25], which essentially states that, given appropriate biochemical composition and microstructural information, a tissue's biomechanical properties can be predicted. Results from implant analysis using either of these "output" sets could then be compared to established benchmarks for normal LP, allowing objective evaluation of implant success and insight into possible implant alterations to improve outcome.
A final comment needs to be made concerning the above listed "output" evaluation sets. It is
important to differentiate the biomechanical properties of the LP from vocal fold vibratory behavior. Vocal fold vibration is a complex interplay between the underlying muscle, the geometry and pliability of the LP, and neurological input. The biomechanical properties of the LP would ideally be independent of the muscle vibratory behavior, vocal fold geometry, and neurological input.
1.3. Current understanding of LP biochemistry and microstructure
In recent decades, a number of histological studies have been published which have significantly advanced the understanding of LP biochemical composition and microstructure. For example, the distributions of total collagen [26-31], elastin, [29, 30, 32-35], and general mucopolysaccharides [34, 36] throughout the human LP have been well studied. Since these molecules have key biomechanical functions, these studies have increased the insight into the structure-function relationship of this tissue [4]. However, quantitative information is still needed to better complete the functional picture sketched by this histological data. In fact, all currently published protein-based biochemical studies of the LP have been qualitative, to the author's knowledge.
A number of researchers have attempted to assess the mechanical properties of the LP. Most
of these studies have performed traditional bulk tensile tests on the LP or have assessed low frequency LP viscoelasticity using cone and plate rheometry [29, 37-40]. However, it is not clear how relevant these biomechanical measurements are in the context of the actual stresses and strains sustained by the vocal fold lamina propria in its normal operating frequency range. For example, it is unclear whether low frequency (<10Hz) data can be extrapolated to make high frequency (>-OOHz) functional assessments. In addition, the relatively complex macroscopic geometry of the LP makes the results from traditional bulk mechanical testing
techniques difficult to interpret reliably.
1.4 Method of approach
Based on initial feasibility studies of biomechanical versus biochemical lamina propria analyses, it was decided to pursue development of biochemical and microstructural / histological benchmarks for normal vocal fold LP towards implant evaluation. Important outcomes from these feasibility studies are discussed in Appendix A.
There are two approaches generally taken to studying tissue biochemistry: protein-based and mRNA-based biochemical techniques. Although mRNA measures have substantial value in elucidating the dynamic state of tissue cellular physiology, there is generally not a one-to-one correlation between mRNA levels of a specific extracellular matrix (ECM) molecule and the concentration of that molecule within the ECM [41]. With respect to first-order implant evaluation schemes, understanding what is quantitatively present in the normal vocal fold LP
ECM is arguably of higher priority than elucidating the dynamic state of the cells. As such,
this thesis will focus on protein-based ECM biochemical quantitation.
The concentration and distribution of the following major biomolecules in the normal human LP will be investigated: (1) total collagen, (2) elastin, (3) hyaluronan, and (4) proteoglycan / associated sulfated glycosaminoglycan side chains. Fibrous proteins, such as collagen and elastin, are of interest in part due to the strong roles these molecules generally play in determining tissue biomechanical function. In particular, collagen contributes to the tensile response of tissue, while elastin tends to dominate the elastic response. Hyaluronan impacts tissue viscous response, and proteoglycans not only serve important regulatory functions by sequestering bioactive molecules [42], but also contribute to tissue biomechanical properties
[25]. Therefore, quantitative study of these ECM molecules should yield insight into the biomechanics of the LP. In addition, since tissue cellularity is altered in a number of physiological and pathological processes, normal human LP total cellularity has been examined.
Since the appropriate choice of animal model is integral to development of restoration strategies applicable to humans, the LPs of several potential animal models have been similarly studied and compared to the human LP. Dogs and pigs are currently two standard animal models in vocal fold research, and hence these animals have been investigated. Ferrets have also been analyzed in the present work for their potential as a small animal model for LP implant studies. Although ferrets have not previously been used for vocal fold research, their large airway relative to their size makes controlled surgical access to their vocal folds feasible. In addition, ferrets appear to phonate more frequently and with greater range than rabbits [43], a small animal that has been used in several recent vocal fold research studies [10, 44].
Chapters 3 and 4 present results from biochemical and immunohistochemical studies of LP proteoglycans and LP collagen and fibronectin, respectively. Chapters 4 and 5 discuss biochemical and histological results for elastin and hyaluronan and for tissue cellularity and turnover, respectively.
Towards future in vitro studies of the interactions of LP cells with various implant materials, methods for isolating vocal fold LP fibroblasts and appropriate media types for LP cell growth and proliferation have been examined, as discussed in Appendix B.
1.5 Literature cited
1. Citardi, M.J., C.L. Gracco, and C.T. Sasaki, The Anatomy of the Human Larynx, in Diagnosis and Treatment of Voice Disorders, J.S. Rubin, R.T. Sataloff, and G.S. Korovin, Editors. 1995, Igaku-Shoin Medical Publishers, Inc.: New York.
2. Gray, S.D., Cellular physiology of the vocal folds. Otolaryngologic Clinics of North America, 2000. 33(4): p. 679-+.
3. Kurita, S., et al., The Layer Structure of the Vocal Fold -Age-Dependent Variations. Folia Phoniatrica, 1980. 32(3): p. 210-210.
4. Hirano, M. and Y. Kakita, eds. Cover-body theory of vocal fold vibration. Speech Science, ed. R. Daniloff. 1985, College-Hill Press: San Diego.
5. Gunter, H.E., A mechanical model of vocal-fold collision with high spatial and temporal resolutions. Journal of the Acoustical Society of America, 2003. 113(2): p.
994-1000.
6. Rosen, C.A., Vocal fold scar - Evaluation and treatment. Otolaryngologic Clinics of North America, 2000. 33(5): p. 108 1-+.
7. Scherer, R.C., Laryngeal Function During Phonation, in Diagnosis and Treatment of Voice Disorders, J.S. Rubin, et al., Editors. 1995, Igaku-Shoin Medical Publishers, Inc: New York.
8. Zeitels, S.M. and G.B. Healy, Medical progress: Laryngology and phonosurgery. New England Journal of Medicine, 2003. 349(9): p. 882-892.
9. Webb, K., et al., Comparison of human fibroblast ECM-related gene expression on elastic three-dimensional substrates relative to two-dimensional films of the same material. Biomaterials, 2003. 24(25): p. 4681-4690.
10. Kriesel, K.J., et al., Treatment of vocal fold scarring: Rheological and histological measures of homologous collagen matrix. Annals of Otology Rhinology and Laryngology, 2002. 111(10): p. 884-889.
11. Woo, P., R. Rahbar, and Z. Wang, Fat implantation into Reinke's space: A histologic and stroboscopic study in the canine. Annals of Otology Rhinology and Laryngology,
1999. 108(8): p. 738-744.
12. Chan, R.W. and I.R. Titze, Hyaluronic acid (with fibronectin) as a bioimplant for the vocal fold mucosa. Laryngoscope, 1999. 109(7): p. 1142-1149.
13. Chan, R.W. and I.R. Titze, Viscosities of implantable biomaterials in vocal fold augmentation surgery. Laryngoscope, 1998. 108(5): p. 725-73 1.
14. Benninger, M.S., et al., Vocal fold scarring: Current concepts and management. Otolaryngology-Head and Neck Surgery, 1996. 115(5): p. 474-482.
15. Thibeault, S.L., et al., Histologic and rheologic characterization of vocal fold scarring. Journal of Voice, 2002. 16(1): p. 96-104.
16. Hallen, L., et al., DiHA (dextranomers in hyaluronan) injections for treatment of insufficient closure of the vocal folds: Early clinical experiences. Laryngoscope, 2001.
111(6): p. 1063-1067.
17. Hertegard, S., et al., Cross-linked hyaluronan used as augmentation substance for treatment of glottal insufficiency: Safety aspects and vocal fold function. Laryngoscope, 2002. 112(12): p. 2211-2219.
18. Huber, J.E., et al., Extracellular matrix as a scaffold for laryngeal reconstruction. Annals of Otology Rhinology and Laryngology, 2003. 112(5): p. 428-433.
19. Benninger, M.S. and C. Schwimmer, Functional Neuroophysiology and Vocal Fold Paralysis, in Diagnosis and Treatment of Voice Disorders, J.S. Rubin, et al., Editors.
1995, Igaku-Shoin Medical Publishers, Inc.: New York.
20. Rosen, D.C. and R.T. Sataloff, Psychological Aspects of Voice Disorders, in Diagnosis and Treatment of Voice Disorders, J.S. Rubin, et al., Editors. 1995, Igaku-Shoin Medical Publishers, Inc.: New York.
21. Rosen, C.A., Phonosurgical vocal fold injection - Procedures and materials. Otolaryngologic Clinics of North America, 2000. 33(5): p. 1087-+.
22. Duke, S.G., et al., Fascia augmentation of the vocal fold: Graft yield in the canine and preliminary clinical experience. Laryngoscope, 2001. 111(5): p. 759-764.
23. Hsiung, M.W., et al., Autogenous fat injection for vocal fold atrophy. European Archives of Oto-Rhino-Laryngology, 2003. 260(9): p. 469-474.
24. Staskowski, P.A., C.N. Ford, and K. Inagi, The histologic fate of autologous collagen injected into the canine vocal fold. Otolaryngology-Head and Neck Surgery, 1998.
118(2): p. 187-190.
25. Fung, Y.C., Biomechanics: Mechanical Properties of Living Tissues. 2 ed. 1993, New York: Springer-Verlag.
26. Hammond, T.H., S.D. Gray, and J.E. Butler, Age- and gender-related collagen distribution in human vocal folds. Annals of Otology Rhinology and Laryngology, 2000. 109(10): p. 913-920.
27. Madruga de Melo, E., et al., Distribution of collagen in the lamina propria of the human vocal fold. Laryngoscope, 2003. 113(12): p. 2187-91.
28. Sato, K., M. Hirano, and T. Nakashima, Age-related changes of collagenous fibers in the human vocal fold mucosa. Annals of Otology Rhinology and Laryngology, 2002.
111(1): p. 15-20.
29. Gray, S.D., et al., Biomechanical and histologic observations of vocal fold fibrous proteins. Annals of Otology Rhinology and Laryngology, 2000. 109(1): p. 77-85.
30. Ishii, K., et al., Age-related development of the arrangement of connective tissue fibers in the lamina propria of the human vocal fold. Annals of Otology Rhinology and Laryngology, 2000. 109(11): p. 1055-1064.
31. Sato, K., Reticular fibers in the vocal fold mucosa. Annals of Otology Rhinology and Laryngology, 1998. 107(12): p. 1023-1028.
32. Sato, K. and M. Hirano, Age-related changes of elastic fibers in the superficial layer of the lamina propria of vocal folds. Annals of Otology Rhinology and Laryngology,
1997. 106(1): p. 44-48.
33. Ximenes, J.A., et al., Histologic changes in human vocal folds correlated with aging:
A histomorphometric study. Annals of Otology Rhinology and Laryngology, 2003.
112(10): p. 894-898.
34. Hammond, T.H., et al., The intermediate layer: A morphologic study of the elastin and hyaluronic acid constituents of normal human vocal folds. Journal of Voice, 1997.
11(1): p. 59-66.
35. Hammond, T.H., et al., Age- and gender-related elastin distribution changes in human vocal folds. Otolaryngology-Head and Neck Surgery, 1998. 119(4): p. 314-322.
36. Pawlak, A.S., et al., Immunocytochemical study of proteoglycans in vocal folds. Annals of Otology Rhinology and Laryngology, 1996. 105(1): p. 6-11.
37. Titze, I.R., Stresses in Vocal-Fold Tissues During Normal Phonation. Journal of the Acoustical Society of America, 1976. 60: p. S64-S64.
38. Titze, I.R., The Physics of Small-Amplitude Oscillation of the Vocal Folds. Journal of the Acoustical Society of America, 1988. 83(4): p. 1536-1552.
39. Chan, R.W. and I.R. Titze, Viscoelastic shear properties of human vocal fold mucosa: Measurement methodology and empirical results. Journal of the Acoustical Society of America, 1999. 106(4): p. 2008-202 1.
40. Chan, R.W. and I.R. Titze, Viscoelastic shear properties of human vocal fold mucosa: Theoretical characterization based on constitutive modeling. Journal of the Acoustical Society of America, 2000. 107(1): p. 565-580.
41. Westermeier, R. and T. Naven, Proteomics in practice : a laboratory manual of proteome analysis. 2002, Weinheim: Wiley-VCH.
42. lozzo, R.V., Matrix proteoglycans: From molecular design to cellular function. Annual Review of Biochemistry, 1998. 67: p. 609-652.
43. Aitkin, L.M., J.E. Nelson, and R.K. Shepherd, Hearing, Vocalization and the External Ear of a Marsupial, the Northern Quoll, Dasyurus-Hallucatus. Journal of Comparative Neurology, 1994. 349(3): p. 377-388.
44. Hertegard, S., et al., Viscoelastic properties of rabbit vocal folds after augmentation. Otolaryngology-Head and Neck Surgery, 2003. 128(3): p. 401-406.
Chapter 2. Proteoglycans
2.1 Introduction
Proteoglycans (PGs) represent a large family of complex molecules composed of core proteins to which sulfated glycosaminoglycan (sGAG) side chains, such as dermatan sulfate
(DS), chondroitin sulfate (CS), keratan sulfate (KS), or heparan sulfate (HS), are attached.
PGs are known to regulate cell adhesion, cell growth, and matrix formation [1], and to influence tissue biomechanical properties [1, 2]. Both the absolute quantities and spatial distributions of PGs types are important in the maintenance of appropriate tissue physiology
[3].
Histological studies on the PG/GAG content of the vocal fold lamina propria (LP) have been published [4, 5] which have advanced the understanding of the normal presence of these molecules. However, significant questions remain. Although the influence of PGs on LP biomechanics has been discussed [5, 6], the degree of this impact is difficult to assess, since the actual concentration of PGs in the LP is currently unknown. Pawlak et al.[5] immunohistochemically analyzed the distributions of decorin, CS, KS, and a heparan sulfate
PG (HSPG) in normal human LP. A primary finding of this study was the intracellular
localization of CS. This is an unusual result which warrants further investigation, since many other loose connective tissues contain this sGAG type throughout the ECM [7]. In addition, the antibody used by Pawlak et al. [5] to examine the presence of HSPGs appears to recognize only one molecule (Chemicon International, Technical Assistance) of the rich HSPG family. Garrett et al.[4] histologically evaluated overall GAG distributions in dog and pig LP, but not the distributions of specific PG/sGAG types. Thus, the quantity and distribution of PGs in human and animal model vocal fold LPs merit further study.
The present work examines and compares the PG/sGAG content of normal human vocal fold LP and that of dog, pig, and ferret. Specifically, LP PGs levels are quantitated indirectly by measuring the concentration of total sGAG side chains, and immunohistochemical analyses for specific PG/sGAG classes are presented for all four species.
2.2 Materials and methods
2.2.1 Tissue procurement
Eight human larynges were obtained within 24 hours post-mortem. The age, gender, source, and method of preservation of these specimens are described in Table 2.1. All human tissue included in this study appeared normal as assessed by a pathologist, and donors had no known medical history of vocal fold surgery or chronic voice disorders. Human tissue was procured with the approval and in accordance with the guidelines of the Massachusetts Institute of
Technology (MIT) and Massachusetts Eye and Ear Infirmary (MEEI) committees on human experimentation.
Six female beagle larynges (Marshall Farms, North Rose, NY) from 2-3 year old animals, six
pig larynges (Research 87, Inc) from 6-12 month old animals of both genders, and four adult
male ferret larynges (Marshall Farms, North Rose, NY) were recovered within 6 hours post-mortem. All animal specimens included in this study had macroscopically and
microscopically normal vocal folds. For each animal laryngeal specimen, one hemi-larynx was snap-frozen and stored at -800C for biochemical analysis and the second hemi-larynx was
placed into neutral buffered formalin at 40C for histochemical studies.
Epiglottis tissue from each species was processed histologically as a positive control tissue for immunohistochemical studies. Pig hyaline cartilage was used as a biochemical assay control.
All animal tissue was procured with the approval and according to the guidelines of the MIT
animal care committee.
Table 2.1: Human specimen information*
Specimen Age Gender Source Preservation Analyses SI 61 male MEEI surgical left vf: snap frozen biochemical
right vf: formalin fixed histological
S2 57 female Clinomics autopsy formalin fixed biochemical histological
S3 49 male Clinomics autopsy formalin fixed histological S4 48 male Clinomics autopsy formalin fixed biochemical histological
S5 47 female Clinomics autopsy formalin fixed histological
S6 40 female MGH autopsy snap frozen biochemical
S7 55 female MGH autopsy snap frozen biochemical
S8 66 male MGH autopsy snap frozen biochemical
*MEEI, Massachusetts Eye and Ear Infirmary; MGH, Massachusetts General Hospital; Clinomics,
Clinomics Biosciences, Inc. Formalin-fixed human tissue was fixed in hemi-larynx form.
2.2.2 Tissue preparation for biochemical and histological analysis
Each snap-frozen animal or human (S 1, S6, S7, S8) hemi-larynx was briefly thawed in sterile PBS, and the middle third of the vocal fold was excised for biochemical analysis. The formalin-fixed human (S1, S2, S3, S4, S5) and animal hemi-larynges, after overnight fixation, were transferred to 70% ethanol at 4'C for 16 hours, after which the middle third of each vocal fold was retrieved. In human specimens S2 and S4, the anterior half of this middle third was processed for histological analysis and the posterior half was further processed for biochemical assays. Control samples were run to ensure that the formalin-fixation of the S2 and S4 portions reserved for biochemical analysis was not significantly altering measurements for the biomolecules of interest.
Histological specimens were paraffin embedded, and serial 5gm sections transverse to the vocal fold free edge were cut. Epiglottis controls were exposed to the same histological preparation conditions as the associated vocal fold tissue.
In tissue portions reserved for biochemistry, the muscular layer and superior and inferior glandular regions were microdissected away. The remaining LP was then lyophilized and stored at -800C until further analysis. At time of analysis, approximately 200gL of 50 gg/mL
filter-sterilized proteinase K (Worthington Biochemical, Lakewood, NJ) in
100mM
sodium acetate buffer, pH 7.0 was added to each biochemical sample per 1 mg tissue dry weight. Digestion proceeded at 60'C for 24 hrs, with fresh proteinase K being added after 12 hrs and again after 18 hrs. Hyaline cartilage controls were exposed to the same digestion conditions and biochemical assays as the vocal fold LP specimens.2.2.3 Biochemical analyses 2.2.3.1 Total protein quantification
As a measure of total protein in each sample digest, total amino acids, excluding tryptophan and cysteins, were quantitated in triplicate by AAA Service Laboratory, Inc (Boring, Oregon). The total amount of proteinase K added to each sample was approximately 30gg per 1mg dry weight. Since protein appears to comprise approximately 75-85% of the LP dry weight (unpublished observations), the contribution of proteinase K to total measured protein levels will be considered negligible in comparison to the tissue contribution.
2.2.3.2 sGAG quantification
Total sGAG was measured using the Blyscan assay (Accurate Chemical and Scientific Corp., Westbury, NY), a modified dimethylmethylene blue assay. Each human, pig, and dog vocal fold sample was measured in triplicate. Due to the small size of the ferret vocal fold, portions of the ferret digests had to be pooled to bring the sGAG quantity into the range of the assay. These pooled samples were measured in duplicate.
2.2.4 Immunohistochemical analyses 2.2.4.1 Antibodies
As previously mentioned, each PG contains a core protein and at least one GAG side chain. Common side chain types include HS, DS, KS, and CS, with CS being further subdivided into
0-, 4-, and 6-sulfate forms. The type and length of sGAG side chains associated with a
particular PG core protein are often altered in tissue pathology, as are the levels of individual core proteins [8]. Therefore, both the core proteins and side chains types in the LP are important to characterizing its normal PG content. This study has analyzed the LP distributions of decorin, biglycan, versican, and aggrecan core proteins and of chondroitin 6-sulfate (C6S), chondroitin 4-6-sulfate (C4S), KS, and HS side chains. The antibodies, epitope 21
retrieval methods, and dilutions used are listed in Table 2.2. Antibodies which require further comment are described below.
Antibody clone 2B 1 (Calbiochem, LaJolla, CA) has been shown to bind PG-M/versican [9,
10], and clone 6B6 (Calbiochem, LaJolla, CA) recognizes decorin, but not biglycan [11].
Thus, throughout the remainder of this paper, the staining resulting from antibodies 2B 1 and
6B6 will be referred to as versican and decorin staining, respectively. For ferrets, the versican
antibody did not bind to the epiglottis positive control, implying the antibody to be non-reactive with this species (data not shown). Similarly, the biglycan antibody was only applied to human specimens, since initial tests with animal tissues seemed to indicate that antibody binding was non-specific for biglycan in these species (data not shown).
Antibody clone 3G10 recognizes unsaturated uronic acid residues attached to HSPG core proteins following heparitinase I digestion [9]. Antibody 3G10 has been shown to bind not only cell-associated HSPGs, such as syndecans [9], but also matrix HSPGs, such as perlecan [12]. The keratan sulfate antibody 5D4 (Calbiochem, LaJolla, CA) appears to recognize
highly sulfated corneal and skeletal KS PGs with high affinity and poorly sulfated or
unsulfated KS PGs with significantly lower affinity [13].
Table 2.2: Pre-treatment and antibody dilution factors
Antibody Clone Epitope Human Dog Pig Ferret Retrieval Dilution Dilution Dilution Dilution
Aggrecan HAG5B 11 Trypsin 1:400 1:400 1:400 1:300
Dako Dako Dako Dako
Biglycan Courtesy of ABC 1:2400 N/A N/A N/A
Peter Roughley Sniper
ADi-4S 2B6 ACII 1:100 1:40 1:100 1:40
Dako Dako Dako Dako
ADi-6S 3B3 ABC 1:400 1:400 1:300 1:400
Dako Dako Dako Dako
Heparan sulfate F69-3G10 heparitinase I 1:900 1:1000 1:3000 1:1000
Dako Dako Dako Dako
Decorin 6B6 ABC 1:300 1:400 1:300 1:400
Dako Dako Dako Dako
Versican 2B1 ABC 1:800 1:400 1:300 N/A
Dako Dako Dako
Keratan sulfate 5D4 ABC 1:450 1:450 1:150 1:200
Dako Dako Dako Dako
The ADi-6S antibody recognizes C6S oligosaccharide stubs attached to PG core protein following chondroitinase ABC (ABC) digestion of the tissue [7]. Similarly, antibody ADi-4S binds stubs of DS and CS side chains bound to core proteins following ABC digestion [7]. In this study, tissues receiving the ADi-4S antibody were treated with chondroitinase ACII
(ACII) rather than ABC. ACII cleaves CS-containing chains but not DS-containing chains,
and, under these conditions, ADi-4S antibody staining emphasizes the distribution of C4S side chains [7].
Several variants of aggrecan exist [1]. For example, the GI domain and KS side chains associated with cartilaginous aggrecan appear to be largely absent in the aggrecan form present in the tensioned regions of tendon [14]. Thus, the aggrecan antibody (Accurate Chemical and Scientific Corp., Westbury, NY) used in this study was selected for the ability to bind most aggrecan variants. Specifically, the aggrecan antibody used does not bind the recombinant bacterial fragments corresponding to the GI or KS-bearing region of the aggrecan core protein. Transmission electron microscopy (TEM) seems to indicate that the antibody binds within the N-terminal portion of the chondroitin sulfate-attachment region (Technical information, Accurate Chemical and Scientific Corp., Westbury, NY).
2.2.4.2 Immunohistochemical procedure
Unless otherwise stated, immunohistochemical steps took place in a humidified environment at room temperature, and immunohistochemical reagents were purchased from Biocare Medical (Walnut Creek, CA). Tissue sections were deparaffinized in xylene, taken to water using graded ethanol baths, and then exposed to peroxidase block for 10 minutes.
Heparitinase I (Calbiochem, La Jolla, CA) was applied to the appropriate tissues at 0.02 U/mL in 50 mM Tris acetate, 5mM calcium acetate pH 7.0 for 2 hours at 37'C. Tissues receiving the ADi-4S antibody were treated with 0.1 U/mL ACII (Seikagaku America, Falmouth, MA) in 50mM sodium acetate, 5mM calcium acetate pH 6.0 for lhr at 37'C. ABC (Seikagaku America, Falmouth, MA) was applied at 0.1 U/mL dissolved in
100mM
Tris, 10mM EDTA buffer, pH 8.0 for 30 minutes at 37'C. For aggrecan antibody staining, tissues were digestedwith 0.19% trypsin for 7 minutes at room temperature.
All tissues were subsequently treated with Avidin-Biotin block. After 10 minute incubation
with the blocking agent Terminator, tissue sections were lightly drained and the appropriate antibody diluted either in Sniper or Dako antibody diluent (Dako Cytomation, Carpinteria,
CA), as specified in Table 2.2, was applied. Biglycan antibody was applied overnight at 40C, whereas all other antibodies were applied for 1 hr at room temperature.
Following antibody application, goat anti-mouse IgG or goat anti-rabbit IgG secondary antibody and streptavidin-HRP were applied sequentially for 10 minutes each. Antibody binding was detected using chromagen DAB, after which slides were dipped in hematoxylin, taken to xylene, and coverslipped.
Species-specific epiglottis sections served as positive controls for each antibody. Negative control vocal fold sections for decorin, versican, biglycan, aggrecan, and KS involved application of negative control serum in place of primary antibody following appropriate enzymatic pretreatment. According to methodologies of Couchman et al.[7] and David et al.
[9], negative controls for ADi-6S, ADi-4S, and 3G10 antibodies did not receive ABC, ACI,
or heparitinase I pretreatment, respectively, although primary antibody was applied.
2.2.5 Immunohistochemical image analysis
2.2.5.1 Image capture
An Axiolab microscope (Zeiss, Thornwood, NY) coupled to an Axiocam CCD camera (Zeiss, Thornwood, NY) and to an Axiovision image analysis system was used for image recording. For all slides, full spectrum 1030x1300 8-bit color images were recorded. Background correction was performed prior to image capture by interactively referencing a blank field using the Axiovision software.
2.2.5.2 Schematic development
A common LP microstructural organization appears to exist for all normal LP specimens of
given species, and recognition of this organization can facilitate intraspecies comparison of LP staining patterns. Thus, schematics emphasizing repeatedly observed microstructural
subdivisions in the LP of each species have been developed and are displayed in Figure 2.1.
Figure 2.1: Schematics of repeatedly observed subdivisions within the vocal fold LP by species. (A): human; (B): dog; (C): pig; (D): ferret.
To gain insight into the origin of the LP subdivisions depicted within these schematics, examine the staining for C6S and versican in dog LP as shown in Figures 2.2a,c. Regions
B A C ~rI V I D
within these immunohistochemical images corresponding to the LP subdivisions present in the dog LP schematic have been outlined using specific colors. Versican and C6S stained specimens were selected to demonstrate dog LP subdivisions since each antibody highlights/emphasizes different LP features. Although the exact placement and dimensions of these dog LP subdivisions varies from specimen to specimen, as indicated in Figures 2.2g,h, the subdivisions noted in the schematic have been observed in each dog LP examined in this study. Figures 2.3, 2.4, and 2.5 illustrate the correspondence of subdivisions within the LP schematics for human, pig, and ferret, respectively, to regions within actual specimen LPs. For humans, the regions in Figures 2.3d-f outlined in red correspond to what laryngologists have termed the superficial LP [15], whereas the blue-delineated regions correspond to the deep LP. These designations of the LP region nearest the epithelium as the superficial LP, the LP region nearest the muscle as deep LP, and the LP region in between these as the intermediate LP, have been extended to the animal models (Figure 2.6) to facilitate qualitative
verbal descriptions of staining patterns.
It should be noted that the schematics illustrate gross LP morphology post-excision from the larynx structure. Some alterations in the overall size and shape of each species' LP from its in vivo state due to the excision of the midmembranous portion from its attachments post-fixation should be anticipated.
2.2.5.3 Semi-quantitative image analysis
Consistent interspecies variations in LP staining patterns for specific molecules can give insight into important LP microstructural or compositional differences across species. However, interspecies comparison of antibody staining can be difficult, since the observed intensity range for DAB staining varies with antibody, species, and with specimen within a given species. Therefore, in seeking to compare LP antibody staining patterns across species, relative staining intensity, rather than absolute intensity, should be examined. Relative staining intensity within different LP subregions has been analyzed on a specimen-by-specimen basis for each antibody as follows: LP regions within a specific specimen-by-specimen of maximum staining intensity were assigned a 6 while regions of background staining intensity were assigned a 1. Subregions with staining intensities between these extremes were assigned numbers between 1 and 6, as appropriate, with an intermediate degree of staining being assigned a 3-4. For a specific antibody, the numeric assignments for each LP region were then averaged across all specimens of a given species and rounded to the nearest integer. The resulting number was matched with a color code: 6=red, 5=yellow, 4=green, 3=light blue, 2=dark blue, l=purple. These colors were then applied to the appropriate subregions within the LP schematics.
The average relative staining intensities for C6S and KS in the human LP were not assessed, due to the relatively high variability among human specimens in staining patterns for these antibodies. This variability made average relative intensity evaluations of unclear utility for these molecules.
A
I
BI
C
F
G7
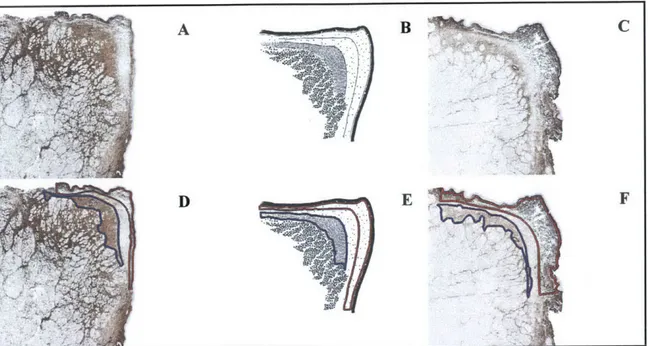
Figure 2.2: Demonstration of the development of the dog LP schematic. (A): dog specimen stained for
C6S; (C): same dog specimen stained for versican; (E): dog LP schematic; (B, D, F): images (A, C, E),
respectively, with major dog LP features delineated with specific colors; (G): HS staining of a different dog specimen; (H): image (G) with same major features delineated as in (B, D, F). Images (G, H) have been included to demonstrate the variability in feature location and size among dog specimens.
.1c
...
A!*
E
A
D
C
F
Figure 2.3: Demonstration of the development of the human LP schematic. (A): human specimen stained for decorin; (B): human LP schematic; (D, E): images (A, B), respectively, with major human LP features delineated with specific colors; (C): decorin staining of a different human specimen; (F): image (C) with same major features delineated as in (D, E). Images (C, F) have been included to demonstrate the variability in feature location and size among human specimens.
A F -'A N. ,-f \\ D B ~ E ~
Figure 2.4: Demonstration of the development of the pig LP schematic. (A): pig specimen stained for decorin; (B): pig LP schematic; (D, E): images (A, B), respectively, with major pig LP features delineated with specific colors; (C): HS staining of a different pig specimen; (F): image (C) with same major features delineated as in (D, E). Images (C, F) have been included to demonstrate the variability in feature location and size among pig specimens.
27 C
F B r
A
A B
C
D
4,
Figure 2.5: Demonstration of the development of the ferret LP schematic. (A): ferret specimen stained for C6S; (B): same ferret specimen stained for HS; (C): ferret LP schematic; (D, E, F): images (A, B, C), respectively, with major ferret LP features delineated with specific colors.
A B C
A, 4,
Figure 2.6: Segmentation of dog, pig, and ferret LP into superficial, intermediate, and deep regions. The region designated as superficial LP is outlined for each species in red, and the region designated as deep LP is delineated in blue. (A): dog; (B): pig; (C): ferret.
2.2.6 Statistical analysis
Average LP sGAG levels for each animal species were compared to average human results using an unpaired student t-test. Differences were considered statistically significant at a level of p<0.05. Standard deviations (SDs) were calculated to include the SDs within and among specimens of a given species. Since aliquots of the ferret specimens were pooled for the sGAG assay, interspecimen variations in sGAG levels are not represented in the ferret SD, although such variations are represented in human, dog, and pig sGAG SDs. Therefore, the mean ferret sGAG concentration could not be strictly compared to that of humans by a student t-test.
28
B C
F E
2.3 Results
2.3.1 Biochemical results
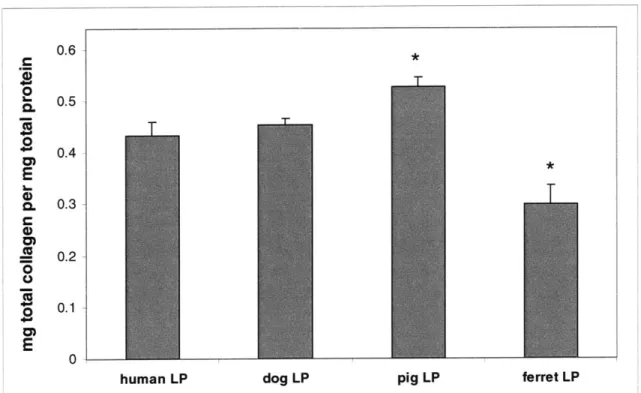
Figure 2.7 shows total sGAG per mg tissue total protein for each species. Results are reported as average + standard error of the mean. Dog and pig LP total sGAG concentrations were not statistically different from that of human specimens (p>0.05), and total sGAG levels in ferret LP appeared to be of the same order of magnitude as in human LP. No statistically significant difference in human LP sGAG content with gender was noted (data not shown), although this result is likely a reflection of the limited human specimen set.
For hyaline cartilage controls, the measured sGAG levels were within the range cited in literature for normal hyaline cartilage [16] (data not shown).
0.025 G 0.02 0 L. 0. .- 0.015 E ) 0. 0 )0-005-E
human LP dog LP pig LP ferret LP
Figure 2.7: Total sGAG content by species. No statistically significant differences were found between the mean sGAG for pig and dog and that of humans, p>0.05. Ferrets were not statistically compared to humans, as discussed in Materials and Methods.
2.3.2 Immunohistochemical results
B D G H F I N J K
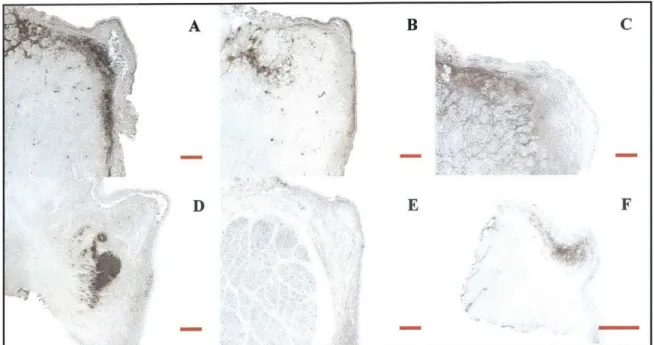
Figure 2.8: Representative staining for versican, decorin, and C4S by species. (A, D, G): versican staining in human, pig, and dog, respectively; (B, E, H, J): decorin staining in human, pig, dog, and ferret, respectively; (C, F, I, K): C4S staining in human, pig, dog, and ferret, respectively. Scale bars =500
sm.
30
4
C
B C
2.9: Representative staining for C6S. (A, B, C): illustrate the range of C6S staining observed
human specimens; (D, E, F): C6S staining in dog, pig, and ferret, respectively. Scale bars = 500
A
CI
D B E C F A -F E D Figure among ILm.I
Figure 2.10: Representative staining for KS. (A, B, C): illustrate the range of KS staining observed among human specimens; (D, E, F): KS staining in dog, pig, and ferret, respectively. Scale bars = 500 gm.
*F1
A B ~
C
D
Z
Figure 2.11: Representative staining for biglycan and HS. (A): human biglycan staining; (B, C): human HS staining; (D, E, F): HS staining in dog, pig, and ferret, respectively. Scale bars = 500
sm.
C4S for all four species. Figures 2.9 and 2.10 illustrate C6S and KS staining, respectively. Three images of human LP C6S and KS staining have been included illustrate the variability in staining observed among human specimens for these antibodies. Representative HS staining in two human specimens and in the animal models is shown in Figure 2.11. Also included in Figure 2.11 is a representative image of human LP biglycan staining. Aggrecan staining could not be distinguished from background in any of the LP specimens, although staining in the elastic cartilage epiglottis controls was intense (data not shown).
Semi-quantitative results for the average relative staining intensities of versican, decorin, and C4S are displayed with respect to the species-specific LP schematics in Figure 2.12. Similar analyses were carried out for C6S, KS, and HS staining, and the results are shown in Figure
2.13. Also contained in Figure 2.13 is the average relative intensity image for human LP
biglycan staining.
From Figure 2.12, it can be seen C4S staining was prevalent throughout the LP of each species, although in humans, the staining was most intense in the deep LP. The distribution of decorin in humans was primarily localized in the superficial and deep regions of the LP. Versican staining, although also present in the superficial and deep layers, extended into the human intermediate LP. The versican, decorin, and C4S distributions in pigs were very similar, with staining being relatively intense in the deep and inferior LP and along the epithelial-LP border. In dogs, the oblong subregion of the intermediate LP of relatively intense versican staining corresponded to a region of low decorin and C4S staining. For ferrets, decorin staining was most intense in the superficial region.
. . .. ... ' 4=0@99!9=
C
A
E F
C6S staining in humans showed several different patterns. In some specimens, staining for
this molecule was highest in the deep LP. In other specimens, C6S staining appeared to be primarily localized to the superficial and intermediate layers. Some specimens showed staining intermediate between the extremes represented by the above two cases.
A lB D G High C F E I H J K Low
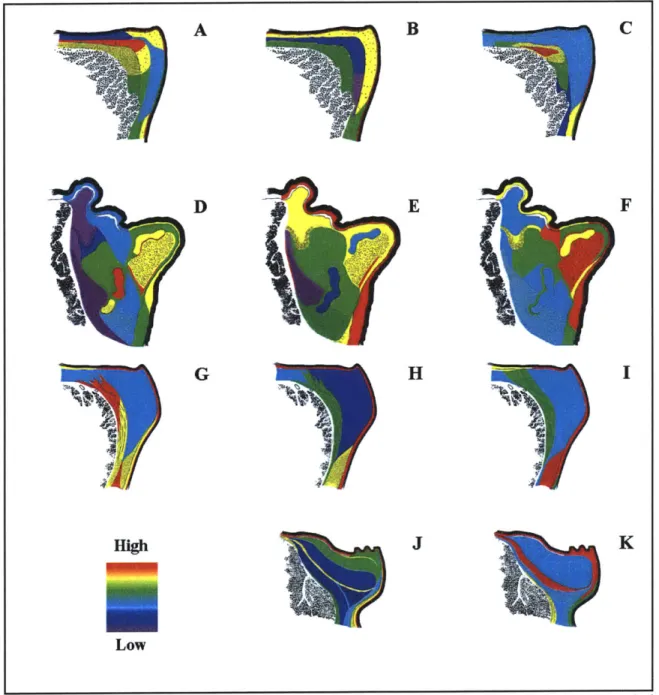
Figure 2.12: Semi-quantitative images for versican, decorin, and C4S staining. (A, D, G): average relative versican staining in human, dog, and pig, respectively; (B, E, H, J): average relative decorin staining in human, dog, pig, and ferret, respectively; (C, F, I, K): average relative C4S staining in human, dog, pig, and ferret, respectively.
KS staining in humans also varied very intense deep LP staining and other specimens, the staining was ferret, the oblong region of intense
A
D
G
from specimen to specimen, with some specimens showing others showing minimal non-glandular related staining. In intermediate between the above two extremes. In dog and
C6S staining in the intermediate LP corresponded to a
B E H J F I Low
Figure 2.13: Semi-quantitative images for C6S, KS, HS, and human biglycan staining. (A, D, G): average relative C6S staining in dog, pig, and ferret respectively; (B, E, H): average relative KS staining in dog, pig, ferret respectively; (C, F, I, K): average relative HS staining in dog, pig, ferret, and human respectively. (J): average relative human biglycan staining.