Business Continuity Planning for a U.S. Supply Chain
byArthur K. L. Chee
B.A.Sc. Chemical & Biological Engineering University of British Columbia, 2006
Tzu-Hsueh Lee B.S. Finance, B.A. International Studies The Pennsylvania State University, 2011 Submitted to the Engineering Systems Division in Partial Fulfillment of the
Requirements for the Degree of
Master of Engineering in Logistics
at the
Massachusetts Institute of Technology
MA SSACHUSETTS INGT11Jfr OF TECHNOLOGY
j
JUL
152014
LIBRARIES
June 2014
2014 Arthur K. L. Chee and Tzu-Hsueh Lee. All rights reserved.
The author hereby grants to MIT permission to reproduce and to distribute publicly paper and electronic copies of this document in whole or in part.
Signature redacted
Signature of AuthorMaster of Engineering in Logistics Program, Engineering Systems Division
Signature of Author
Signature redacted
May 16, 2014
Master of EngineriKg in Logistics Program, Engineering Systems Division
Signature redacted
May 16, 2014Certified by
James Blayney Rice, Jr. Deputy Director, Center for Transportation & Logistics
Accepted by
Signature redacted
Thesis Supervisort
' - Prof. Yossi SheffiProfessor, Engineering Systems Division Professor, Civil and Environmental Engineering Department Director, Center for Transportation and Logistics
Business Continuity Planning for a U.S. Supply Chain
byArthur K. L. Chee and Tzu-Hsueh Lee
Submitted to the Engineering Systems Division in partial fulfillment of the requirements for the degree of
Master of Engineering in Logistics
Abstract
The research objective was to provide a directional sense of some key considerations for business continuity planning (BCP) specific to a company's downstream distribution operations in the U.S. This was achieved via a two-pronged strategy comprised of quantitative and
qualitative elements to complement insights gained from the literature review.
By quantitatively assessing the financial impacts arising from four hypothetical scenarios, the business impact analysis (BIA) showcased the merits of short time-to-recovery (TTR) in the event of a disruption. However, available information also appears to suggest that the estimated financial impact from carrying high-value inventory is not necessarily insignificant. Hence, a company may want to mitigate the likelihood of a scenario whereby large amounts of inventory become damaged. Qualitative information from industry participants in the study highlighted the importance of tailoring continuity plans to the unique supply chain needs of an organization.
Thesis Supervisor: James Blayney Rice, Jr
ACKNOWLEDGEMENTS
I am dedicating this work and my time at MIT to my wonderful wife, lovely angels and family. I cannot thank them enough for being a part of this exciting learning adventure.
My SCM classmates and program alumni have also made this an excellent learning journey. Affiliated faculty, staff and post-docs all deserve special mention for impeccably fostering the rich interactions, opening our minds up to the many possibilities. Last, but certainly not the least, Tzu-Hsueh (Sandy), who has been an absolute pleasure to work with.
- Arthur K. L. Chee
I would like to thank all my family and friends for their support and love. I would also like to thank my colleague, Arthur Chee, for being an incredible thesis partner to work with. Finally, I appreciate the faculty and students of the SCM program for this unforgettable year in my life.
- Tzu-Hsueh Lee
We would like to thank the staff at our thesis sponsor company for making this project even possible. We are equally grateful to the many industry contacts of CTL at MIT who have been gracious in sharing with us their personal and professional insights relating to our thesis topic.
We are especially thankful to our advisor, Jim Rice, for mentoring and providing us with his knowledgeable perspectives; we could not have asked for a better learning journey than the fantastic one we had. Finally, a special thanks to Lenore Myka for patiently reading through our work and contributing to our learning over the course of the year.
TABLE OF CONTENTS
A CKN OW LED G EM ENTS... ... ... 3
TABLE OF CONTENTS... 4
LIST O F FIG U RES ... 6
LIST OF TABLES...7
1. BACKGROUND AND MOTIVATION... 8
2. LITERATUR E REVIEW ... 10
2.1 WHAT IS BUSINESS CONTINUITY PLANNING (BCP) ... 10
2.2 BUSINESS CONTINUITY PLANNING FRAMEWORKS ... 10
2.2.1 A Comprehensive Approach for Business Continuity Planning ... 11
2.2.2 An Institutional Theory Perspective of Business Continuity Planning ... 11
2.2.3 Multi-Layered Planning... 12
2.2.4 Tim e to Recovery (TTR) ... 13
2.2.5 The Importance of Third-Party Service Providers... 14
2.3 STRATEGIC IMPLICATIONS ... 14
2.3.1 Security, Resilience and Flexibility ... 15
2.3.2 The Resilient Enterprise... 16
2.3.3 The Challenges of Scenario-Based Planning ... 17
2.4 LITERATURE REVIEW SUMMARY ... 17
3. M E TH O D O L O G Y ... 19
3.1 BUSINESS IMPACT ANALYSIS MODEL... 19
3.1.1 Source of D ata... 20
3.1.2 Identify Impact Scenarios ... 20
3.1.3 Data Cleaning and Validating ... 21
3.1.4 Im pact A nalysis... 21
3.1.4.1 Estimation ofAverage U.S. Retail Pricing... 22
3.1.4.2 Value of Product Inventory On-Hand ... 23
3.1.4.3 Value of Outbound Product Flows ... 25
3.1.4.4 Impact Analysis by Scenario...25
3.2 INDUSTRY COMPARISONS AND BENCHMARKING ... 28
3.2.1 Participant Identification... 28
3.2.2. Interview Questionnaire... 29
3.3 L IM ITATIO N S ... 29
4.1 BUSINESS IMPACT ANALYSIS... 31
4.1.1 Business Impact Analysis for Facility A... 31
4.1.2 Business Impact Analysis for Facility B... 43
4.2 IN TERV IEW RESU LTS... 53
4.2.1 Part 1: Product Attributes and Demand Patterns... 53
4.2.2 Part 2: Supply Chain Characteristics ... 54
4.2.3 Part 3: Business Continuity Planning ... 55
4.2.3.1 Considerations of Business Continuity Planning ... 55
4.2.3.2 Structure of Business Continuity Planning ... 56
4.2.3.3 Business Impact Analysis... 57
4.2.3.4 Business Continuity Planning in Upstream Supply Chain... 59
4.2.3.5 Business Continuity Planning in Downstream Supply Chain... 59
4.2.3.6 Inventory ... 62
4.2.3.7 Reviewing Business Continuity Planning ... 63
4.2.3.8 Investment Decisions ... 63
4.2.4 Part 4: Wrap-up Questions... 64
4.2.4.1 Key Issues in Business Continuity Planning ... 64
4.2.4.2 Improving Business Continuity Planning ... 65
5. DISCUSSION AND SUGGESTIONS... 66
5.1 INTERPRETATION OF DATA ANALYSIS... 66
5.1.1 Relationship between Demand Seasonality and Financial Impacts... 66
5.1.2 Time-to-Recover (TTR) and Other Operational Impacts ... 67
5.1.3 Other Scenario-specific Considerations... 68
5.1.3.1 Scenario 1 -Facility Rendered Inaccessible ... 69
5.1.3.2 Scenario 2 -Facility Accessible, with 50% of Merchandise Damaged. 70 5.1.3.3 Scenario 3 -Data Center Failure ... 71
5.1.3.4 Scenario 4 - Breakdown of E-Commerce Global Contact Center ... 72
5.1.3.5 TTR Interview Observations ... 73
6. SU M M A R Y ... 74
7. A P P E N D IX ... ... 76
Exhibit 1 BCP Questionnaire... 76
LIST OF FIGURES
Figure 1 Monthly US$ MSRP Inventory Values, Facility A... 24 Figure 2 Monthly US$ MSRP Inventory Values, Facility B... 24 Figure 3 BIA for Scenario 1 at Facility A ... 33 Figure 4 BIA for Scenario 1 at Facility A from a disruption event occurring in the
peak and lowest impact months of FYI2/FY13 ... 34 Figure 5 BIA for Scenario 2 at Facility A ... 36 Figure 6 BIA for Scenario 2 at Facility A from a disruption event occurring in the
peak and lowest impact months of FYl2/FYl3 ... 37 Figure 7 BIA for Scenario 3 at Facility A ... 39 Figure 8 BIA for Scenario 3 at Facility A from a disruption event occurring in the
peak and lowest impact months of FYl2/FYl3 ... 40 Figure 9 BIA for Scenario 4 at Facility A ... 42 Figure 10 BIA for Scenario 4 at Facility A from a disruption event occurring in the
peak and lowest impact months of FYI2/FY13 ... 43 Figure 11 BIA for Scenario 1 at Facility B ... 45 Figure 12 BIA for Scenario 1 at Facility B from a disruption event occurring in the
peak and lowest impact months of FYI2/FYl3 ... 46 Figure 13 BIA for Scenario 2 at Facility B... 48 Figure 14 BIA for Scenario 2 at Facility B from a disruption event occurring in the
peak and lowest impact months of FY12/FY13. ... 49 Figure 15 BIA for Scenario 3 at Facility B... 51
Figure 16 BIA for Scenario 3 at Facility B from a disruption event occurring in the peak and lowest impact months of FYI2/FY13 ... 52
LIST OF TABLES
Table 1 BIA M odel Input Parameters ... 19
Table 2 Average Retail Pricing for Product Categories at Facility A ... 22
Table 3 Average Retail Pricing for Product Category at Facility B... 23
Table 4 BIA model input parameters for Scenario 1 at Facility A... 31
Table 5 BIA model input parameters for Scenario 2 at Facility A... 35
Table 6 BIA model input parameters for Scenario 3 at Facility A... 38
Table 7 BIA model input parameters for Scenario 4 at Facility A... 41
Table 8 BIA model input parameters for Scenario 1 at Facility B... 44
Table 9 BIA model input parameters for Scenario 2 at Facility B... 47
1. BACKGROUND AND MOTIVATION
With the increase in outsourced manufacturing practices, product companies lose visibility over the supply chain. In longer supply chains that extend to various geographical regions, the entire system is exposed to more uncertainties. Furthermore, the loss in control of key processes in the system makes organizations more vulnerable to disruptive events such as natural disasters, labor disputes and economic crises.
To minimize the impact of such disruptions, firms develop business continuity plans (BCP) to prepare in advance of a disruption. The impact of a disaster can be reduced by planning out procedures and steps to resume operations before the event occurs. The longer the business operations are shut down, the greater the challenge is posed to an organization's viability.
In the past decade, major disasters around the world severely disrupted supply chain operations and have raised the interest in business continuity. Management started to have serious discussions over the necessity and criticality of a BCP program, in order to protect their business from disruptive events. Increasing numbers of organizations realize that the risk of losing billions of dollars and resources in a short period of time threatens the sustainability of their business.
Our key research objective is to give a directional sense of key areas in BCP. We study one company as the base case by focusing primarily on its North American supply chain. In doing so, we aim to help frame various considerations that could be taken into account when developing and improving on a BCP.
We employ a two-tier approach in the study, combining both quantitative and qualitative inputs. First, we conduct a business impact analysis on the two distribution centers in the United States, in order to identify key assets and business processes in the system. Second, we seek
industry wisdom in the BCP and risk management areas by interviewing BCP and risk management professionals. With both results, we are able to provide suggestions.
Our study consists of four major components: (1) a review of a few BCP frameworks in research papers; (2) an analysis on the financial impacts of four hypothetical disruption scenarios; (3) a consolidation of interview results which reports how BCP is practiced in business
environments; and (4) interpretations of the results and suggestions we have. The outcomes of this project may help companies prepare BCP to mitigate risks in their North American supply chain by offering a higher-level impact analysis and providing insights shared by various industry professionals.
2. LITERATURE REVIEW
As a result of severe natural disasters in recent years, global supply chain efforts are increasingly focused on the mitigation of risk. Under the risk management theme, business continuity
planning (BCP) serves as a plan to continue operations in circumstances where capacity is lost due to a disruptive event. This chapter introduces the definition of BCP and a number of frameworks for developing BCP to gain a fundamental understanding of this area.
2.1 WHAT IS BUSINESS CONTINUITY PLANNING (BCP)
Virginia Cerullo and Michael J. Cerullo (2004) point out that business continuity planning (BCP) is implemented to mitigate major business interruptions by reducing or eliminating the impact of a disaster condition before it occurs. Barnes (2001) recognizes BCP as a capability that firms develop to recover from unanticipated disruptions in business operations. By integrating formalized procedures and resource information, companies are able to prepare and plan for operating interruptions. G.A. Zsidisin et al. (2005) view BCP as an approach to deal with unpredictable disruptions in supply chain operations, and a well-designed business continuity plan is able to help businesses minimize the impact of unexpected occurrences on the delivery of customer requirements.
2.2 BUSINESS CONTINUITY PLANNING FRAMEWORKS
The sections that follow summarize some of the various approaches to formulating business continuity plans that have been suggested in literature.
2.2.1 A Comprehensive Approach for Business Continuity Planning
In their paper on a comprehensive approach to BCP, Virginia Cerullo and Michael J. Cerullo (2004) list three major elements in the business continuity planning process: (1) identify major risks of business interruption, in both the internal and external contexts; (2) develop a plan to mitigate or reduce the impact of the identified risk; and (3) train employees and test the plan to ensure that the plan is effective.
The paper emphasizes the importance of integrating BCP and IT security plans since firms are more linked to other players in the business environment, and IT infrastructure failure contributes to both internal and external causes of business disruptions.
2.2.2 An Institutional Theory Perspective of Business Continuity Planning
In the research findings of G.A. Zsidisin et al. (2005), a four-stage BCP framework for upstream supply chain activities was developed. The first stage is creating internal awareness of risk exposures in supply chains and realizing potential consequences of disruptions. After risks are recognized internally, firms can drive this awareness out into upstream and downstream of the supply chain in order to manage external risks. The second stage in BCP is to prevent supply discontinuity by reducing the likelihood and/or the impact of supply chain disruptions. There are four key processes in this stage: risk identification, risk assessment, risk treatment and risk monitoring. The third task in the framework is remediating risk occurrence. Firms need to first
identify the resources needed and then develop a standard procedure in order to recover from operational disruption and minimize the impacts on the business. The final step in the continuity planning is fostering knowledge management, in which firms learn from experiences of past
According to G.A. Zsidisin et al. (2005), there are two issues managers should focus on when developing a business continuity plan for the supply chain. The first task is creating tools to support the first two stages of the BCP framework: enhance awareness in supply chain risks and prevent operating disruptions. Secondly, managers should develop metrics for BCP that capture, communicate and monitor the supply chain risks and the financial impact of such risks. The argument of Virginia Cerullo and Michael J. Cerullo (2004) further supports the concept of a heightened level of awareness along with the idea of communicating risk through appropriate metrics. They also believe that training a disaster recovery team and developing a test
methodology are essential to create an effective BCP to address critical risks. Finley (2006) suggests that a BCP should be reviewed and tested on an annual basis.
2.2.3 Multi-Layered Planning
There are few who would argue against the general opinion that IT functions lead most other functions within an organization when it comes to maturity of continuity or even disaster recovery plans. Much of this phenomenon can probably be attributed to the widespread acceptance of the high-value nature of data networks, especially given the Age of Information in which business entities operate in today. In a manner that reflects multi-layered plans practiced in IT (Robb, 2005) and advocated for supply chain networks (Rice and Caniato, 2003; Sheffi, 2005), Glendon (2013) points to the 3Cs of contingency planning, continuity capability, and crisis response as layers of defense within an established business continuity plan.
According to Glendon (2013), the 3Cs are broadly applicable to predictable scenarios (e.g. annual winter weather related events) whose impacts are generally understood, or otherwise even unknown. In order to better illustrate his point, Glendon used the analogy of a factory which operates in a flood-prone region. He described this factory as having flood contingency plans that
might be effective in dealing with a 1 -in-20 year, but not necessarily a 1-in-100 year flooding event (p. 46). Extending this analogy, Glendon rationalized continuity capability plans as being able to fill the void in those unlikely yet severe circumstances of disruption, entailing the prioritization of resources and processes to have production switched over to other factories. Decisive intervention by executive management becomes necessary in the most unlikely of circumstances that all alternate factory locations or points of manufacture alluded to in the aforementioned analogy are impaired at the same time.
2.2.4 Time to Recovery (TTR)
While small-scale, common supply chain disruptions such as poor supplier performance and human errors are easily managed using traditional risk management methods, disruption events with low probability of occurrence but high impact are challenging to quantify. Therefore,
Simchi-Levi, Schmidt, and Wei (2014) constructed a mathematical model to help assess the financial and operational impact of critical node failure resulting from disruptive events in varying severity.
A key input to the model was time to recovery (TTR), defined as "the time it would take for a particular node to be restored to full functionality after a disruption" (p. 98). The node can be any supplier facility, warehousing facility or a transportation hub. TTR under various scenarios can be calculated through surveying an organization's suppliers to gather key data around
location, products, lead-time, cost of loss, mitigation strategies, etc. Combining TTR information, bill-of-material data, operational and financial measures, inventory levels and demand forecasts for each product, the model allows firms to recognize their risk areas in details.
2.2.5 The Importance of Third-Party Service Providers
The complexity of modem supply chains with their emphasis on operational efficiencies and cost competitiveness have resulted in the outsourcing of a significant amount of operational
capabilities to third-party entities (and their sub-contractors) located domestically, as well as overseas. Hence, Skelton (2007) emphasizes that companies must go beyond the superficial understanding of their supply chain in order to establish effective business continuity plans. He stresses that a thorough understanding of the supply chain can only be attained through deep engagement with, and audits of, direct as well as indirect stakeholders in the continuum of activities that define the supply chain. Examples of such inclusive engagements include regular desktop exercises and testing of established BCP to assess the hypothetical capability of all constituents in the supply chain. Marshall (2007) takes this argument further by detailing how a principal company could develop a vendor BCP risk assessment program to facilitate collaborative resolution on gaps in continuity practices, as well as to aid in decisions about vendor relationships.
2.3 STRATEGIC IMPLICATIONS
Business continuity planning could encompass strategic operational aspects which would greatly strengthen a business case when it comes to financial and resource allocation decisions within the company. As such, it is possible for business continuity planning to go from its typical defensive set-up against the likelihood of a disruptive event, to being a catalyst for attaining competitive advantage in the marketplace.
2.3.1 Security, Resilience and Flexibility
Rice and Caniato (2003) introduced the concepts of security and resilience as important attributes of Business Continuity Planning (BCP) for supply chain networks. While their study showcased how companies may be able to strengthen either one of the attributes independently of the other, it also highlighted the criticality for both aspects to be satisfactorily considered and incorporated as part of BCP, especially in the face of the post 9/11 operating environment.
There is, however, no one-size-fits-all level of security recommended for all companies because different businesses operating in different industries are inherently exposed to different types and levels of security threats. It is noted that the key security facets under
consideration-physical, information and freight-are organized into basic and advanced measures. For instance, in terms of freight security, inspection serves as a basic response and radio-frequency identification (RFID) technology was considered an advanced response. Organizations with less exposure to security threats could very well be sufficiently protected through the adoption of basic security measures (Rice and Caniato, 2003).
Similarly, several ways of attaining supply chain resilience are suggested based on the various types of failure modes that can be expected. These methods are built around the themes of redundancy or flexibility, each with their own unique business cost and service level
characteristics as they are inherently different in nature. While redundancy involves maintaining a predetermined level of operational capability prior to the onset of need, through deliberate
investments in capital equipment, back-up operational capacity, or both, flexibility on the other hand involves the redeployment of some capacity in the existing supply chain network to compensate for a capacity shortfall within the network for any reason. Again, there is no single desired level of resilience recommended for all companies. Every company would ultimately have
to arrive at what it deems the right mix of security, redundancy and flexibility options befitting of its particular business or industry operating environment (Rice and Tenney, 2007).
2.3.2 The Resilient Enterprise
According to Sheffi and Rice (2005), "building a resilient enterprise should be a strategic initiative that changes the way a company operates and that increases its competitiveness" (p. 41). While acknowledging the role that redundancy has in every continuity plan, the authors stress that flexibility represents additional benefits that can actually confer competitive advantages to a company's day-to-day operations. In other words, the gains to be had need not be contingent on actual disruption occurrence, which would have been the case for increased redundancy as part of any BCP. Hence, the business case for increasing the flexibility of a company's supply chain is fundamentally more compelling.
Sheffi and Rice (2005, p. 48) cite the example of a company making the decision to supplement its low-cost offshore supplier with a supplier that is based domestically in order to increase its ability to react to changes in the market. Such market changes could be due not only to disruptions at the offshore supplier, but also brought on by any unexpected increase in demand for the company's product, especially in the case of new product launches. Therefore, the company is in a better position from a BCP standpoint in terms of increased levels of resilience from
investments in flexible operations, but also poised to capitalize on opportunities for increased sales.
In "The Resilient Enterprise: Overcoming Vulnerability for Competitive Advantage," Yossi Sheffi (2005) provides countless other examples of how companies can build flexibility into their supply chains not only for risk mitigation purposes, but also to create competitive advantage in an increasingly complex marketplace. By first applying the Vulnerability Framework in establishing
the relative risks that a company's supply chain is predisposed to given its unique business environment and operating requirements, managers are provided with a platform from which to better communicate and formulate strategic business continuity plans that are not just grounded in the defensive mitigation of risks.
2.3.3 The Challenges of Scenario-Based Planning
In his paper entitled "Only as Strong as the Weakest Link," Rice (2011) acknowledges that there are invariably an inordinate number of scenarios which could result in a disruption to a company's business. While there is merit to scenario-specific analysis, a helpful technique to incorporate into business continuity plans is to distil the outcomes of the many possible disruptive events into the
six possible "failure modes" that might affect a supply chain. In other words, a company would be in a much better state of preparedness by thinking in terms of its readiness for the relative impacts of the six different "failure modes" to its operations, rather than trying to establish plans for every possible disruption scenario. The six different ways in which a supply chain can be impaired by any disruptive event are: (1) capacity to acquire materials, (2) capacity to ship or transport, (3) capacity to communicate, (4) capacity to convert, (5) capacity to use human resources, and (6) capacity to tap financial flows.
2.4 LITERATURE REVIEW SUMMARY
The key responsibility of business continuity professionals, or those that drive business continuity planning on behalf of their organizations, lies in ensuring that plans established are actionable in times of need. While there are merits to having accountability for continuity planning anchored in the various business units or functions within an organization, it has been suggested that an overall plan exists which maps out key dependencies across the businesses to facilitate management
clarity and oversight. The ultimate success underlying allocation of resources to, as well as the relative readiness of, business continuity plans is frequently thought of as being dependent on its relevancy to the priorities of C-suite executives leading the business corporation (Kite and Zucca, 2007).
Limited research still exists on BCP for downstream distribution systems in a supply chain. Most papers discuss an end-to-end risk assessment of the supply chain as part of BCP, while G.A. Zsidisin et al. (2005) specifically advocate for upstream supply-side considerations. Generally speaking, mainstream business continuity planning is a rather complex paradox in that while organizations want to prevent disruptive events from impacting their businesses, it also
represents a pure cost to supply chain operations especially when viewed in terms of redundancy measures. In light of the lack of literature on downstream BCP, we look to elucidate how BCP might apply specifically to the downstream segment of a supply chain.
3. METHODOLOGY
We study one company as the base case by focusing primarily on its North American supply chain. In order to help frame various considerations that could be taken into account when developing and improving on a BCP, the study will encompass both quantitative and qualitative elements.
The quantitative element takes the form of a business impact analysis, whereby the financial impact on the company was calculated given a certain scenario occurring at each of its two North American distribution facilities. The qualitative element is comprised of a series of interviews conducted with BCP and risk management professionals across various industries. The
methodology employed in each of the elements is covered in detail within sections 3.1 and 3.2.
3.1 BUSINESS IMPACT ANALYSIS MODEL
Business impact analysis (BIA) seeks to assess, at a high-level, the costs and loss in revenue if business operations at a downstream distribution node were to be disrupted for a certain amount of time. Our BIA model for distribution facilities allows for the following input parameters to be taken into account as part of the study:
Table 1 BIA Model Input Parameters
Description of Input Parameter Units of Measure
Contingency warehouse monthly rental $/SqFt.
Contingency warehouse space required SqFt.
Total monthly rental cost of contingency Material Handling Equipment (MHE)
Percent of damaged inventory stock %
Percent revenue from wholesale customers %
Percent revenue from retail store customers % Percent revenue from e-commerce customers %
Amount of inventory held by e-commerce fulfilment ctr. Days Amount of inventory held by retail store customers Days Amount of inventory held by wholesale customers Days
Average COGS / Average MSRP Dimensionless
3.1.1 Source of Data
Historical sales and inventory management data, over a period of two years, were obtained for the two major distribution facilities that are within the scope of the study. The datasets would be sufficiently representative of some of the characteristics that are inherent of the company's business operations at each of the two facilities due to varying levels of demand for product.
3.1.2 Identify Impact Scenarios
Impact analysis was conducted using four different scenarios. These scenarios were
representative of a few extreme outcomes of disruption events in which damage was severe and obvious. The following were the four scenarios:
Scenario 1: The facility was rendered inaccessible
Scenario 2: The facility was accessible, but 50% of the merchandise was damaged Scenario 3: Data center failure
Scenario 4: E-commerce global contact center breakdown.
The above scenarios were outcomes of disruption events rather than being specific to the nature or type of disruption event. We chose to analyze the impact on the company based on the disruption outcomes to avoid an analysis which was dependent on the specificity of a disruption event.
3.1.3 Data Cleaning and Validating
Three sets of data were available for our study: inventory positions at both facilities, outbound and inbound data at both facilities, and the manufacturer's suggested retail price (MSRP) information for the Japanese market. While we were provided with inbound and outbound data for a two-year time period, we had to work with inventory positions limited to a period of six months.
The next step of the business impact analysis was to clean up the data and extract useful information for the study. We initialized the process by applying a formula to the dataset:
Initial inventory (month 1) + Inbound (month 1) - Outbound (month 1)
= Ending inventory (month 1). (1)
Due to the limitations of the dataset, we negated the use of inbound data in our analysis by matching-up inbound shipments to outbound shipments on a month-to-month basis since it would not be unreasonable to expect stock replenishment of goods sold. We also utilized the average of the six months of inventory positions to be representative of the monthly inventory positions over the two-year time frame; this would be relevant for Scenario 2.
3.1.4 Impact Analysis
With cleaned and organized inventory information, we were able to apply the four scenarios we identified to the dataset. However, the financial impact had to be presented in a U.S. business environment for the purpose of our study. Hence, the impact analysis needed to be framed in terms of U.S. dollars by first deriving an estimate of U.S. retail pricing for goods sold based on the Japanese retail MSRP information dataset.
3.1.4.1 Estimation ofAverage U.S. Retail Pricing
An estimate of the equivalent U.S. dollar retail pricing was determined based on the following guidelines: (a) Japanese retail pricing tended to be higher than that in Hong Kong, and (b) Hong Kong retail pricing was in turn higher than in the U.S. With these guidelines, the following general pricing relationships were utilized in the estimation of U.S. dollar retail pricing.
Japan retail price = HK retail price + 30% markup (2)
HK retail price = U.S. retail price + 15% markup (3)
Since international currency exchange rates are known to fluctuate, the general prevailing rates quoted by Citibank N.A. on April 2, 2014 were assumed to be representative:
1 HK dollar = 13.38 Japanese Yen
1 U.S. dollar = 7.76 HK dollar
As the original dataset had not included information for product categories "Bravo," "Echo," and "Golf," an estimate of their retail pricing had to be derived from the following assumptions:
Pricing for Bravo = 80% x (Average Retail Pricing for Hotel and Juliet) (4) Pricing for Echo = 110% x (Pricing for Juliet) (5)
Pricing for Golf = 90% x (Pricing for Juliet) (6)
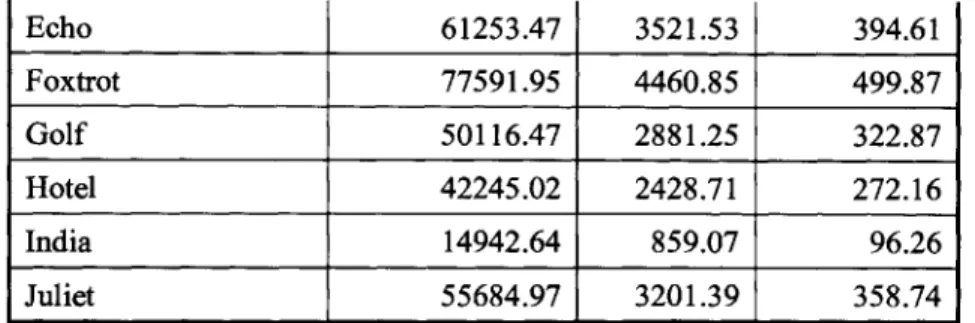
Tables 2 and 3 provide a line item summary by product category of the eventual estimated average U.S. dollar retail pricing.
Table 2 Average Retail Pricing for Product Categories at Facility A
Product Category Japanese Yen HKD USD
Alpha 8684.38 499.27 55.95
Bravo 39172.00 2252.04 252.36
Charlie 301697.94 17344.94 1943.63
Foxtrot 77591.95 4460.85 499.87
Golf 50116.47 2881.25 322.87
Hotel 42245.02 2428.71 272.16
India 14942.64 859.07 96.26
Juliet 55684.97 3201.39 358.74
Table 3 Average Retail Pricing for Product Category at Facility B
Product Category Japanese Yen HKD USD
Kilo 26098.19 1500.41 168.13
3.1.4.2 Value of Product Inventory On-Hand
Utilizing the estimated average U.S. retail pricing, the amount of inventory dollars within the confines of the distribution facilities was calculated from the following:
Total Inventory Retail Value = Retail Unit Pricing x Product QTY (7)
Based on the six-month data on initial inventory positions provided for FY12, the total inventory retail dollars at Facility A and B are shown in Figures 1 and 2 respectively.
Facility A -Total US$ MSRP Inventory Values by Month in FY12 $4 SJuliet india " hotel " Golf *Foxtrot *Echo a Delta a Charlie *Bravo * Alpha
Sept FY12 October FY12 November FY12 Decernber FY12
Month In FY12
January FYt2 February FY12
Figure 1 Monthly US$ MSRP Inventory Values, Facility A
Facility B -Total US$ MSRP Inventory Values by Month In FY12
$0.45 $040 5030 m Kilo $0.20 $0.15 $0.10 50.05
Sept FY12 Oct FY12 Nov FY12 Dec FY12 Jan FY12 Feb FY12
Figure 2 Monthly US$ MSRP Inventory Values, Facility B s
3.1.4.3 Value of Outbound Product Flows
Product flows, especially those relating to outbound shipments, are indicative of the relative health of a company's revenue stream. Hence, particular focus is given to the historical quantity of outbound shipments based on data available for FY12 and FY13. The following general
equation describes the value of outbound product flows, in terms of retail dollars that may be lost, due to any disruption of outbound shipments:
Value of Outbound Product Flows
= Retail Unit Pricing x Outbound Shipment QTY (8)
3.1.4.4 Impact Analysis by Scenario
With the aforementioned definitions of the value of product inventory on-hand and the value of outbound product flows, BIA was then conducted for the two distribution facilities experiencing each of the four hypothetical scenarios.
Scenario 1: The facility was rendered inaccessible
When a facility was rendered inaccessible due to a disruption event, one might expect both inbound and outbound shipments at the facility to come to a halt. In defining this particular scenario, the assumption was that there was no damage to physical inventories already at the facility. Hence, the financial impact from Scenario 1 is comprised of (a) the lost revenue from disrupted shipments to customers, and (b) the additional rental costs from operating out of a third-party location for the period of time necessary before regular operations at the facility can be restored. This duration of time taken to restore full accessibility to the facility for resumption of normal operations after the occurrence of a disruption event is defined as TTR.
customer has stocked-out from depletion of its inventory on-hand. As for the additional costs of operating out of a third-party location, the assumption made is that the costs begin to accrue immediately after the occurrence of the disruption event up until the disrupted facility is restored with full accessibility as well as the resumption of normal operations. Hence, the financial impact on the company due to Scenario 1 is generally defined in mathematical terms as:
Scenario 1 Financial Impact = [(Per Day Revenue Lost from Disrupted Customer
Shipments) x (Days TTR - Customer Inventory Days On Hand)] + [Daily Rental
Costs at 3 rd Party Location x Days TTR] (9)
where Per Day Revenue is lost only when Days TTR > Customer Inv. Days On Hand.
Scenario 2: The facility was accessible, but 50% of the merchandise was damaged This particular scenario is defined as the circumstance whereby the facility remains
accessible, although 50% of the inventory on-hand is taken as damaged. Since accessibility to the facility is not in question, it is assumed that regular outbound shipment of undamaged goods is able to resume after the disruption event. Hence, the financial impact from Scenario 2 is
comprised of (a) the value of inventory on-hand that was damaged, and (b) the lost revenue from the consequent disruption of product shipments to customers. The duration of time taken by the facility to replace damaged product in order for the resumption of those product shipments to customers after the disruption event is defined as TTR.
Lost revenue from the consequent disruption of product shipments to customers due to damaged goods at the facility occurs only after the customer has stocked-out from depletion of its inventory on-hand. Hence, the financial impact on the company due to Scenario 2 is generally defined in mathematical terms as:
Scenario 2 Financial Impact = (Cost of Damaged Merchandise) + [(Per Day Revenue Lost from Disrupted Customer Shipments Due to Damaged Inventory) x (Days TTR - Customer
Inventory Days On Hand)] (10) where Per Day Revenue is lost only when Days TTR > Customer Inv. Days On Hand.
Scenario 3: Data center failure
Scenario 3 involves the failure of a data center which is central to all information processing and transactions relevant to the company's operations at the facility. Given such a circumstance, it is assumed that all inbound and outbound shipments are only able to occur at a much lower level of productivity since workers have to resort to manual processes when the computer systems are malfunctioning. In this case, TTR is the duration of time taken for IT to restore the company's data center operations to enable the resumption of regular productivity levels in
outbound shipment processing. It is however also important to note that it may be possible that no customer shipments could be made manually at all.
During the data center failure, revenue is lost by the company only after the customer has stocked-out from the depletion of its inventory on-hand. Hence, the financial impact on the company due to Scenario 3 is generally defined in mathematical terms as:
Scenario 3 Financial impact = (Per Day Revenue Lost from Reduced Productivity Levels in Outbound Shipment Processing) x (Days TTR - Customer Inventory Days On Hand)
(11)
where reduced productivity impacts only when Days TTR > Customer Inv. Days On Hand.
Scenario 4: E-commerce global contact center breakdown.
The final scenario involves the failure of the company's global contact center which impacts its e-commerce business activities. In this case, all physical inventory remains in saleable
condition, however outbound shipments that are due to e-commerce activities, estimated at 30% of total outbound shipments, are disrupted. The magnitude of financial impact due to a disruption of the organization's global contact center is hence given by:
Scenario 4 Financial impact = (Per Day Revenue Lost from Disrupted Outbound E-Commerce Shipments) x (Days TTR - Inventory Days On Hand at E-Commerce
Fulfillment Center) (12)
where Per Day Revenue is lost only when Days TTR > Inv. Days On Hand at Fulfillment Center.
3.2 INDUSTRY COMPARISONS AND BENCHMARKING
The qualitative element of our study involved interviewing BCP and risk management
professionals to gather valuable insights from across various industries, including CPG, medical, logistics, service and manufacturing organizations.
During the initial stages of developing a questionnaire, both in-person interviews and written surveys were being considered. However, after developing several versions of the questionnaire, it was decided that an in-person/phone interview approach would better allow us to achieve our key research objective, which was to provide a directional sense of key areas in BCP.
3.2.1 Participant Identification
Efforts were made to identify and invite BCP and supply chain risk management professionals to participate in our study. MIT Center for Transportation and Logistics (CTL) was approached to
assist with providing a quick shortlist of industry contacts with the requisite knowledge and experience in the areas of risk management and business continuity planning.
We reached out to 17 professionals working in various organizations across industries. Several of these invitees had direct experience with business continuity planning and risk management, while others saw need to delegate our invites to colleagues whom they thought were better able to speak with us. In total, we had favorable responses from eight invitees.
Of the eight study participants, all had experience with risk management and six had direct experience with business continuity planning. The eight participants related their experiences across 11 industries, either from their previous or current place-of-employment.
3.2.2. Interview Questionnaire
A series of questions was designed to help us understand business continuity management within the context of the study participant's experience. The questionnaire consisted of four parts: product attributes and demand patterns, supply chain set-ups, business continuity plans, and wrap-up questions.
The first part of the questionnaire aimed at understanding the main objective in the supply chain to create business value, as well as the key procedures and critical assets in the business to protect. In the second part, we looked at the supply chain design of the organization to identify critical nodes and links in the system. The supply chain set-up was based on the key attributes of the business, which were identified in the first part of the questionnaire. Next, we examined the specific business continuity planning for the organization, including what the development process was, which parties were involved in decision-making and what resources were invested.
In this section, we also asked for past experiences in disruptions, if any, and what were the responses and lessons learned. Finally, we closed the discussion by providing an opportunity for respondents to bring up anything important they thought was not covered.
3.3 LIMITATIONS
Quantitative BIA was only able to establish rough estimates of financial impact on the company based on high-level data along with a number of assumptions forming the base case of the analysis for each impact scenario.
As for the qualitative element of our study, the primary limitation of the interview approach was the duration of the interviews and the limited number of participants. With more
interviewees and longer time for discussion, we may have had a more thorough understanding of the BCP practices for different industries. In addition, all of the participants had experience with risk management or business continuity planning, and thus the results may not be representative of industry norms.
4. DATA ANALYSIS
We begin our quantitative analysis by applying our BIA model (see 3.1 Business Impact Analysis Model) to available data. The resulting estimated financial impacts at the two facilities due to each of the four hypothetical scenarios are presented in 4.1 Business Impact Analysis.
Qualitative analysis based on interviews conducted with the eight study participants from industry are presented in 4.2 Interview Results.
4.1 BUSINESS IMPACT ANALYSIS
4.1.1 Business Impact Analysis for Facility A
Scenario 1: The facility was rendered inaccessible
The following table lists input parameters utilized in the BIA model:
Table 4 BIA model input parameters for Scenario 1 at Facility A Description of Input Parameter Scenario 1 Value Contingency warehouse monthly rental [$/sq. ft.] $ 5.00
Contingency warehouse space required [sq. ft.] 500,000 Total monthly rental cost of contingency Material
Handling Equipment (MHE) [$/month]
% Revenue from wholesale customers 50%
% Revenue from retail store customers 20%
% Revenue from E-commerce 30%
Days inventory held by E-commerce fulfilment ctr. 7 Days inventory held by retail store customers 14 Days inventory held by wholesale customers 20
TTR (days) 10 or 30 days
been rendered inaccessible. The company is assumed to have activated its contingency plan of operating out of a third-party location while efforts are being made to restore accessibility to Facility A. Therefore, our analysis of financial impact from Scenario 1 takes into consideration (a) the lost revenue from disrupted shipments to customers, and (b) the additional costs associated with rent of capital assets to operate out of the third-party facility.
Lost revenue from disrupted shipments occurs only after the customer has stocked-out from depletion of its inventory on-hand. This has been taken into account by our BIA model for each of the three main customer segments served by Facility A, namely: wholesale, retail and
e-commerce. As for the additional costs associated with rent of capital assets, the costs are assumed to accrue immediately after the occurrence of the disruption event.
TTR in Scenario 1 at Facility A is defined as the duration of time taken to restore full accessibility to the facility for resumption of normal operations after the occurrence of the disruption event. As an initial baseline for comparison, we seek to quantify the financial impact resulting from a short TTR of 10 days, as well as that for a relatively longer TTR of 30 days. Based on the BIA model input parameters utilized for Scenario 1 at Facility A, Figure 3 below was obtained which provides a graphical representation of the estimated financial impacts, which varies by the month in which the disruption occurs, when TTR is 10 days versus 30 days.
billion $1.40 $1.20 $1.00 $0.80 $0.60 $0.40 $0.20 10 Vs. 30 days TTR
BIA for Scenario 1
@
Facility A--- Scenario 1, TTR = 10 days -U-Scenario 1, TTR = 30 days IV-~Zv A >AASVA&V
~;,
&o &
0
~44OFigure 3 BIA for Scenario 1 at Facility A
Estimated financial impact at Facility A is observed to peak in the month of March FY12. The occurrence of a disruption event in the month of December FY12 instead would, however, result in the least financial impact on the company. When analyzed as a function of TTR, the peak and lowest financial impact months are illustrated by Figure 4 below.
Ag
$
'4
BIA for Scenario 1
@
Facility A
$2.50--4-Peak Impact Month of Mar. FY12
$2.00 - -G-Lowest Impact Month of Dec. FYI 2
$2.00___ $1.50 $1.00 $0.50 -$0.00 iKm 0 10 20 30 40 50 TTR (Days)
Figure 4 BIA for Scenario 1 at Facility A from a disruption event occurring in the peak and lowest impact months of FY I2/FY 13
The above graph allows us to recognize that the financial impact due to a disruption event occurring in March FY12 is more sensitive to TTR than that due to a disruption event occurring in December FY12. Additionally, it may be in the interest of the company to establish, as part of its BCP, a TTR goal of 20 days as financial repercussions from the disruption event increases at the greatest rate after 20 days.
Scenario 2: The facility was accessible, but 50% of the merchandise was damaged The following table lists input parameters utilized in the BIA model:
Table 5 BIA model input parameters for Scenario 2 at Facility A
Description of Input Parameter Scenario 2 Value
% Revenue from wholesale customers 50%
% Revenue from retail store customers 20%
% Revenue from E-commerce 30%
Days inventory held by E-commerce fulfilment ctr. 7 Days inventory held by retail store customers 14 Days inventory held by wholesale customers 20
Amount of merchandise damaged 50%
Average COGS / Average MSRP 0.70
TTR (days) 10 or 30 days
In Scenario 2, accessibility to Facility A is not in question. Hence, it is assumed that regular outbound shipment of undamaged goods is able to resume after the disruption event. Financial impact from Scenario 2 would therefore be comprised of (a) the value, at cost, of inventory on-hand that was damaged, and (b) the lost revenue from the consequent disruption of product shipments to customers. The duration of time taken by the facility to replace damaged product in order for the resumption of those product shipments to customers after occurrence of the
disruption event is defined as TTR. As an initial baseline for comparison, we seek to quantify the financial impact resulting from a short TTR of 10 days, as well as that for a relatively longer TTR of 30 days.
Lost revenue, from not being able to ship product that has become damaged, occurs only after the customer has stocked-out from depletion of its inventory on-hand. This is taken into account by our BIA model for each of the three main customer segments served by Facility A, namely: wholesale, retail and e-commerce.
Based on the BIA model input parameters utilized for Scenario 2 at Facility A, Figure 5 below was obtained which provides a graphical representation of the estimated financial impacts
on Facility A, which varies by month in which the disruption occurs, when TTR is 10 days versus 30 days. billion $1.80 $1.60 $1.40 $1.20 $1.00 $0.80 $0.60 $0.40 $0.20
10 Vs. 30 days TTR
BIA for Scenario 2
@
Facility A
-M- S 2 =
-U-Scenario 2, TTR = 10 days
-4-Scenario 2, TTR = 30 days
-
-AA~
Figure 5 BIA for Scenario 2 at Facility A
Scenario 2 financial impact at Facility A is observed to peak in the month of March FY12. The occurrence of a disruption event in the month of December FY1 2 instead would, however, result in the least financial impact on the company. When analyzed as a function of TTR, the peak and lowest financial impact months are illustrated by Figure 6 below.
BIA for Scenario 2
@
Facility A
$2.50--4-Peak Impact Month of Mar. FY12 -U-Lowest Impact Month of Dec. FY12 $2.00 $1.50 -$1.00 $0.50 $0.00 I 0 10 20 30 40 50 TTR (Days)
Figure 6 BIA for Scenario 2 at Facility A from a disruption event occurring in the peak and lowest impact months of FY I2/FYi 3
The above graph allows us to recognize that the financial impact suffered from having to write-off damaged goods is not insignificant; it amounts to nearly $1 billion. Additionally, the financial impact from a disruption event occurring in March FY12 is more sensitive to TTR than that due to a disruption event occurring in December FY12. Since financial repercussions from the disruption event increases at the greatest rate after 20 days has elapsed, a company may choose to establish, as part of its BCP, a TTR goal of 20 days.
The following table lists input parameters utilized in the BIA model:
Table 6 BIA model input parameters for Scenario 3 at Facility A
Description of Input Parameter Scenario 3 Value
% Revenue from wholesale customers 50%
% Revenue from retail store customers 20%
% Revenue from E-commerce 30%
Days inventory held by E-commerce fulfilment ctr. 7 Days inventory held by retail store customers 14 Days inventory held by wholesale customers 20
Outbound shipment productivity lost 40%
TTR (days) 10 or 30 days
In Scenario 3, it is assumed that all shipment operations at Facility A are able to continue, but at a much lower level of productivity since workers have to resort to manual processes when the computer systems are malfunctioning. TTR in Scenario 3 is therefore defined as the duration of time taken for IT to restore the company's data center operations to enable the resumption of regular productivity levels in outbound shipment processing. As an initial baseline for
comparison, we seek to quantify the financial impact resulting from a short TTR of 10 days, as well as that for a relatively longer TTR of 30 days.
Based on the BIA model input parameters utilized for Scenario 3, Figure 7 below provides a graphical representation of the estimated financial impacts at Facility A, which varies by month in which the disruption occurs, when TTR is 10 days versus 30 days.
10 Vs. 30 days TTR
BIA for Scenario 3
@ Facility A
-*-Scenario 3, TTR = 10 days -*-Scenario 3, TTR = 30 days A~A A A $- ]~~ 4 ( 4(
)~
S,&
-A. k - &k AA>g (~ (~~
k
4 AN, ( ; 4Figure 7 BIA for Scenario 3 at Facility A
Scenario 3 financial impact at Facility A is observed to peak in the month of March FY12. The occurrence of a disruption event in the month of December FY12 instead would, however, result in the least financial impact on the company. When analyzed as a function of TTR, the peak and lowest financial impact months are illustrated by Figure 8 below.
billion $0.60 $0.50 $0.40 $0.30 $0.20 $0.10 Win
BIA for Scenario 3
@
Facility A
$1.00---U-Peak Impact Month of Mar. FY12 $0.90
$.0-+-Lowest Impact Month of Dec. FYI 2
$0.80 $0.70 $0.60 -$0.50 $0.40 -$0.30 -$0.20 $0.10 -$0.00 0 10 20 30 40 50 TTR (Days)
Figure 8 BIA for Scenario 3 at Facility A from a disruption event occurring in the peak and lowest impact months of FY12/FY13
The above graph allows us to recognize that the financial impact, due to a disruption event, is more sensitive to TTR in March FY12 than in December FY12. Additionally, it may be in the interest of the company to establish, as part of its BCP, a TTR goal of 20 days as financial repercussions from the disruption event increases at the greatest rate after 20 days has elapsed.
Scenario 4: E-commerce global contact center breakdown
Table 7 BIA model input parameters for Scenario 4 at Facility A
Description of Input Parameter Scenario 4 Value
% Revenue lost due to disruption of E-commerce 30% Days inventory held by E-commerce fulfillment ctr. 7
TTR (days) 10 or 30 days
In Scenario 4, a breakdown of the company's global contact center impacts only its e-commerce activities. TTR in Scenario 4 is therefore defined as the duration of time taken for the resumption of E-commerce outbound shipments to the company's E-commerce fulfillment center. As an initial baseline for comparison, we seek to quantify the financial impact resulting from a short TTR of 10 days, as well as that for a relatively longer TTR of 30 days.
Based on the BIA model input parameters utilized for Scenario 4, Figure 9 below provides a graphical representation of the estimated financial impacts at Facility A, which varies by month in which the disruption event occurs, when TTR is 10 days versus 30 days.
billion $0.60 $0.50 $0.40 $0.30 $0.20 $0.10
10 Vs. 30 days
TTR
BIA for Scenario 4 @ Facility A
--- Scenario 4, TTR = 10 days
-@-Scenario 4, TTR = 30 days
I II I I
Figure 9 BIA for Scenario 4 at Facility A
Scenario 4 fmancial impact at Facility A is observed to peak in the month of March FY12. The occurrence of a disruption event in the month of December FY1 2 instead would, however, result in the least financial impact on the company. When analyzed as a function of TTR, the peak and lowest financial impact months are illustrated by Figure 10 below.
BIA for Scenario 4
@
Facility A$1.00
--0-Peak Impact Month of Mar. FY12 $0.90
$0.80 -+---Lowest Impact Month of Dec. FYI 2
$0.80 -$0.70 $0.60 - -S$0.50 $0.40 -$0.30 $0.20 -$0.10 -$0.00 0 10 20 30 40 50 TTR (Days)
Figure 10 BIA for Scenario 4 at Facility A from a disruption event occurring in the peak and lowest impact months of FY 1 2/FY 13
The above graph allows us to recognize that the financial impact, due to a disruption event, is more sensitive to TTR in March FY12 than in December FY12. Additionally, it may be in the interest of the company to establish, as part of its BCP, a TTR goal of 7 days in order not to suffer any financial impact from the breakdown of its global contact center.
4.1.2 Business Impact Analysis for Facility B
The same analysis that was done for Facility A is repeated for Facility B. Scenario 1: The facility was rendered inaccessible
The following table lists input parameters utilized in the BIA model:
Table 8 BIA model input parameters for Scenario 1 at Facility B Description of Input Parameter for Facility B Scenario 1 Value Contingency warehouse monthly rental [$/sq. ft.] $ 5.00
Contingency warehouse space required [sq. ft.] 500,000
Total monthly rental cost of contingency Material Handling Equipment (MHE) [$/month]
% Revenue from wholesale customers 100%
% Revenue from retail store customers 0%
% Revenue from E-commerce 0%
Days inventory held by E-commerce fulfilment ctr. 7
TTR (days) 10 or 30 days
As was the case for Facility A, shipments out of Facility B cannot occur when it has been rendered inaccessible. The company is only able to re-route inbound product flow to a
contingency, third-party distribution facility in order to continue on with shipping these products to customers. Hence, our analysis of financial impact from Scenario 1 takes into consideration (a) the lost revenue from disrupted customer shipments due to an inaccessible Facility B, and (b) the additional costs associated with rent of capital assets to operate out of the contingency third-party warehouse.
Since Facility B, unlike Facility A, serves only wholesale customers, our BIA model requires the input parameters to be updated to state that zero percent of revenue is derived from e-commerce and retail store customers. As was our previous analysis for Facility A, TTR for Scenario 1 at Facility B is also defined as the duration of time taken to restore full accessibility to the facility for resumption of normal operations after the occurrence of the disruption event. As an initial baseline for comparison, we seek to quantify the financial impact resulting from a short TTR of 10 days, as well as that for a relatively longer TTR of 30 days.
Based on the BIA model input parameters utilized for Scenario 1 at Facility B, Figure 11 below was obtained which provides a graphical representation of the estimated financial impacts at Facility B, which vary by month in which the disruption event occurs, when TTR is 10 days versus 30 days.
10 Vs. 30 days TTR
BIA for Scenario 1
@ Facility B
$40.00 $35.00 $30.00 $25.00 $20.00 $15.00 -4-Scenario 1, TTR = 10 days $10.00 -U-Scenario 1, TTR = 30 days $5.00
Figure 11 BIA for Scenario 1 at Facility B
It is noted that when TTR is 10 days, the financial impact to the company of $850k is due only to the additional cost of renting capital assets to operate out of the third-party distribution facility. This is explained by the fact that Facility B has yet to experience any loss in revenue
since their wholesale customers have not run out of inventory on-hand given that these customers were assumed to carry 20 days' worth of inventory on-hand. When TTR is extended to 30 days,
it is observed that the estimated financial impact at Facility B peaks in the month of June FY1 3.
The occurrence of a disruption event in the month of May FY12 instead would, however, result in the least financial impact on the company. When analyzed as a function of TTR, the peak and lowest financial impact months are illustrated by Figure 12 below.
$80.00 $70.00 $60.00 $50.00 $40.00 $30.00 $20.00 $10.00 $0.00
BIA for Scenario 1
@
Facility B-U-Peak Impact Month of June FY13
-4-Lowest Impact Month of May FY12
TTR (Days)
Figure 12 BIA for Scenario 1 at Facility B from a disruption event occurring in the peak and lowest impact months of FY I2/FY 13
From the above graph of how financial impact varies with TTR, we are able to recognize that the company may want to establish, as part of its BCP, a TTR goal of 20 days. Beyond the
20 40 50