Publisher’s version / Version de l'éditeur:
Analytical Chemistry, 77, 1, pp. 344-349, 2004-12-02
READ THESE TERMS AND CONDITIONS CAREFULLY BEFORE USING THIS WEBSITE. https://nrc-publications.canada.ca/eng/copyright
Vous avez des questions? Nous pouvons vous aider. Pour communiquer directement avec un auteur, consultez la
première page de la revue dans laquelle son article a été publié afin de trouver ses coordonnées. Si vous n’arrivez pas à les repérer, communiquez avec nous à PublicationsArchive-ArchivesPublications@nrc-cnrc.gc.ca.
Questions? Contact the NRC Publications Archive team at
PublicationsArchive-ArchivesPublications@nrc-cnrc.gc.ca. If you wish to email the authors directly, please see the first page of the publication for their contact information.
NRC Publications Archive
Archives des publications du CNRC
This publication could be one of several versions: author’s original, accepted manuscript or the publisher’s version. / La version de cette publication peut être l’une des suivantes : la version prépublication de l’auteur, la version acceptée du manuscrit ou la version de l’éditeur.
For the publisher’s version, please access the DOI link below./ Pour consulter la version de l’éditeur, utilisez le lien DOI ci-dessous.
https://doi.org/10.1021/ac048637e
Access and use of this website and the material on it are subject to the Terms and Conditions set forth at
Determination of methionine and selenomethionine in
selenium-enriched yeast by species-specific isotope dilution with liquid
chromatography-mass spectrometry and inductively coupled plasma
mass spectrometry detection
McSheehy, Shona; Yang, Lu; Sturgeon, Ralph; Mester, Zoltan
https://publications-cnrc.canada.ca/fra/droits
L’accès à ce site Web et l’utilisation de son contenu sont assujettis aux conditions présentées dans le site LISEZ CES CONDITIONS ATTENTIVEMENT AVANT D’UTILISER CE SITE WEB.
NRC Publications Record / Notice d'Archives des publications de CNRC:
https://nrc-publications.canada.ca/eng/view/object/?id=e7cb1604-6eb4-4289-986e-a2a184b65dce
https://publications-cnrc.canada.ca/fra/voir/objet/?id=e7cb1604-6eb4-4289-986e-a2a184b65dce
Technical Notes
Determination of Methionine and
Selenomethionine in Selenium-Enriched Yeast by
Species-Specific Isotope Dilution with Liquid
Chromatography-Mass Spectrometry and
Inductively Coupled Plasma Mass Spectrometry
Detection
Shona McSheehy, Lu Yang, Ralph Sturgeon, and Zoltan Mester*
Institute for National Measurement Standards, National Research Council of Canada, Ottawa, Ontario, Canada K1A 0R9
Selenomethionine (SeMet) and methionine (Met), liber-ated by acid hydrolysis of selenium-enriched yeast, were quantified by liquid chromatography-mass spectrometry (LC/MS) using standard additions calibrations as well as isotope dilution (ID) based on species-specific 13C-enriched spikes. LC inductively coupled plasma mass spectrometry (ICPMS) was also employed for the quan-tification of SeMet, and74Se-enriched SeMet was used for ID calibration. The results were evaluated to ascertain the feasibility of using these methods in a campaign to certify selenized yeast. Good agreement was found between the methods, which, when averaged, gave concentrations of 5482.2 ( 101 and 3256.9 ( 217.4 µg/g for Met and SeMet, respectively. This corresponds to a 1.68:1 Met-to-SeMet ratio in the yeast. Quantification by ID LC/MS and LC ICPMS yields the most precise sets of results with relative standard deviations in the range 0.5-1.3% (n ) 6). A total selenium concentration of 2064.6 ( 45.4 µg/g was obtained for this yeast material. The extraction efficiency and a mass balance budget were determined. Acid hydrolysis liberated 81.0% of the total selenium present. SeMet comprised 79.0% of the extracted sele-nium and 63.9% of the total selesele-nium present in the yeast. Since the discovery in 1957 that selenium is an essential trace element for mammals,1it has been increasingly implicated in a beneficial role for human health. Selenium is an essential trace element, present in several proteins as selenocysteine, and selenium availability is directly linked to the regulation of sele-noprotein expression.2Due to low levels of selenium available in the average human diet in certain geographic areas,3it has become increasingly popular to use supplements. As well as maintaining
adequate levels of selenium in the body, the use of supplements has been shown to prevent cancer in humans,4act as an antiviral agent, and play a preventative role in several syndromes associated with deficiencies.5 Selenium is most often supplemented in the form of selenomethionine (SeMet): the major form found naturally occurring in foods and generally thought of as one of the most bioavailable. Selenium-enriched yeast has become the most popular matrix for food supplements as it contains SeMet as the major species and is economically viable. Inorganic selenium in yeast growth media intrudes on the sulfur assimilation pathway, ultimately forming SeMet. The SeMet is then believed to be nonspecifically incorporated into the protein in the place of Met.5 Due to limited regulations for food supplements, there is a need for robust methodology characterizing Se-enriched supple-ments to ensure that they contain the appropriate dosage and the particular form of selenium that is most beneficial. Most studies have focused on identification and quantification of SeMet in supplements. For the quantification of SeMet, degradation of all proteins to their constituent amino acids, either enzymatically or via acid hydrolysis, is required. Many protocols employ an element specific mode of detection, such as inductively coupled plasma mass spectrometry (ICPMS) coupled with liquid chromatography (LC).6-11Increasingly, electrospray mass spectrometry (ES MS)
* Corresponding author. Fax: 613 9932451. E-mail:zoltan.mester@nrc.ca. (1) Schwarz, K.; Foltz, C. M. J. Am. Chem. Soc. 1957, 79, 3292-3293. (2) Kohrle, J.; Brigelius-Flohe, R.; Bock, A.; Gartner, R.; Meyer, O.; Flohe, L.
Biol. Chem.2000, 381, 849-864.
(3) Schrauzer, G. N. J. Nutr. 2000, 130, 1653-1656.
(4) Clark, L. C.; Combs, G. F.; Turnbull, W. B.; Slate, E. H.; Chalker, D. K.; Chow, J.; Davis, L. S.; Glover, R. A.; Graham, G. F.; Gross, E. G.; Krongrad, A.; Lesher, J. L.; Park, H. K.; Sanders, B. B.; Smith, C. L.; Taylor, J. R. J.
Am. Med. Assoc.1996, 276, 1957-1963.
(5) Hatfield, D. L., Ed. Selenium: Its molecular biology and role in human health; Kluwer Academic Publishers: Boston, 2001.
(6) B′Hymer, C.; Caruso, J. A. J. Anal. At. Spectrosc. 2000, 15, 1531-1539. (7) Marchante-Gayon, J. M.; Thomas, C.; Feldmann, I.; Jakubowski, N. J. Anal.
At. Spectrosc.2000, 15, 1093-1102.
(8) Wrobel, K.; Kannamkumarath, S. S.; Wrobel, K.; Caruso, J. S. Anal. Bioanal.
Chem.2003, 375, 133-138.
(9) Larsen, E. H.; Sloth, J.; Hansen, M.; Moesgaard, S. J. Anal. Atom. Spectrom. 2003, 18, 310-316.
(10) Uden, P. C.; Boakye, H. T.; Kahakachchi, C.; Hafezi, R.; Nolibos, P.; Block, E.; Johnson, S.; Tyson, J. F. J. Anal. At. Spectrom. 2004, 19, 65-73. (11) Lobinski, R.; Edmonds, J. S.; Suzuki, K. T.; Uden, P. C. Pure Appl. Chem.
2000, 72, 447-461. Anal. Chem.2005,77,344-349
has been utilized,12-14where the distinguishing isotopic profile of selenium can be exploited for identification. However, ES MS has not been the method of choice for quantification of SeMet. Similarly, in gas chromatography/mass spectrometry (GC/MS), the characteristic selenium isotopic profile can be observed,10,15-17 but derivatization of the selenium species is needed to render a volatile product for separation on the GC column.
In regulated environments, quantitative measurements are validated using certified reference materials (CRMs), against which an analyst may compare results. Unfortunately, production of CRMs is laborious and costly and so a limited range of materials is commercially available. With selenium becoming increasing relevant to the scientific community, it is the objective of the certified reference materials program of the National Research Council Canada to produce a CRM for selenized yeast. Optimiza-tion of the extracOptimiza-tion procedure and the development of an in-house reference method based on isotope dilution (ID) GC/MS have already been completed and described elsewhere.18-20Good agreement among quantitative measurements derived from use of several different analytical techniques is needed for certification. This study was undertaken to provide accurate and precise data for SeMet and Met concentrations in a selenium-enriched yeast using LC-based techniques. Results are compared to those generated using in-house reference method.
Several calibration strategies for quantification of analyte compounds in a given matrix exist, including external calibration, standard additions (prior to and after the sample treatment), and isotope dilution. The latter, a more accurate and precise method than the method of standard additions, has been increasingly applied to bioinorganic speciation, especially for organotin21and organomercury22species-specific measurements. To date though, there are limited applications of species-specific isotope dilution for the speciation of selenium. Selenite (78Se-selenite) and selenate (78Se-selenate) were determined offline in natural water samples with microwave induced plasma MS.23 Species-specific ID of SeMet in enriched yeast supplements was determined with ID (74Se-SeMet) GC/MS16and LC/ICPMS (77Se-SeMet).24Speciation of selenium has been attempted with postcolumn ID ICPMS.25,26
The majority of ID applications to selenium, however, concern total selenium concentrations.15,26-28 Species-specific ID of bio-inorganic compounds with13C-enriched compounds has not as yet been exploited despite its customary use in LC/MS applica-tions for a range of small molecules in biological matrixes, including amino acid analysis.29,30Thus, it was proposed to quan-tify SeMet in the selenized yeast by species-specific ID using 13C-SeMet (LC/MS) in addition to ID quantification with 74 Se-SeMet (LC/ICPMS). Moreover, with LC/MS, the simultaneous quantification of Met by species-specific ID using13C-Met can be achieved.
EXPERIMENTAL SECTION
Instrumentation. A Thermo Finnigan TSQ quantum AM triple quadrupole instrument (San Jose, CA) was used for ES MS analysis. ES MS conditions (e.g., capillary voltage, lens voltage, multipole offset, and entrance voltage) were optimized for sele-nomethionine using the standard tune procedure, and typical conditions are outlined in Table 1. An ELAN 6000 (PE-Sciex, Thornhill, ON, Canada) ICPMS equipped with a Ryton spray chamber and cross-flow nebulizer was used for the detection of selenium species. ICPMS parameters (nebulizer gas flow, rf power, and lens voltage) were optimized daily using a standard procedure recommended by the manufacturer, and typical condi-tions are outlined in Table 1.
Anion-exchange HPLC separations were achieved using a Hamilton PRPx-100 (250 × 4.6 mm × 5 µm) column (Hamilton,
(12) Larsen, E. H.; Hansen, M.; Fan, T.; Vahl, M. J. Anal. At. Spectrom. 2001,
16, 1403-1408.
(13) Lindemann, T.; Hintelmann, H. Anal. Chem. 2002, 74, 4602-4610. (14) McSheehy, S.; Mester, Z. Trends Anal. Chem. 2003, 22, 210-224. (15) VanDael, P.; Barclay, D.; Longet, K.; Metairon, S.; Fay, L. B. J. Chromatogr.,
B1998, 715, 341-347.
(16) Wolf, W. R.; Zainal, H.; Yager, B. Fresenius J. Anal. Chem. 2001, 370, 286-290.
(17) Iscioglu, B.; Henden, E. Anal. Chim. Acta 2003, 505, 101-106. (18) Yang, L.; Mester, Z.; Sturgeon, R. E. Anal. Chem. 2004, 76, 5149-5156. (19) Yang, L.; Sturgeon, R. E.; Wolf, W. R.; Goldschmidt, R. J.; Mester, Z. J.
Anal. At. Spectrom.2004, 19, 1448-1453.
(20) Yang, L.; Sturgeon, R. E.; McSheehy, S.; Mester, Z. J. Chromatogr., A 2004,
1055, 177-184.
(21) Monperrus, M.; Zuloaga, O.; Krupp, E.; Amouroux, D.; Wahlen, R.; Fairman, B.; Donard, O. F. X. J. Anal. At. Spectrom. 2003, 18, 247-253. (22) Yang, L.; Colombini, V.; Maxwell, P.; Mester, Z.; Sturgeon, R. E. J.
Chromatogr., A2003, 1011, 135-142.
(23) Minami, H.; Cai, W.; Kusumoto, T.; Nishikawa, K.; Zhang, Q.; Inoue, S.; Atsuya, I. Anal. Sci. 2003, 19, 1359-1363.
(24) Reyes, L. H.; Sanz, F. M.; Espilez, P. H.; Marchante-Gayon, J. M.; Alonso, J. I. G.; Sanz-Medel, A. J. Anal. At. Spectrom., in press.
(25) Reyes, L. H.; Marchante-Gayon, J. M.; Garcia-Alonso, J. I.; Sanz-Medel, A.
J. Anal. At. Spectrom.2003, 18, 1210-1216.
(26) Huerta, V. D.; Reyes, L. H.; Marchante-Gayon, J. M.; Sanchez, M. L. F.; Sanz-Medel, A. J. Anal. At. Spectrom. 2003, 18, 1243-1247.
(27) MacLeod, F.; McGaw, B. A.; Shand, C. A. Talanta 1996, 43, 1091-1098. (28) Turner, J.; Hill, S. J.; Evans, E. H.; Fairman, B.; Wolff-Briche, C. S. J. J.
Anal. At. Spectrom.2000, 15, 743-746.
(29) Piraud, M.; Vianey-Saban, C.; Petritis, K.; Elfakir, C.; Steghens, J.-P.; Morla, A.; Bouchu, D. Rapid Commun. Mass Spectrom. 2003, 17, 1297-1311. (30) Qu, J.; Wang, Y.; Luo, G.; Wu, Z.; Yang, C. Anal. Chem. 2002, 74,
2034-2040.
Table 1. Experimental Conditions
ICPMS Operating Conditions nebulizer gas flow 0.7 L/min ICP rf power 1100 W lens voltage 10 V
ES MS Operating Conditions spray voltage 3000 V
capilliary temp 350°C sheath gas flow 40 auxiliary gas flow 10 tube lens 100
Anion-Exchange Chromatography Gradient Conditions
eluent A 20 mM ammonium acetate/ acetic acid, pH 4.7 eluent B 200 mM ammonium acetate/
acetic acid, pH 4.7 0-5 min 100% eluent A
5-30 min 100-0% eluent A, 0-100% eluent B 30-40 min 100% eluent B
flow rate 1.5 mL/min Reversed-Phase Chromatography
Gradient Conditions
eluent A 0.02% formic acid, 99.8% water eluent B 0.02% formic acid, 99.8% acetonitrile 0-5 min 100% eluent A
5-30 min 100-50% eluent A, 0-50% eluent B 30-40 min 50% eluent B
flow rate 0.2 mL/min
Reno, NV) with a PRPx-100 guard column (Hamilton). A Dionex BioLC, model LCM (Dionex Corp., Sunnyvale, CA) fitted with a 100-µL injection loop was employed for the anion-exchange HPLC separations. Reversed-phase separations were undertaken using a Prevail C18 (150 × 2.1 mm × 5 µm) column (Alltech, Deerfield, IL). A Hewlett-Packard HP 1100 pump with autosampler was used for the reversed-phase separations.
A CEM MDS-2100 closed-vessel microwave digestion system (Matthews) was employed for complete digestion of the yeast tissue for determination of total Se.
Reagents and Solutions. Analytical reagent grade chemicals were used throughout. Water was purified to 18.2 MΩ‚cm resistivity using a NANOpure mixed-bed ion-exchange system fed with reverse osmosis domestic feedwater (Barnstead/Thermolyne, Dubuque, IA). Acetic acid was purified in-house by sub-boiling distillation of reagent grade feedstock. Methanesulfonic acid (98% purity) was purchased from Fluka (Oakville, ON, Canada). OmniSolv acetonitrile and formic acid (98% purity) were purchased from EM Science (Gibbstown, NJ). Ammonium acetate was obtained from Sigma Aldrich (Oakville, ON, Canada).
Eluent B for anion-exchange chromatography was pre-pared from a mixture of 200 mL of acetic acid (1 M) and 200 mL of ammonium acetate (1 M) diluted to 1 L with water. Eluent A was prepared by diluting eluent A 10-fold. Eluents A and B for reversed-phase chromatography were prepared by adding 200 µL of formic acid to 1 L of water and 1 L of acetonitrile, respectively. The gradient elution programs employed for anion-exchange and reversed-phase chromatography are outlined in Table 1.
Standard stock solutions (1000 µg/mL) of natural abundance
L-methionine, seleno-DL-methionine and seleno-DL-cystine (Sigma Aldrich) were prepared by dissolving the target compound in water. Selenite and selenate were prepared from Na2SeO3 and Na2SeO4, respectively, purchased from Sigma Aldrich, and dis-solved in 0.8 M HCl. Selenoadenosylhomocysteine was isolated from an aqueous extract of selenized yeast by 2D LC. The chromatographic purity was verified by LC/ICPMS. ES MSnwas employed to confirm the identity of the species. A 1000 µg/mL elemental solution for determination of total selenium was purchased from SCP Science (Baie d’Urfe, PQ, Canada). For isotope dilution analysis, high-purity13C-enrichedL-methionine and 13C-enrichedDL-selenomethionine, purchased from Sigma Aldrich, were gravimetrically prepared in 1% HCl.74Se-enrichedL -sele-nomethionine (74SeMet) was donated by Dr. W. Wolf (Food Composition Laboratory, USDA, Beltsville, MD), and a stock solution of 450 µg/mL was prepared in 1% HCl. The solution concentration was verified using reverse isotope dilution GC/MS. Working solutions were prepared on the day of analysis by appropriate dilution of the stock solutions with water. The stock solutions were kept at 4°C in the dark.
Selenium-Enriched Yeast. The Se-enriched yeast tissues were provided by Lallemand-Institut Rosell (Montreal, PQ, Canada). Yeast preparation essentially consisted of growth in a Se-rich medium, followed by a heat treatment process intended to stop yeast growth and inhibit enzymatic activity.
Procedures and Sample Preparation. Microwave Digestion for Total Selenium Content Determination. For total analysis, a subsample (100 mg) of selenium-enriched yeast was weighed into
a clean, dry Teflon microwave bomb. Nitric acid (7 mL) and hydrogen peroxide (200 µL) were added, and the sample was digested by closed-vessel microwave digestion. The digestion conditions were as follows: 10 min at 20 psi and 40% power, 10 min at 40 psi and 40% power, 15 min at 85 psi and 60% power, and 30 min at 120 psi and 70% power. After cooling, the contents of the bomb were transferred to a volumetric flask and diluted to 50 mL with water. The selenium content was then determined by the method of standard additions with off-line ICPMS.
Acid Hydrolysis: Postsample Treatment Standard Addition for Determination of SeMet and Met by LC/MS and Determination of SeMet Content by LC/ICPMS. The extraction procedure employed for the yeast was based on a method developed by Wrobel et al.8 For each replicate, one subsample (250 mg) of selenium-enriched yeast was weighed into a clean, dry conical flask. The appropriate volumes of water and methanesulfonic acid were added to give a concentration of 4 M methanesulfonic acid (24 mL). The sample was subjected to reflux on a hot plate for 16 h with glass beads acting as antibumping granules. After cooling, the digest was transferred to a volumetric flask and diluted to 100 mL with water. Known masses of SeMet and Met were added to aliquots of the prepared sample, to make solutions that contained close to two and three times the concentration of the target species. The solutions were filtered (0.45 µm) prior to injection.
Acid Hydrolysis: Presample Treatment Standard Addition Spik-ing for Determination of SeMet and Met Content by LC/MS and Determination of SeMet Content by LC/ICPMS. For each replicate, three subsamples (250 mg) of selenium-enriched yeast were weighed into clean, dry conical flasks. Known masses of SeMet and Met were added to the yeast to make final solutions that contained close to two and three times the concentration of the target species. The above acid reflux procedure was followed, and the digests, diluted to 100 mL with water, were filtered (0.45 µm) prior to injection.
Acid Hydrolysis: Isotope Dilution Spiking for Determination of SeMet and Met Content by LC/MS. For each replicate, one subsample (250 mg) of selenium-enriched yeast was weighed into a clean, dry conical flask. A suitable mass of 13C-SeMet and 13C-Met spikes was added to the yeast, and the above acid reflux procedure was followed. The digests were diluted to 100 mL with water and filtered (0.45 µm) prior to injection.
Acid Hydrolysis: Isotope Dilution Spiking for Determination of SeMet Content by LC/ICPMS. For each replicate, one subsample (250 mg) of selenium-enriched yeast was weighed into a clean, dry conical flask. A known mass of74Se-SeMet was added to the yeast, and the above acid reflux procedure was followed. The digests were diluted to 100 mL with water and filtered (0.45 µm) prior to injection.
RESULTS AND DISCUSSION
Determination of Total Selenium Content. For this study, closed-vessel microwave digestion with nitric acid and hydrogen peroxide was employed. The yeast was completely solubilized and Se quantified by the method of standard additions using ICPMS. A total selenium concentration of 2064.6 ( 45.4 µg/g (n ) 6, RSD ) 2.2%) was obtained.
Extraction of SeMet and Met. A complete hydrolysis of yeast protein into its constituent amino acids is necessary for the quantitative extraction of SeMet and Met. Aqueous extractions
are incapable of digesting proteins and liberating the bulk of SeMet from an enriched yeast; generally only 10-25% of the total selenium is extracted.7,31 Recent studies employing enzymatic digestion have shown that SeMet accounted for 50%6and 46%8of the total selenium in a supplement and a selenized yeast, respectively. Acid hydrolysis of the same samples yielded SeMet extraction efficiencies of 63%6and 65%8 in the supplement and selenized yeast, respectively. Although enzymatic digestion is a popular extraction method for samples of high protein content, it has been suggested that incomplete digestion of the proteins occurs.8 An in-house study of several extraction protocols20 concluded that using methanesulfonic acid for acid hydrolysis, based on a slightly modified method developed by Wrobel et al.,8 was the most effective, reproducible, and cost-efficient approach for yeast.
Isotope Dilution Calculations. The following equation was used in isotope dilution analysis for the quantitation of analytes in the yeast digest:
where Cx is the analyte concentration (µg/g), Cy is the spike concentration (µg/g), vy is the volume (mL) of spike used to prepare the blend solution of sample and spike, mxis the mass (g) of sample used, Ayis the abundance of the reference ion in the spike, Byis the abundance of spike ion in the spike, Axis the
abundance of reference ion in the sample, Bxis the abundance of spike ion in the sample, Rnis the measured reference/spike ion ratio (mass bias corrected) in the blend solution of sample and spike, AWxis the atomic weight of analyte in the sample, and AWy is the atomic weight of analyte in the spike.
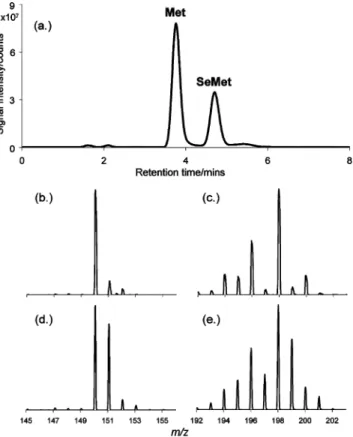
The relative abundances of natural and enriched species for isotope dilution analysis with LC/MS were calculated by a software program (Isotope Pattern Calculator v 3.0) developed by Yan32 and are summarized in Table 2. These data were used to calculate the theoretical reference-to-spike ion ratios needed for eq 1. For isotope dilution analysis using ICPMS, the isotopic compositions of Se isotopes recommended by IUPAC33 were used for the calculations. The mass bias correction factor (the ratio of “theoretical to-spike ion ratio” to “measured reference-to-spike ion ratio”) was based on a set of five replicate measure-ments of natural abundance standards, matrix matched with the same concentration of methanesulfonic acid as in the samples. LC/MS Analysis of Yeast Digest. The most commonly used separation mechanism for the on-line analysis of amino acids by LC/MS is reversed-phase ion pairing.29,30As only two amino acids were the target of this study, reversed phase without an ion-pairing agent (which can sometimes compete with the target analyte for ionization in the ES MS source) was employed. Figure 1a shows a typical selected ion monitoring (SIM) LC/MS chromatogram of the yeast digest. A low v/v percentage of formic acid (0.02%) in the eluent was found to favor the separation of Met and SeMet,
(31) Casiot, C.; Szpunar, J.; Lobinski, R.; Potin-Gautier, M. J. Anal. At. Spectrom. 1999, 14, 645-650.
(32) Yan, J. http://www.geocities.com/junhuayan/pattern.htm, 2001. (33) Rosman, K. J. R.; Taylor, P. D. P. Pure Appl. Chem. 1998, 70, 217-235.
Table 2. Isotopic Distributions of Natural and Enriched Forms of Met and SeMet Used in Eq 1 for LC
Species-Specific Isotope Dilution MS
m/z natural abundance C5H12O2NS+ enriched 13CC 4H12O2NS+ (99.3%) 149 0.000 00 0.000 00 150 0.890 69 0.006 30 151 0.060 50 0.894 39 152 0.045 67 0.051 37 153 0.002 69 0.045 31 154 0.000 42 0.002 21 155 0.000 02 0.000 40 156 0.000 00 0.000 02 m/z natural abundance C5H12O2NSe+ enriched 13CC 4H12O2NSe+ (99.1%) 191 0.000 00 0.000 00 192 0.008 35 0.000 08 193 0.000 50 0.008 37 194 0.087 96 0.001 21 195 0.076 86 0.088 80 196 0.227 81 0.078 10 197 0.013 79 0.227 48 198 0.466 74 0.015 59 199 0.027 95 0.467 63 200 0.084 52 0.023 71 201 0.005 03 0.084 46 202 0.000 46 0.004 13 203 0.000 02 0.000 42 204 0.000 00 0.000 02 Cx) Cyvy mx Ay- ByRn BxRn- Ax AWx AWy (1)
Figure 1. (a) Reversed-phase SIM MS chromatogram of selenized yeast digest; (b) mass spectrum of natural abundance Met; (c) mass spectrum of natural abundance SeMet; (d) mass spectrum of Met in the selenized yeast digest with13C-enriched spike; (e) mass spectra
of SeMet in the selenized yeast digest with13C-enriched spike.
and baseline separation is achieved despite the similarity of the compounds. The insets show the mass spectra of Met (Figure 1b) and SeMet (Figure 1c), distinguished by the natural isotopic profiles of S and Se, respectively. The theoretical isotopic compositions of these species are given in Table 2. For standard additions, the molecular ions of protonated Met at m/z 150 and protonated SeMet at m/z 198 were monitored in SIM mode for integration. The results for the quantitation of Met and SeMet by pre- and postsample preparation standard additions are presented in Table 3.
Panels d and e of Figure 1 illustrate how the natural isotopic profiles of Met and SeMet are distorted due to the addition of 13C-enriched spikes. Reference and spike ions at m/z 150 and 151 for Met and m/z 198 and 199 for SeMet, respectively, were monitored in SIM mode for integration. Peak areas were used to calculate the reference-to-spike ion ratios of Met (m/z 150/151) and SeMet (m/z 198/199) for use in eq 1. Concentrations of 5521.7 ( 26.2 and 3395.0 ( 44.5 µg/g for Met and SeMet, respectively, were obtained.
Analysis of Yeast Digest by LC/ICPMS. LC coupled to ICPMS for the analysis of organoselenium compounds is a popular technique in bioinorganic speciation studies. The ICP source is not compatible with the high carbon content of organic solvents unless a stream of oxygen (necessary to oxidize the carbon) is introduced into the plasma with the sample. To eliminate the need for oxygen, reversed-phase chromatography is often used with a small volume of methanol and an ion-pairing agent,6-8,10or
ion-exchange chromatography with aqueous eluents is employed.12,24 In this study, anion-exchange chromatography with a gradient previously developed for the separation of water-soluble com-pounds from selenized yeast was used.34 Figure 2a shows the elution profile for several calibration standards to which that for the acid digest of the selenized yeast was compared. The major peak can be seen to agree with the retention time of SeMet (Figure 2b). A proportional increase in peak size due to addition of the internal standard of SeMet to the yeast sample is also shown in Figure 2b. The concentration of SeMet determined in the yeast by pre- and postsample preparation standard additions with LC/ICPMS is summarized in Table 3.
The same principles of ID based on eq 1 used for LC/MS apply to the analysis of the selenized yeast digest by LC/ICPMS, except that elemental isotopes replace the molecular ions monitored in LC/MS. In Figure 3, chromatograms a and b illustrate the elution profiles obtained for a natural abundance standard and a spiked yeast digest, respectively. In each chromatogram, the isotopes of selenium at 74, 78, and 82 are shown. The increase in the peak area of isotope 74 due to the addition of the74Se-enriched SeMet spike is clearly evident (Figure 3b). The extent of enhancement is confirmed by the theoretical distribution of isotopes calculated and displayed in insets A and B. The selenium isotopes at 74, 77, 78, and 82 were monitored and used to calculate the 77/74, 78/74, and 82/74 isotope ratios necessary for the quantification of SeMet. The concentration of SeMet determined by ID LC/ICPMS in the yeast using the 82/74 reference-to-spike isotope ratio, was 3449.8 ( 22.3 µg/g.
Evaluation of SeMet and Met Quantification by LC Tech-niques. As noted earlier, several calibration strategies for
(34) McSheehy, S.; Szpunar, J.; Haldys, V.; Tortajada, J. J. Anal. At. Spectrom. 2002, 17, 507-514.
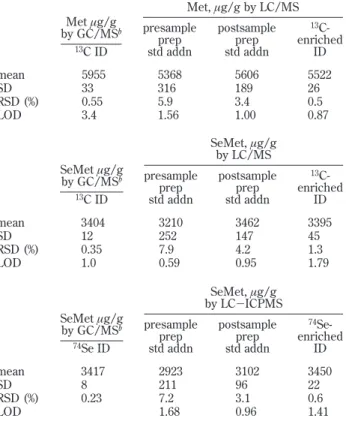
Table 3. Methionine and Selenomethionine Concentrations Determined in Selenium-Enriched Yeast Aa Met, µg/g by LC/MS Met µg/g by GC/MSb 13C ID presample prep std addn postsample prep std addn 13 C-enriched ID mean 5955 5368 5606 5522 SD 33 316 189 26 RSD (%) 0.55 5.9 3.4 0.5 LOD 3.4 1.56 1.00 0.87 SeMet, µg/g by LC/MS SeMet µg/g by GC/MSb 13C ID presample prep std addn postsample prep std addn 13 C-enriched ID mean 3404 3210 3462 3395 SD 12 252 147 45 RSD (%) 0.35 7.9 4.2 1.3 LOD 1.0 0.59 0.95 1.79 SeMet, µg/g by LC-ICPMS SeMet µg/g by GC/MSb 74Se ID presample prep std addn postsample prep std addn 74 Se-enriched ID mean 3417 2923 3102 3450 SD 8 211 96 22 RSD (%) 0.23 7.2 3.1 0.6 LOD 1.68 0.96 1.41
aLOD are listed for each technique and method of quantification
employed.bData from ref 18.
Figure 2. Anion-exchange ICPMS chromatograms of (a) Se standards. Peaks: 1, seleno-DL-cystine; 2, seleno-DL-methionine; 3, selenite; 4, selenate; 5, selenoadenosylhomocysteine, (b) Selenized yeast digest on AE ICPMS with the internal standard addition of SeMet on two levels (the chromatograms are shifted on thexandy axis to improve clarity). Peaks: A, yeast digest; B, yeast digest + 7.5 µg/g SeMet; C, yeast digest + 15 µg/g SeMet.
quantification of bioinorganic species exist. In this study, six methods of quantifying SeMet, of which three were also used for quantifying Met in the acid hydrolysis digests, were compared (cf. Table 3). External calibration was not considered an appropri-ate technique for use in this study, as it does not compensappropri-ate for interferences ascribed to matrix effects. There is generally good agreement between the sets of results, with the major discrepancy being a low result obtained for SeMet based on standard additions with LC/ICPMS (an average of 13% lower for standard addition) compared to the ID LC/ICPMS technique. The ID analyses show a great improvement in precision (expressed as relative standard deviation, RSD) over the standard additions technique and are more fit for the accurate and precise measurements needed for these analytes. Species-specific isotope dilution also provides a quantitation technique that accounts for matrix effects.
The SeMet ID data obtained in this study are in good agreement with reference data generated by ID using 74 Se-enriched and13C-enriched spikes combined with GC/MS18(Table. 3). However, the Met data obtained by LC techniques in this study are, on average, ∼8% lower than the data obtained by the GC/MS reference method. This discrepancy could have arisen due to the difference in mass bias obtained with the techniques GC/MS and LC/MS. It has been observed that the mass bias for LC/MS suffers greater variation from day to day and is less precise than the mass bias obtained for GC/MS. Since this set of results was obtained, efforts have been made, with success to improve the mass bias of the LC/MS technique for the certification campaign, by manipulation of the ES MS parameters.
The LODs for ID LC/MS and ID LC/ICPMS methodologies are based on three standard deviations of the average response from spiked blank samples (n ) 3) with concentrations normal-ized to 0.25 g of yeast test sample and are comparable to the ID
GC/MS reference method. The LODs for LC/MS and LC/ICPMS methodologies were based on three standard deviations of the average response from blanks (n ) 3) with concentrations normalized to 0.25 g of yeast test sample and are also found to have values comparable to those obtained by other calibration methods.
CONCLUSIONS
Two analytical techniques, LC/MS and LC/ICPMS, were developed based on species-specific isotope dilution for the determination of Met and SeMet in selenized yeast. Results obtained are in good agreement with a GC/MS reference method developed in-house and will likely prove to provide satisfactory parallel techniques for the certification of this candidate yeast CRM. LC provides a relatively straightforward alternative tech-nique for quantitation of Met and SeMet wherein no derivatization procedures are required as in GC. However, the sample analysis time for LC is considerably greater compared to GC.
Mean values of the set of results for Met and SeMet give a Met-to-SeMet ratio of 1.68:1. This information is useful for subsequent investigations into the mechanism of incorporation of Se into yeast and for supplementary data characterizing the proposed reference material.
ACKNOWLEDGMENT
The authors are grateful to Institut Rosell-Lallemend for providing the sample of Se-enriched yeast. S.M. thanks NSERC for financial support.
Received for review September 15, 2004. Accepted October 15, 2004.
AC048637E
Figure 3. AE ICPMS chromatograms of (a) natural abundance standard and (b) selenized yeast digest spiked with74Se-enriched SeMet.
Insets A and B show the respective theoretical distributions of Se isotopes.