Publisher’s version / Version de l'éditeur:
Journal of Testing and Evaluation, 26, November 6, pp. 575-581, 1998-11-01
READ THESE TERMS AND CONDITIONS CAREFULLY BEFORE USING THIS WEBSITE. https://nrc-publications.canada.ca/eng/copyright
Vous avez des questions? Nous pouvons vous aider. Pour communiquer directement avec un auteur, consultez la
première page de la revue dans laquelle son article a été publié afin de trouver ses coordonnées. Si vous n’arrivez pas à les repérer, communiquez avec nous à PublicationsArchive-ArchivesPublications@nrc-cnrc.gc.ca.
Questions? Contact the NRC Publications Archive team at
PublicationsArchive-ArchivesPublications@nrc-cnrc.gc.ca. If you wish to email the authors directly, please see the first page of the publication for their contact information.
NRC Publications Archive
Archives des publications du CNRC
This publication could be one of several versions: author’s original, accepted manuscript or the publisher’s version. / La version de cette publication peut être l’une des suivantes : la version prépublication de l’auteur, la version acceptée du manuscrit ou la version de l’éditeur.
For the publisher’s version, please access the DOI link below./ Pour consulter la version de l’éditeur, utilisez le lien DOI ci-dessous.
https://doi.org/10.1520/JTE12115J
Access and use of this website and the material on it are subject to the Terms and Conditions set forth at
Alternative procedure for the analysis of data from the cup method
measurements for determination of water vapour transmission
properties
Kumaran, M. K.
https://publications-cnrc.canada.ca/fra/droits
L’accès à ce site Web et l’utilisation de son contenu sont assujettis aux conditions présentées dans le site LISEZ CES CONDITIONS ATTENTIVEMENT AVANT D’UTILISER CE SITE WEB.
NRC Publications Record / Notice d'Archives des publications de CNRC:
https://nrc-publications.canada.ca/eng/view/object/?id=efaed3c0-9f41-4f8e-a833-d8cddc7c10f9
https://publications-cnrc.canada.ca/fra/voir/objet/?id=efaed3c0-9f41-4f8e-a833-d8cddc7c10f9
http://www.nrc-cnrc.gc.ca/irc
Alt e rna t ive proc e dure for t he a na lysis of da t a from t he c up m e t hod
m e a sure m e nt s for de t e rm ina t ion of w a t e r va pour t ra nsm ission
prope rt ie s
N R C C - 3 8 5 5 6
K u m a r a n , M . K .
N o v e m b e r 1 9 9 8
A version of this document is published in / Une version de ce document se trouve dans:
Journal of Testing and Evaluation, 26, (6), November, pp. 575-581, November
01, 1998, DOI:
10.1520/JTE12115J
The material in this document is covered by the provisions of the Copyright Act, by Canadian laws, policies, regulations and international agreements. Such provisions serve to identify the information source and, in specific instances, to prohibit reproduction of materials without written permission. For more information visit http://laws.justice.gc.ca/en/showtdm/cs/C-42
Les renseignements dans ce document sont protégés par la Loi sur le droit d'auteur, par les lois, les politiques et les règlements du Canada et des accords internationaux. Ces dispositions permettent d'identifier la source de l'information et, dans certains cas, d'interdire la copie de documents sans permission écrite. Pour obtenir de plus amples renseignements : http://lois.justice.gc.ca/fr/showtdm/cs/C-42
;tic EtnissiOll l!uQlion, JUly oustie Emis_ lonitoring of les," EXperi. Gセ」エゥッョ Tech. IMechanics, tic Etnission fig Fracture
Mavinkal
K,Kumaran
IAn Alternative Procedure for the Analysis of Data from the Cup
Method Measurements for Determination of Water Vapor
Transmission Properties
," Materials ousticEmis. in7075 Alu-4, 1988, pp, oustic Emis. ." Materials 185, . "Acoustic Ig Fracture 'igueof Alu-onof Source 4,1990, pp,Ireand Heat \Iuminum," [flition,Vol. "cof Acous· 7075-T651 /01. 20, No. Ie Emission 'ommunica· ticEmission inurn Alloys mer, NASA IAluminum '275-2282.
REFERENCE: Kumaran, M. K., "An Alternative Procedure for the Analysis of Data from the Cup Method Measurements for Determination of Water Vapor Transmission Properties," Journal of Testing and Evaluarion,JTEVA, Vol. 26, No.6, November 1998, pp.575-581.
ABSTRACT: The cup methods are used extensively to determine the water vapor transpOlt characteristics of building materials. The dry cup method and the wet cup method prescribe two standardized procedures for this purpose. The dry cup method gives the results as an average value of the property at a mean relative humidity of 25% and the wet cup at 75%. This information is inadequate for detailed hygrothennal analysis of building components. The complete dependence of water vapor permeability on relative humidity is required by most of the current computer models used for hygrothermal analysis. This paper presents an extension of the cup methods in which a series of dry cup and another series of wet cup measurements are suggested at varying relative-humidity levels outside the cup. Also, a detailed procedure for the data analyses to define the dependence of vapor permeability on relative humidity is presented. The methodology is applied successfully to three materials: perlite insulation board, calcium silicate insulation board, and plywood sheathing.
KEYWORDS: water vapor transmission, permeance, permeability, relative humidity, dry cup, wet cup, hygroscopic
The dry and wet cup methods are used extensively to determine the water vapor transmission properties of building materials
[1-5J.ASTM Standard Test Methods for Water Vapor Transmis-sion of Malerials (E 96) [6] prescribes the test procedure for these
methods in which the specimen is sealed to the mouth of an impermeable test dish containing waterora desiccant and placed inacontrolled atmosphere. Periodic weighing of the test assembly determines when a steady rate of weight loss orgain is attained,
and this final rate, continued long enough to ensure its validity, is the primary test result. The rate together with the measured
lemperature and relative humidity (RH) of the controlled
atmo-sphere and the area of the specimen is used to calculate the water vapor penneance of the specimen. According to existing ASTM StandardE 96, the dry cup test results give the vapor permeance at
an
average RH of 25% and the wet cup at 75%. The former is an average value between 0 and 50% and the latter between 50 and100%.These average values will adequately represent a building セ。ョセウ」イゥーエ received 07/31197; accepted for publication 05/22/98.
R Semor research officer, Building Envelope and Structure, Institute for Oesearch in Construction, National Research Council of Canada, Ottawa,
ntano, KIA OR6, Canada.
@)1998 by the American Society for Testing and Materials
575
material from a material standard and quality control point of view. However, the information contained in such average values is inad-equate from an analytical point of view. This is especially true
in the case of hygroscopic building products. Also, all advanced
computer models
[7J
for hygrothermal analyses need detailed input on the dependence of the water vapor transmission characteristics on the local relative humidity of all materials in a given building component. This paper revisits an experimental procedurepro-posed by Bazant and Najjar [8-10] and presents a method to
ana-lyze the data to satisfactorily determine the dependence of water vapor transmission properties on relative humidity.
Experimental Procedure
The experimental procedure is a logical extension of the existing
procedure prescribed in ASTM E 96. Currently, the dry and wet
cups assembled for the measurements are kept in an atmosphere maintained at 23°C and 50% RH In the proposed extension one shall conduct two series of measurements. The first is a series of dry cup measurements and the second a series of wet cup measure-ments carried out as follows.
Many specimens are cut from a boardorsheet of the building material being investigated. The physical characteristics of each specimen, such as its average thickness and bulk density, are、・エ・イセ
mined. This gives an indication of the variability of the material.
For most contemporary products investigated at the Institute for Research in Construction, the variability in the thickness is often within 1to 2% of the mean thickness. But, depending on the
prod-uCI, the variation in the bulk density may be up to 10% of the
mean value.
Two sets of specimens (minimum of three each) are randomly picked from the lot of specimens cut from the material. One set is used to make the dry cup assemblies according to ASTME 96
and the other to make the wet cup assemblies. Care should be taken to maintain the thickness of the still air layer the same in all assemblies. Otherwise the corrections towards the resistances offered by the air layer complicate the data analysis.Allassemblies are then placed in a chamber[5]maintained at23°C and initially at approximately 30% RH. The assemblies are periodically weighed, as usual for theE 96 procedure, to confirm the steady state, and then the steady rate of mass change is recorded.
The above procedure is repeated for successively increasing lev-els ofRH(at an increment of 10 to 15%) in the chamber. The dry cup measurements need not be done for RH above 70%, except
'576
JOURNAL OF TESTING AND EVALUATION,
• DRV CLP MEASUREMENTS .WET CUP MEASlREMENTS
FIG. I-Expected experimental results for a nonhygroscopic material.
for strongly hygroscopic materials. But the wet cup measurements should be continued to RH levels as close to 100% as practically possible. Usually this is about 95 to 97%. The two same sets of specimens may be used in the whole series of measurements.aャエ・イセ
natively, new sets of specimens may be used for every new RH level. If the same specimens are being used repeatedly,itis。、カゥウセ
able to reassemble the cup after the measurements at each RH
level. In the case of highly vapor-permeable specimens, this is
::specially important. If they are not reassembled, the desiccant nay become too wetin the dry cup assemblies or the water level
TIay change significantly in the wet cupassemblies. This should Je prevented.
If the material under investigation is strongly hygroscopic, the try cup measurements are continued to as high a chamber RH as Jractically possible. Then at the highest RH one set of wet cup neasurements is conducted. As explained below, in this case the 1rocedure for the data analysis will be slightly different.
TABLE 32.8 32.8 32.8 47 47 47 73.7 73.7 73.7 32.6 32.6 32.6 55.8 55.8 55.8 74.7 74.7 74.7 82.1 82.} 82.1 93.5 93.5 93.5 struction. Table 1al The wa (atotalof material) : Least-sl smoothed perlite ins be conclu is indepel permeabil kg m-I , insulation ble those For the that the \ 50%. Fro 0.1) X II Thewate, RH, as 01 in Table The dr' scopic m: ondataal Anaver;.\ RH. This Theorelil TABLE 2-Chamber RJ %
--
PerliteゥョウセゥiNL Calcium5111\ PlywoodSIll'-The penneance so calculated should be correcled[5,11] for the surface resistances and the resistance offered by the still air inside the cups, common to all measurements. (This is why it is necessary to keep the thickness of the still air the same in all assemblies.) The corrected permeance multiplied by the average thickness of the material gives the permeability of the material at any given RH. Obviously, if a material behaves as shown in Fig. 1, there will be a unique value for the permeability of that material at 23°C.
Magnitude of derivative X 100
Permeance
=
⦅MG]\・ZZZZZZZZNMZZNZ」ZZZZセセセNNNZNZMセセセsaturation water vapor pressure at 23°C For a hygroscopic material, the results from the wet cup ュ・。セ
surements will be invariably nonlinear. Also, the intersection of the two plots will be at an RH
>
50%. This situation is illustrated in Fig. 2.If the material is strongly hygroscopic the plois ohtained from both series of measurements will be curved, and the point ofゥョエ・イセ
section will be moved toward 100% RH. A proper definition of these curves demands measurements of both series up to the highest possible RH leveL However, as stated earlier, a more practical approach is to conduct only the dry cup series in full and thenone
set of wet cup measurements at the highest chamber RH. The sum of the water vapor transmission rates from both sets of measure-ments at the highest RH will theoretically be equal 10that for a dry cup measurement done at a chamber RH equal toQPPEセ Hence, this sum of the data combined with the data from the series of dry cup measurements will define the dependence of the water vapor transmission rate for the full range of RH.
Even for extremely accurate measurements, due to the inhomo-geneity inherent to all building products, the plots will not be as smooth as shown in Figs. I and 2. The data should therefore be smoothed by curve fitting. The algebraic expression so obtained can be used to determine the derivative of the plot at any given RH. Then the permeance of the test assembly at that RH is given by:
a
m
セ セ セ 100CHAMBER rh, %
• DRV CLF MEASUREMENTS • WET CLF MEASu:lEMENTS
FIG.2-Expected experimental results for a hygroscopic material.
Experimental Dataon Three Materials
The procedure described above has been successfully applied to many building materials at the Institute for Research in cッョセ
100 80 40 60 CHAMBER rh, % 20
o
>rocedure for Data Analysis
The first step in the analysis is to confirm that each set of mea-urements was taken at a true steady state. This can be achieved >y doing a linear least-squares analysis of the data on time versus l1ass change. The linear regression coefficient shall not be less han 0.998. From the slope one can determine the water vapor ransmission rate for the corresponding test specimen at the」ッイイ・セ
ponding RH level in the chamber. The area of the specimen shall 'e determined as prescribed in the ASTM standard. At times it :1ay not be possible to maintain the temperature exactly equal to 3°e. If the variation is within I K, the measured value for the
latervapor transmission rate shall be corrected to correspond to 3°e by assuming that the temperature dependence of the rate is Jentical to that for still air of the same thickness. This correction fill he less than 1%(see Appendix).
Next, the water vapor transmission rate is plotted against the hamber RH. This will result in two separate but intersecting plots. 'he shape of the plots and the location of the point of intersection lill depend on the nature of the material. If the material is nonhy-roscopic, the two plots will be linear and will intersect at 50%
セhN Furthermore, the magnitude of the slopes will be identical. 'his means that the water vapor transmission characteristic of the laterial does not depend on the local RH. This situation is illus-ated in Fig. I.
KUMARAN ON WATER VAPOR TRANSMISSION PROPERTIES 577
TABLE 1-Three building materials investigated in this work.
Material Perlite insulation board Calcium silicate insulation board Plywood sheathing Dry Density, kg·m -3 245 ± 6 228 ± 2 430 ± 20 Specimen Thickness, mm 20.0 ± 0.1 19.6 ± 0.1 12.3 ± 0.1
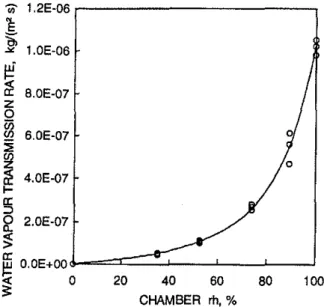
were able to doitat a chamber RH equal to 100%. It is the sum of one measurement from 0 to 89.6% and another measurement from 89.6to 100%,the sum being equivalent to one measurement from 0 to 100%.
A least-squares analysis of the results gives the smooth curve shown in Fig.5. That smooth curve gives the water vapor perme-abilities listed in Table 6.
TABLE 2-Water vapor transmission data for perlite insulation board.
struction. As a demonstration, results on three materials listed in Table 1 are presented here.
Thewater vapor transmission rates measured on the specimens (a total of six specimens were used in the measurements on each material) are listed in Tables 2 to 4.
l・。ウエセウアオ。イ・ウ analyses of the data in Tables 2 and 3 result in a smoothed set of data as shown in Figs. 3 and 4. The data on the perlite insulation board follow the pattern in Fig. 1.Hence it can be concluded that the water vapor permeability of the material is independent of RH. After all the corrections, the water vapor permeahility of the material tesled here is (3.3 ± 0.1) X 10-11 kg m-I S-I Pa-J
, The wet cup results on the calcium silicate
insulation board, however, show nonlinearity, and the plotsイ・ウ・ュセ
ble those in Fig. 2.
For the calcium silicate insulation board, it can be concluded that the water vapor permeability is constant at least up to RH 50%. From the linear portion of the plot this is equal to (3.6 ±
0.1) X 1O-11kg m-I
S-IPa-I.Ahove that it depends on the RH.
The water vapor permeability of this material as a function of the RH, as obtained from the analysis of the wet cup results, is listed in Table 5.
The dry cup results on the plywood sheathing, a strongly hygro-scopic material, are plotted in Fig. 5. As mentioned in the section on data analysis, the values at 100% RH are calculated as follows. An average value was calculated for the dry cup results at 89.6% RH. This average value was added to each of the wet cup results. Theoretically this sum corresponds to the dry cup results if one
TABLE 4-Water vapor transmission data plywood sheathing.
>I<Sum of the mean dry cup results and individual wet cup results at RH
= 89.6% . 3.22E-06 3.22E-06 3,30E-06 2.38E-06 2.36E-06 2,37E-06 1.45E-D6 1.49E-06 1.65E-06 I.l9E-06 I.l9E-06 t.25E-06 5.I8E-07 4.96E-07 5.50E-07 4,34E-07 5.04E-07 4.75E-07
Wet Cup Results,
kgm-2 S-I
WetCup Results,
kg m-2 S-l 1.23E-06 1.22E-06 1.21E-06 2.00E-06 1.99E-06 2.08E-06 2.95E-06 2.86E-06 2.88E-06 5A8E-08 4.37E-08 4.82E-08 1.13E-07 1.07E-07 1.0IE-07 2.82E-07 2.56E-07 2.70E-07 6.13E-07 5.60E-07 4.69E-07 9.82E-07' 1.05E-06' 1.02E-06'
Dry Cup Results,
kgm-2 S-l
Dry Cup Results, kg m-2 S-l
Chamber RH, %
TABLE 3-Water vapor transmission data for calcium silicate insulation board.
Conclusions
The experimental data presented here show conclusively that the procedure suggested by Bazant and Najjar can be combined with existing ASTM Standard E 96 to determine the dependency of the water vapor permeabilities of building materials in a satisfac-tory way. The technique classifies building materials generally into
32.8 32.8 32.8 47 47 47 73.7 73.7 73.7 32.6 32.6 32.6 55.8 55.8 55.8 74.7 74.7 74.7 82.1 82.1 82.1 93.5 93.5 93.5 Chamber RH, % 35 35 35 52.3 52.3 52.3 73.9 73.9 73.9 89.6 89.6 89.6 100 100 100 2.59E-06 2.60E-06 2.72E-06 1.94E-06 1.84E-06 1.87E-06 9.37E-07 1.00E-06 1.08E-06 7.65E-07 7.01E-07 6.89E-07 2.94E-07 1.63E-07 2.00E-07
Wet Cup Results,
kgm-2 S-l 1.19E-06 1.18E-06 1. 17E-06 1.99E-06 1.94E-06 1.87E-06 2.62E-06 2.56E-06 2.65E-06
Dry Cup Results,
kgm-2S-l 32.8 32.8 32.8 47 47 47 73.7 73.7 73.7 32.6 32.6 32.6 55.8 55.8 55.8 74.7 74.7 74.7 82.1 82.1 82.1 93.5 93.5 93.5 Chamber RH, %
.,---578 JOURNAL OF TESTING AND EVALUATION 4.0E-06
r - - - ,
111 v; Cjl kr til tlll 111; m: 1111 thi bir stc L I ox' 011 1'1 rc USI COt aSl FOi wilt '1 deri the moL appr Coef (1) 100 o 80 S.IE-I3 6.6E-13 8.8E-I3 I.2E-12 l.7E·I2 2.6E·12 4.2E·I2 7.5E-I2 I.5E-II 4.lE-IIWater Vapor Permeability,
kgm-I S-l Pa-1 20 LOE-06 6.0E-07 2.0E·07 4.0E·07 O.OE+OOセ]]]ZZZZZZセjMMMNNNNlNN
__
'___.J
o
10 20 30 40 50 60 70 80 90 100 Ul 1.2E-06r---,
セ
40 60 CHAMBER rh,%FIG.5-Experimenral data on plywood sheathing.
Relative Humidity, %
APPENDIX
The Water Vapor Permeability of Stagnant Air:
A Brief Literature Review
TABLE 6-Water vapor permeability for plywood sheathing.
Acknowledgment
Technical assistance for this work from Mr. John Lackey and Mr. Roger Marcband is gratefully acknowledged.
Introduction
Building physicists use a property called "vapor resistanceヲ。」セ
tor," /L(dimensionless), to analyze the hygrothermal behavior of building materials and components. This property of any building material is defined as
where
Sa
and 0 are, respectively, the water vapor permeabilities of stagnant air and of the building material under consideration at identical temperature and pressure. The water vapor permeabilities of common building materials are measured reliably using the cup100 100 80 80
8
a
3.6E·II 3.8E-II 4.2E·II 4.8E·II 5.6E-II 6.7E·II§
Water Vapor Permeability, kgm-I s-JPa-1
•
40 60 CHAMBER rh,%•
40 60 CH6..MBER rh.% 20 20 .. 3.0E-06 , - - - ,セ
セ
2.0E-06z
o
Bl
!1.0E-06g;
:r
セ O.OE+OOBGM⦅NNNNlN⦅セGM⦅NNlNN _ _ '_ _セffi
0!<
:;:
..
'E
'i;;'"
• 3.0E-06セ
z Q 2.0E-06gJ
:E
セ
1.0E·06g;
セ
O.OE+oo "'-_-'-_--'-_ _'--_...L..._-lI>
0ffi
!<
:;:
50 60 70 80 90 100 OORYCLflRESU.TS eWETClJ'>RESll.TSFIG.4-Experimenral data on the calcium silicate insulation board.
Relative Humidity, %
oDRY CUP RESU.TS • WET CUP RESl.\.TS
FIG. 3-Experimental data on the perlite insulation board.
TABLE5-Water vapor permeability for calcium silicate insulation board.
three groups with respect to the dependence of their permeability on RH. For materials such as the perlite insulation board, the per-meability may be regarded as independent of RH. For another group, such as the calcium silicate insulation board presented here, the permeability gradually increases with RH above 50%. For a third group, such as plywood, the permeability is a strong function of the RH. For such materials, it is advisable to carry out more measurements for the chamber RH between 85 and 97%. Otherwise the dependence of the permeability or RH may be ill-defined.
KUMARAN ON WATER VAPOR TRANSMISSION PROPERTIES b/i,J
method [I]. This method has been standardized for practical appli-cations [6, /3]. Due to various experimental difficulties, the water vapor permeability of stagnant air is not easily measurable. This quantity, as a function of temperature, T, is calculated from a knowledge of the binary diffusion coefficient, Dmv(T), of air
+
water mixture as follows
DmAy)
R"T
(2)
f
D = a constant, 1 to 1.02 ifrnA and rnn are of same order, and(JAB = arithmetic mean of collision diameters of A and B (e.g., from Lennard-Jones potential).
The quantity
n
Din Eq4 is called a diffusion collision integral forwhich various analytical approximations are found in the literature [15]. The accurate relation of Nufeld et al. [16] is
where Rvis the ideal gas constant for the unit mass of water vapor.
The quantity Daw(T) is not well understood. This Appendix reviews the literature to determine its relative significance.
The Theoretical Approach
The partial pressure of water vapor in building physics 。ーーャゥ」。セ
tions is usually less than 3000 Pa. This is considerably less than the standard atmospheric pressure, namely, 101 325 Pa. Hence one
maydescribe the diffusion process to be the diffusion of a "trace material" (water molecules) into a homogeneous medium (a binary mixture of nitrogen and oxygen) of fixed composition. Based on this assumption, theoretical methods can be used to calculate the binary diffusion coefficient for water in air through the following steps:
• Calculate the binary diffusion coefficient of water into oxygen.
• Calculate the binary diffusion coefficient of water into nitrogen.
• Calculate the binary diffusion coefficient of water into air by using a combining rule.
Kinetic theory of gases and statistical mechanics provides the complex theoretical background for the first two steps. However, a simple law called Blanc's law[14J,provides the combining rule. For the present application, this law can be written as
(3) where
Xl = mole fraction of nitrogen in air,
X2 = mole fraction of oxygen in air,
D1w
=
binary diffusion coefficient of nitrogen+
water, and D2w = binary diffusion coefficient of oxygen+
water.A C E G
- - +
+
+
(5)(T*)" exp(DT*) exp(FT*) exp(HT*)
where
T*
=
reduced temperature, kT/EAS, EAS being geometric mean of characteristic energies ofA and B (e.g., again from Lennard-Jones potential), A=
1.06036, B = 0.15610, C=
0.19300, D=
0.47635, E=
1.03587, F=
1.52996, G = 1.76474,and H=
3.89411.According to this theoretical approach, we get the results shown in Table 7.
The vapor permeability values are quoted to two decimal places to show the theoretical dependence of
Sa
onT.The absolute value cannot be that accurate due to the various approximations in the derivation of Eq3.
However, the order of magnitude is clearly established to be 10-10• Now let us examine some experimentalresults.
Experimental Results
Marrero and Mason[17]have extensively reviewed the literature on gaseous diffusion coefficients up to 1970.It is seen that many researchers, from as early as 1882, have attempted to detennine the binary diffusion coefficient for water
+
air mixture[17]. The agreement between various results, however, is not better than ± 10%. Within this uncertainty, Marrero and Mason gave the fol-lowing equation for the binary diffusion coefficient of water+
air at atmospheric pressure and between 282 and 450 K:(4)
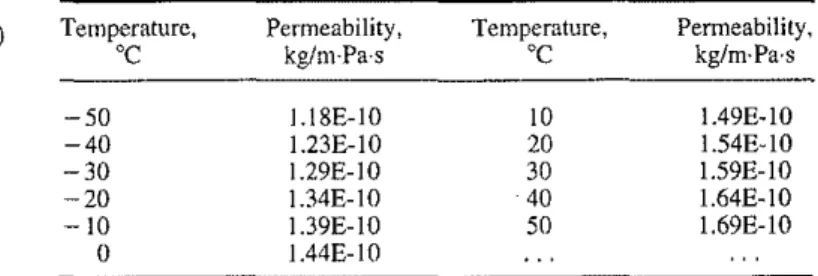
TABLE7-The water vapor permeability of stagnant air accordingto Chapman and Enskog, at various temperatures and 101325Pa
pressure.
Dow, (m2/s)
=
1.87 X lO-lOT2on The working equation for the first two steps listed above wasderived independently by Chapman and Enskog [15] by solving the Boltzmann equation.If we consider two gases, A and B, with molecular massesrnAandrna,the approximate equation (first-order approximation of the diffusion process) for their binary diffusion coefficient, DABis as follows [16]:
3 (4TrkTlm )"2
D - セ AIJ
f
AB - ]6 ョQャGHjセbョd f) where
mAB
=
reduced mass, 2[(l/mA)+
(l/mB)]-1,n = number density of molecules in mixture, k = Boltzmann constant, T = thermodynamic temperature, Temperature, "C -50 -40 -30 -20 -10
o
Permeability, kg/m·Pa·s I.I8E-1O 1.23E-1O 1.29E-1O 1.34E-1O 1.39E-1O 1.44E-IO Temperature, "C 10 20 30 40 50(6)
Permeability, kg/m·Pa·s 1.49E-1O 1.54E-1O 1.59E-1O 1.64E-1O I.69E-1O580 JOURNAL OF TESTING AND EVALUATION
ever, it is quite clear that its order is 10-10
, kg/m·Pa·s. Also, at
20'C,8aセ 2 X 10⁻¹⁰kg/m·Pa·s. That is all that is presently known
to us. Then, to continue to use the quantity called' 'vapor resistance factor," building physicists should consistently use one of the empirical correlations cited in this review. Many of the European standards[I3l are currently using Schirmer's equation [19] for this purpose. The equation, which includes a correction for the pressure dependence as well, is
TABLE 8-The water vapor permeability of stagnant air according to Marrero and Mason, at various temperatures alld 101 325-Pa pressure.
Temperature, Permeability, Temperature, Permeability,
'c
kg/m·Pa·s'c
kg/m,Pa-s - 50 1.33E-1O 10 I.72E-1O --40 1AOE-IO 20 1.79E-IO -30 1.46E-IO 30 1.85E-1O -20 1.53E-1O 40 I.92E-1O -10 1.59E-1O 50 1.99E-1O 0 1.66E-1O 8=
2.306 X 10⁻⁵ (
Po _T_)1.81
o R"TP 273.15 (7) [/21 II.! 1 [/.JI where The water vapor permeabilities that correspond to Eq 6 are listedin Table 8.
It can be seen that the experimental results are consistently higher than those derived from theory. This is not unexpected because of various approximations made in the theoretical approach. Also, the temperature dependence shown by the two sets is slightly different. Marrero and Mason [17] have also given equations for the binary diffusion coefficients of water
+
oxygen and water+
nitrogen based on experimental results in the litera-ture. These coefficients in combination with Eq 3 also result in the permeabilities repOlted above.Various other empirical correlations have also been suggested by different authors. These correlations are reviewed in the following section.
T
=
temperature (K),P = ambient pressure (Pa),
Po = standard atmospheric pressure, Le., 101 325 Pa, and Rv = ideal gas constant for water, i.e., 461.5 J.K-1·kg-1•
Water vapor permeabilities of materials are usually determined at standard laboratory conditions. For practical applications the temperature dependence should be considered. In the physical environments in which buildings generally operate, a temperature range of - 50 to
+
50°C may be seen by building materials in various parts of the building envelope. It may be assumed that the temperature dependence of the permeabilityinany medium is the same as that for air and necessary corrections be made for that dependence. Then Eq 7is very useful.References
[1] Joy,F.A.and Wilson, A. G., "Standardization of the Dish Method
forMeasuringWaterVaporTransmission," Proceedings ofthe Inter-national Symposium on Humidity and Moisture, Washington, DC, Vol. 4. Chapter 31, 1963, pp. 259-270.
[21 Tveit, A., "MeasurementsofMoistureSorption andMoisture
Perme-ability of Porous Materials," Rapport 45, Norwegian Building
Research Institute, UDC 532.685, 1966.
[3] McLean, R. C., Galbraith, G. H., and Sanders, C, H., "Moisture Transmission Testing of Building Materials and Presentation of Vapor Permeability Values," Building Research and Practice. The Journal of ClE, No.2, 1990, pp. 82-91.
[4] Burch, D. M., Thomas, W. C., and Fanney, A. H., "Water Vapor Permeability Measurements of Common Building Materials," ASH-RAE Transactions, 1992, Vol. 98,Pt.2.
[5) Lackey,1.
c.,
Marchand, R. G., and Kumaran, M. K., "A Logical Extension of the ASTM Standard E 96 to Determine the Dependence of Water Vapor Transmission on Relative Humidity," Insulation Materials: Testing alldApp!ications: Third Volume, ASTM STP 1320,R. S. Graves and R.R.Zarr, Eds. American Society for Testing and Materials, West Conshohocken, PA, 1997, pp. 456-470.
[6] ASTM E 96, Standard Test Methods for Water Vapor Transmission of Materials, 1996.
(7) Hens. H" "Heat, Air and Moisture Transport, Final Report. Vol. 1, Task I: Modelling, International Energy Agency Annex 24, Labora-torium Bouwfysica, K. U.¥Leuven, Belgium, 1996.
[8] Bazant, Z. P. and Najjar, L.1.,"Nonlinear Water Diffusion in Nonsat-urated Concrete," Materials and Construction,Vol. 5, No. 25, 1972,
pp. 3-20.
[9] Nilsson, L.-O., "Hygroscopic Moisture in Concrete-Drying, Mea-surements & Related Material Properties," Report TVBM-1003, Division of Building Materials, Lund Institute of Technology,
Swe-den, 1980, pp. 44-46.
[10] Hedenblad, G., "Moisture Permeability of Some Porous Building
Materials," Proceedings of the 4th Symposium, Building Physics in the Nordic Countries, Espoo, Finland, Vol. 2, 1996, pp. 747-754.
[11] Hansen,K. K.and Lund,H.B., "Cup Method for Determination of Water Vapor Transmission Properties of Building Materials. Sources
Concluding Remarks
Empirical Correlations
Schirmer, Krischer, DeVries, and Vos have independently sug-gested equations[18]for the temperature dependence of the binary diffusion coefficient of water
+
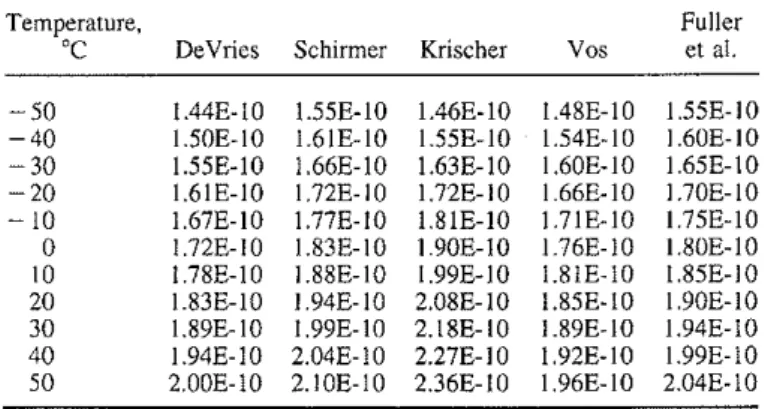
air mixture. The water vapor per-meabilities from these equations are calculated and listed in Table9. Also included is a setofvalues based on atomic diffusion vol-umes according to Fuller et a1. [15]. Once again, the theoretical values are consistently lower than those from the empirical correla-tions. However, except for those according to Krischer, the temper-ature dependence in all sets of results are almost the same,
The review presented here suggests that the water vapor perme-ability of stagnant air has not yet been precisely determined,
How-TABLE9-Water vapor permeability, kg/mPa's, according to various empirical correlations.
Temperature, Fuller
'C DeVries Schirmer Krischer Vos et a1.
-50 I.44E-1O 1.55E-1O 1.46E-1O 1.48E-1O 1.55E-IO -40 1.50E-IO 1.6IE-IO 1.55E-1O 1.54E-1O 1.60E-1O -30 I.55E-JO I.66E-1O 1.63E-1O I.60E-1O 1.65E-JO -20 I.6IE-1O I.72E-1O I.72E-1O 1.66E-1O 1.70E-JO
-10 1.67E-1O I.77E-1O 1.81E-1O I.7IE-1O 1.75E-1O 0 I.72E-JO 1.83E-IO 1.90E-1O 1.76E-1O 1.80E-1O 10 I.78E-JO 1.88E-1O I.99E-1O I.81E-1O 1.85E-IO 20 I.83E-1O 1.94E-1O 2.08E-1O I.85E-1O 1.90E-1O 30 I.89E-IO 1.99E-1O 2.18E-1O 1.89E-1O 1.94E-1O 40 1.94E-1O 2.04E-1O 2.27E-JO I.92E-1O 1.99E-JO 50 2.00E-1O 2.IOE-IO 2.36E-1O I.96E-1O 2.04E-1O
I
I
KUMARAN ON WATER VAPOR TRANSMISSION PROPERTIES 581 of Uncertainty in the Method," Proceedings of the 2nd Symposium,
Building Physics in the Nordic Countries, Trondheim, Norway, 1990, pp.291-298.
[12] Joy,F.A and Wilson, A.
a.,
"Standardization of the Dish Method for Measuring Water Vapor Transmission," Proceedings oftheInter-national Symposium on Humidity and Moisture, Washington, DC,
Vol. 4, Chapter 31, 1963, pp. 259-270.
[i3] CEN TC89 N336: Determination of Water Vapor Transmission Prop-erties, Draft, 1994.
[14] Blanc,A, Journal of Physics, Vol. 7, 1908, p. 825.
[is] Reid,R. C., Prausnitz,1. M., and Poling, B. E., The Properties of
Gases and Liquids, 4th ed., McGraw-Hili Book Company, New York,
Ch. 11, 1987, pp. 577-631.
[16] Nufeld,P. D., Janzen, A. R, and Aziz, R. A, Journal of Chemical
Physics, Vol. 57, 1972, p. 773.
[17J Marrero, T.R.and Mason, E. A., Journal of Physical and Chemical
Reference Data, Vol. 1, 1972, p. 3.
[18] Anderson, A, Swedish Council for Building Research Document, Vol. D6, No.9, 1985.