HAL Id: hal-02963814
https://hal.archives-ouvertes.fr/hal-02963814
Submitted on 15 Oct 2020
HAL is a multi-disciplinary open access
archive for the deposit and dissemination of
sci-entific research documents, whether they are
pub-lished or not. The documents may come from
teaching and research institutions in France or
abroad, or from public or private research centers.
L’archive ouverte pluridisciplinaire HAL, est
destinée au dépôt et à la diffusion de documents
scientifiques de niveau recherche, publiés ou non,
émanant des établissements d’enseignement et de
recherche français ou étrangers, des laboratoires
publics ou privés.
Segmentation of axillary and supraclavicular tumoral
lymph nodes in PET/CT: A hybrid
CNN/component-tree approach
Diana Lucia Farfan Cabrera, Nicolas Gogin, David Morland, Benoît Naegel,
Dimitri Papathanassiou, Nicolas Passat
To cite this version:
Diana Lucia Farfan Cabrera, Nicolas Gogin, David Morland, Benoît Naegel, Dimitri Papathanassiou,
et al.. Segmentation of axillary and supraclavicular tumoral lymph nodes in PET/CT: A hybrid
CNN/component-tree approach. International Conference on Pattern Recognition (ICPR), 2020,
Mi-lan (virtuel), Italy. pp.6672-6679, �10.1109/ICPR48806.2021.9412343�. �hal-02963814�
Segmentation of Axillary and Supraclavicular
Tumoral Lymph Nodes in PET/CT: A Hybrid
CNN/Component-Tree Approach
D. L. Farfan Cabrera
∗†, N. Gogin
†, D. Morland
∗‡, B. Naegel
§, D. Papathanassiou
∗‡, and N. Passat
∗∗ Universit´e de Reims Champagne Ardenne, CReSTIC, EA 3804, 51097 Reims, France †General Electric Healthcare, Buc, France
‡ D´epartement de M´edecine Nucl´eaire, Institut Godinot, Reims, France § Universit´e de Strasbourg, CNRS, ICube, Strasbourg, France
Abstract—The analysis of axillary and supraclavicular lymph nodes is a primary prognostic factor for the staging of breast cancer. However, due to the size of lymph nodes and the low resolution of PET data, their segmentation is challenging. We investigate the relevance of considering axillary and supraclavic-ular lymph node segmentation from PET/CT images by coupling Convolutional Neural Networks (CNNs) and Component-Trees (C-Trees). Building upon the U-Net architecture, we propose a framework that couples a multi-modal U-Net fed with PET and CT with a hierarchical model obtained from the PET that provides additional high-level region-based features as input channels. Our working hypotheses are twofold. First, we take advantage of both anatomical information from CT for detecting the nodes, and functional information from PET for detecting the pathological ones. Second, we consider region-based attributes extracted from C-Tree analysis of 3D PET/CT images to improve the CNN segmentation. We carried out experiments on a dataset of 240 pathological lymph nodes from 52 patients scans, and compared our outputs with human expert-defined ground-truth, leading to promising results.
Index Terms—Segmentation, CNN, U-Net, component-tree, region-based features, PET/CT, lymph nodes.
I. INTRODUCTION
A. Context
Breast cancer is one of the most common diseases in women and one of the principal causes of death in females. Approximately 1.38 million cases are detected worldwide per year and as a consequence cause 458 000 deaths. This type of cancer develops from breast tissue. Lymph nodes (LN) near these regions are among the first structures to be affected. This motivates the involvement of LN in the usual “TNM” protocol dedicated to the staging of breast cancer, that relies on three criteria: size of tumor (T); number of LN reached by cancer (N); and metastasis state (M). Besides, during an axillary dissection or sentinel node procedure for breast neoplasia, the explored anatomical territory extends behind the pectoral muscle, without exceeding it. Certain LN are not removed during a conventional axillary surgical exploration. If they are suspect in medical images, they deserve to be indicated so that the surgeon can adapt his/her gesture. This justifies the
The research leading to these results has been supported by the French Association Nationale Recherche Technologie(ANRT).
relevance of segmenting LN from medical images, namely Positron Emission Tomography (PET), often coupled with X-ray Computed Tomography (CT).
PET, generally coupled with CT, is widely used for imag-ing purpose in cancer, in particular in the case of breast cancer [1], [2]. Whereas PET provides information on the high metabolism of cancerous cells, CT provides anatomical information on the structures of interest, with a high spatial resolution. However, it was observed that PET/CT data present two limitations [3]. First, patients in early stages of cancer may exhibit a low amount of cancerous cells. PET/CT may not easily allow to detect these few cells. Second, during an acquisition in PET, if the patient is cold, the brown fat inside her body becomes hypermetabolic. Then, brown fat and cancer cells may fix the PET tracer the same way; this can lead to false positive segmentation errors.
Under these challenging hypotheses, the complementary information carried by the two modalities become crucial. In CT, it is possible to detect LN, but assessing their putative pathological nature is intractable. By contrast, in PET, it is possible to estimate in which regions of the body cancer cells are located, but we cannot easily determine in which organs, in absence of anatomical information. Thus PET/CT data together constitute an important source of information that may be involved in computer-aided diagnosis in the case of breast cancer. However, the intrinsic weaknesses of these data—low spatial resolution, low SNR, partial volume effects, presence of false positives—motivate the development of robust LN segmentation methods.
B. Related Work
The literature dedicated to LN segmentation is still limited. Previous works such as [4] propose LN cluster segmentation in the thoracoabdominal area of the body in 2D CT slices using firstly holistically-nested neural networks and then enhancing segmentation with structured optimization techniques. How-ever, there is no classification of benignant vs. malignant LN. In [5] a method is proposed for axillary LN segmentation in CT using a classification of solid vs. non-solid LN depending on their tissue homogeneousness, considering that enlarged
lymph nodes with a solid interior have a higher probability of being malignant. Other techniques such as [6] perform LN detection and segmentation in magnetic resonance images in the cervical area. These methods present promising LN segmentation results, mainly based on machine learning tech-niques using CT information. However, they do not consider PET metabolic signal inside the LN, which is an essential information to discriminate malignant tumors.
In this context, Deep Learning (DL) has emerged as a promising segmentation paradigm [7] that seems to outper-form other machine learning approaches for the task of LN segmentation. In particular, it was shown in [8] that Convo-lutional Neural Networks (CNNs) already used for PET/CT co-segmentation [9], is a potentially relevant paradigm.
A second, recent approach dedicated to PET/CT analysis consists of considering hierarchical image models, and es-pecially the component-tree (C-Tree) [10], in order to take advantage of the mixed spatial-spectral information carried by these data. Indeed, C-Trees are relevant for modeling and processing functional medical images, where the strength of the signal is correlated to the intensity of the observed physio-logical phenomenon. The first medical domain where C-Trees were involved was angiographic imaging, that emphasizes the flowing blood in vascular networks [11], [12]. Methods based on C-Tree modeling were further designed for PET or PET/CT classification purpose [13], [14] or filtering / segmentation issues [15], [16], [17], [18]. They rely on the hypothesis that hierarchical image models can be efficiently used for computing and storing high-level, region-based features [19] that are hardly obtained by other strategies.
C. Outline of the Method
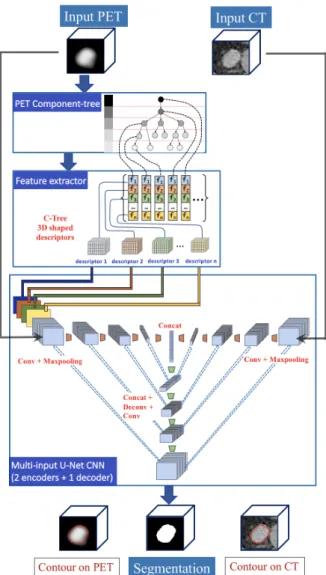
We propose a novel hybrid method that combines the two frameworks of C-Tree and CNN for LN segmentation purpose. More precisely, we develop an end-to-end flowchart that performs segmentation of cancer LN in PET/CT images. This pipeline (Fig. 1) is composed of the following steps:
1) Modeling of the PET image as a C-Tree (Sec. III-C). 2) Computation of region-based features at each node of the
C-Tree, chosen for their ability to discriminate cancer vs. non-cancer regions (Sec. III-D).
3) “Flattening” of these features defined within the C-Tree in order to build 3D feature maps used as additional input of the CNN architecture (Sec. III-E).
4) Multi-input CNN fed with usual PET and CT data, plus these additional feature maps (Sec. III-B).
D. Novelty of the Approach
Deep-learning strategies based on neural networks have proved their ability to efficiently tackle image processing and analysis issues in the context of 3D medical imaging. However, LN are complex structures that remain challenging to analyze, even with CNNs.
Besides, the use of CNNs for medical images has re-strictions, such as the difficult access to large datasets, the impossibility to fit a whole 3D volume to 3D CNN due to the
Fig. 1. Proposed end-to-end framework. The pipeline has two input data, namely the PET and CT images. A C-Tree modeling of the PET image is carried out, and region-based descriptors are computed for each node of the C-Tree. These descriptors are then translated as 3D feature maps, with the same spatial embedding as the PET and CT data. The PET image and the feature maps are then blended as multiple-input channels into our U-Net PET encoder. Our method relies on a U-Net architecture with two encoders (one for the PET, the other for the CT) and one decoder for image reconstruction. The final output produces tumor segmentation.
limited GPU memory size, and the necessity to decompose the volume into sub-volumes or patches to make the CNN training achievable. By contrast, a C-Tree can be generated from an entire volume, thus carrying spatial information from the entire volume, unlike a 3D CNN that deals with sub-volumes.
Our purpose is to show that the enrichment of the informa-tion provided as input of CNNs can make the segmentainforma-tion of LN more robust. More precisely, our working hypothesis is that C-Trees are relevant for computing, modeling and embedding high-level information that could not be natively modeled by CNNs.
Beyond the end-to-end flowchart described above, the other novel aspects raised in this work are the following:
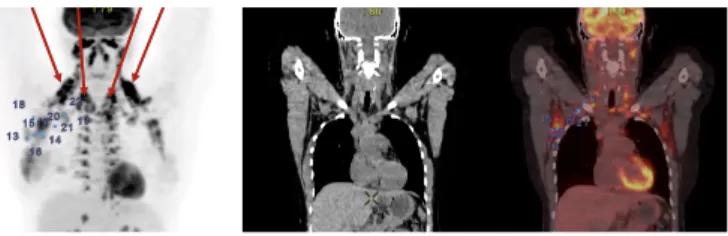
in-Fig. 2. From left to right, coronal view: PET (maximum intensity projection (MIP); LN marked in blue; brown fat pointed out by arrows), CT (slice), and superimposition of both. Brown fat induces hyper-fixating areas around the neck and upper zone of the spine, which may lead to false positive errors.
formation modeled on regions at multiple scales, whereas CNNs take as input information modeled on voxels at a single scale. Beyond exploring specific features in C-Trees that can hardly be determined by CNNs, we propose a “flattening” approach for embedding C-Tree features into 3D maps (Secs. III-D and III-E).
• We show that C-Trees are also a relevant tool for data
annotation. In particular, we use them for ground-truth refinement, to minimize the false positive / negative errors between hand-made regions and nodes of the PET C-Tree, leading to annotated regions which are spatially and spectrally homogeneous (Sec. II-B).
• We experimentally investigate the relevance of additional information as input channels. Considering the mono-channel PET U-Net as baseline, we first show that adding CT data improves the robustness of the segmentation. More importantly, we also investigate the relevance of region-based features for LN analysis in PET, assessing their individual and collective impact (Sec. IV).
II. MATERIAL
A. Data
Our dataset contains 240 pathological LN in fluo-rodeoxyglucose (FDG) PET/CT scans encompassing the body at least from proximal thigh to the base of the skull, from 52 patients at different breast cancer stages. 49 exams were acquired with a GE Discovery 710 Elite PET/CT scanner (2015) with higher resolution (slice thickness is 3.3 mm and 2.5 mm in PET and CT, respectively), whereas 3 exams were acquired with a Philips Gemini Dual PET/CT scanner with lower resolution (slice thickness is 4.0 mm and 6.5 mm in PET and CT, respectively). Eight exams from 52 patients displayed brown fat around the neck and the upper spine (Fig. 2). B. Ground-Truth Generation and Quality Enhancement
Manual delineation of small tumors in PET is laborious and time-consuming. Indeed due to the very low size of the struc-tures of interest and the low resolution of the PET images, the smallest tumors may contain only few voxels, demanding high precision and effort while delineating them in each successive slice. In order to accelerate and improve data annotation, we propose a method that computes contour candidates for each tumor. This protocol (Fig. 3) is the following:
Fig. 3. Image annotation illustrated in a coronal view (MIP) of a PET image. (1) Landmarks (red dots) are positioned by the expert at the center of each tumor. (2) LN boundaries (yellow lines) are automatically computed by the contour tool. These contours tend to be rectangular-shaped since auto-contour is applied in the original PET. (3) Improved LN boundaries (blue lines) are computed based on the C-Tree optimization procedure. These new contours are determined with respect to the nodes of the C-Tree, and defined within a super-resolution reconstruction of the PET image (Sec. III-A). (This reconstructed PET image, that has the same resolution as the CT image—due to CNN constraints—is used here for visualization purpose in (1–3)).
1) A nuclear doctor defines a landmark at the center of each malignant axillary and supraclavicular LN where the Standardized Uptake Value (SUV) [20] is the greatest. 2) An automatic, gradient-based auto-contour tool
(avail-able in General Electric softwares) selects the 3D area around each landmark and stops when the gradient changes drastically. The use of such tool is relevant since tumors in PET images present a Gaussian-like intensity profile1 with a maximal SUV in its innermost area, and rapidly decreasing values on its borders. This auto-contour tool provides ground-truth contours can-didates. This protocol is mainly automatic. However, the precision of the generated ground-truth is often hardly fair, since the gradient-based criterion used for positioning the contour relies on local analysis. This lack of precision may have negative impact on the learning process (Sec. IV-E).
3) To tackle this issue, we rely on a refinement step. This process builds upon the ability of the C-Tree to accurately model an image as the stack of its successive level-sets. By assuming that a ground-truth region may correspond to an homogeneous area with respect to the PET intensity, we aim at defining from the set of nodes N of the C-Tree of the PET image a node bG (i.e. a connected component at a given grey-level value) that matches at best the ground-truth G generated at step 2). This matching can be relevantly assessed by an error metric E that takes into account the volumes of false positives and false negatives between G and the nodes N ∈ N of the C-Tree. This corresponds to solving the optimization problem:
b
G = arg min
N ∈NE(N, G) (1)
1In case of necrosis, the highest SUV may not be located at the center
of the LN and the intensity profile is not Gaussian-like. Our database does not present such cases, and LN necrosis is very rare in the context of breast cancer.
which can be solved in sublinear time with respect the size of the C-Tree [21].
4) High-quality contours results are finally presented to the medical experts for validation.
III. METHOD
A. Data Pre-processing
PET and CT images are acquired at different resolutions and fields of view from PET/CT scanners. To use these PET and CT data in the same CNN architecture, it is relevant to normalize their size (field of view and voxel resolution) for all the patients and imaging modalities. Both PET and CT images were resampled so that voxels are isotropic, with a volume of 1.2 mm3. Since PET and CT acquisitions are both centered at the same point on the three axes, we cropped PET and CT images with respect to their intersection, thus obtaining an exact voxel-to-voxel matching for each patient.
In the PET images, all intensity values were taken into account, since small tumors do not present lower or upper bounds for significant SUV. For the CT images, we clipped the intensity values (Hounsfield Units, HU) within the range [−200, +100] in order to preserve lymph nodes and brown fat HU values. Indeed, since brown fat and tumors can exhibit similar SUV in PET, a relevant way to differentiate them is to consider their HU values in CT.
We performed lung segmentation in the 52 CT images by thresholding with respect to the lungs HU values, namely [−700, −600]. We then carried out groupwise image regis-tration on the 52 resulting lung binary masks, that consisted of aligning the centers of mass of the 52 masks and rescaling them in the coronal, sagittal and axial axes so that they have a normalized size. From the resulting lung atlas (that can be easily fitted to each patient’s image), we extracted a 3D region around the mean lungs position to target the axillary area. Doing so, we can reduce the computation time whereas targeting a smaller, more precise area and discarding false positives in regions outside the axillary area.
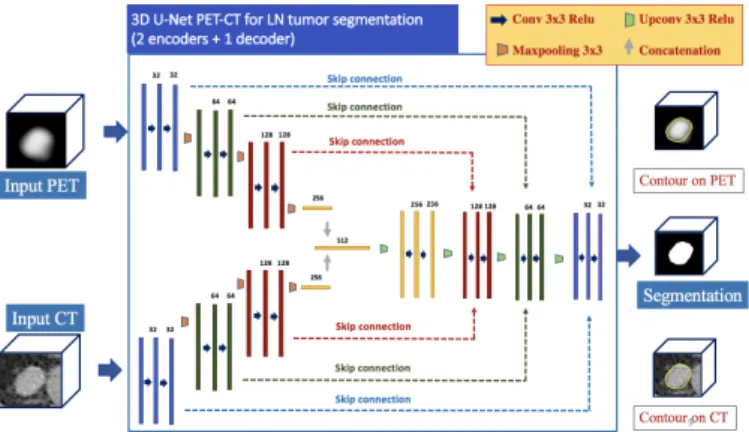
B. 3D CNN Architecture
We designed a 3D version of the original 2D U-Net ar-chitecture [22] with a 2-encoders/1-decoder structure (Fig. 4). It embodies two 3D U-Net encoders that work in parallel. The first (resp. second) encoder processes the CT (resp. PET) image and extracts feature maps from it. Each encoder is composed of 3 convolutional and max-pooling (used for downsampling) layers that produce 32, 64 and 128 feature maps. All the convolutional layers involve a kernel size of 3 × 3 × 3 and all the max-pooling layers involve a same-padding with stride 2. The two parallel encoders outputs result in two flattened layers corresponding to high-level features from PET and CT image, respectively. These flattened layers are concatenated into a single layer that carries high-level features from both modalities.
Departing from this single layer follows a decoder com-posed of 3 de-convolutional (used for upsampling) and con-volutional layers that generate 128, 64 and 32 feature maps.
Fig. 4. The CNN architecture based on U-Net, with two inputs, namely the PET and CT images.
After each de-convolutional layer, the resulting feature map is concatenated with skip connections containing features from the PET image coming from the PET and CT encoders, for the purpose of volume reconstruction. The feature map resulting from the decoder output is followed by a soft-max layer that produces a probability heat-map containing for each voxel the probability of belonging to a tumor.
C. PET Image Modeling by Component-Tree
Performing tumor segmentation with CNNs is often done with architectures using a single input image. We propose to consider a multi-input CNN architecture which, in addition to having the PET image as input, uses also the CT image and additional inputs corresponding to descriptors from a component-tree. We aim to show that CT descriptors are essen-tial, as they provide us with essential anatomical information. More importantly, we aim to prove that the descriptors derived from a component-tree allow us to embed directly high-level information into the first CNN layer, leading to an improved segmentation process. To achieve this, we model the PET image as a component-tree.
Developed in the framework of mathematical morphology, the component-tree (C-Tree, for brief) is a lossless hierarchical model dedicated to grey-level images [10]. Basically, a C-Tree is a rooted, connected, acyclic graph (i.e. a rooted tree) where each node corresponds to a connected component of a binary level-set of the image. These nodes / connected components are organized with respect to the inclusion relation.
When considering the ≤ relation on grey-level values of the image, the root of the C-Tree corresponds to the level-set at the lowest value where the unique connected component is the whole image support. At the other side of the C-Tree, i.e. at the extremities of its branches, the leaves correspond to the flat zones of locally maximal values. In the case of PET images, these regions correspond to high-metabolism areas.
The C-Tree can be used as an image processing tool, mainly for segmentation or anti-extensive filtering [23], in particular for functional imaging modalities where the intensity maxima are directly correlated to the structures of interest. The C-Tree can also be used as an image-modeling data structure,
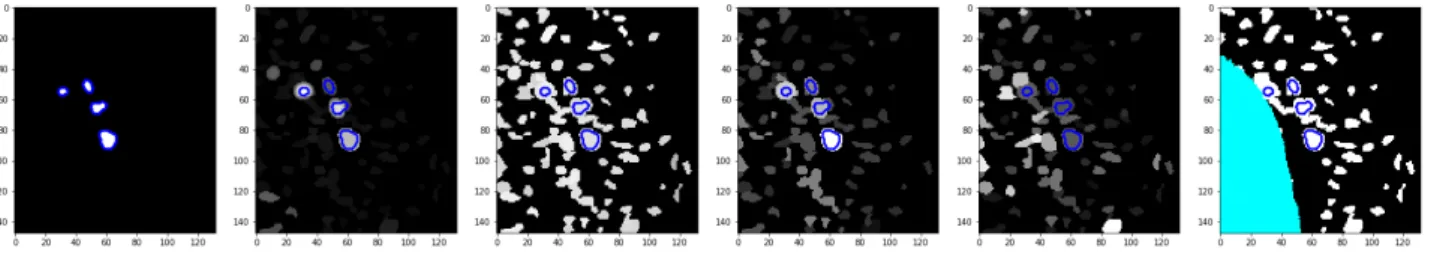
Fig. 5. Ground-truth (left) and the 5 feature maps associated to a given couple of PET/CT images (axillary region). From left to right: G, H, S, R and L (lung mask in cyan), rendered as maximum/minimum intensity projection (coronal view).
since it decomposes an image into the exhaustive set of the connected components of its binary level-sets. In such case, it is possible to store, for each node, some information on features—also called attributes [19]—describing the properties of these nodes. This is the way we use C-Trees hereafter.
It is important to note that the C-Tree can be built quite efficiently. In particular, many algorithms have been proposed for building it in quasi-linear time [24].
D. Region-Based Feature Computation
Once the C-Tree of the PET image has been built, we compute, for each node, some features dedicated to enrich the description of the image. We focus on high-level features, by assuming that a CNN cannot natively extract them from the raw input images. Two basic features are generally involved in LN segmentation from C-Trees [17], namely:
• The volume (V ) of the node, proportional to its number of voxels. In general, a valid interval for this feature with respect to LN is between 5 and 40 mm3.
• The compacity (C) of the node, approximated from the
ratio between the dimensions of its bounding box. In general, LN exhibit a globally spherical shape, leading to a high compacity.
From these two features, one can easily determine, by a simple thresholding, a set of candidate nodes that include those corresponding to LN. However, this superset contains many false positives. Then, our strategy consists of computing 5 additional features, chosen for their potential ability to characterize the LN, namely:
• The mean gradient of node contour in PET (G), since
we assume that LN altered by lesions may present a high intensity with respect to the neighbouring background.
• The mean HU value (H) of the node in CT, which is relevant for discriminating LN, that exhibit HU values in [0, 80], vs. brown fat, that exhibit HU values in [−200, −100].
• The standard deviation of H (S). Indeed, the HU intensity in LN is homogeneous in CT, contrary to false positives, e.g. inflammations around the upper part of the spine.
• The relative integral volume defined as R =RN(I(x) − minNI).dx where I(x) is the PET value at point x
and N is the considered node. This attribute tends to
characterize the nodes that best match complete LN in PET images.
• The position with respect to the lungs (L). This Boolean attribute is set to false iff the node intersects the convex hull of the lungs, thus penalizing false positives located near the heart or on the lower part of the spine.
Note that some of these attributes (H, S and L) are computed from the CT image, although the C-Tree is built from the PET image. Indeed, since the PET and CT images are natively registered, it is possible to take advantage of CT values for describing PET-defined regions.
E. Feature Maps Generation From the Component-Tree A 3D U-Net model receives 3D maps as input. Then, we need to reformulate the region-based information carried node-wise in the C-Tree by the above features in a voxel-node-wise fashion in order to build such 3D maps. Our goal is then to create one such volume (of same size as the corresponding PET/CT images) for each feature. However, the voxel-to-node mapping between the PET image and its C-Tree is multivoke, thus requiring a specific strategy.
For a given feature F , a node N is assigned a unique value F (N ). However, a voxel x of the PET/CT images may belong to many nodes Ni(more precisely, if x ∈ Ni, then x ∈ Nj for
any Nj between Ni and the root). Thus, x may be assigned
many values F (Ni) for a same feature. Consequently, in order
to build voxel-wise feature maps from these C-Tree features, one has to define a “region-to-voxel” valuation policy, i.e. rules for building one F (x) from many F (Ni). This is a necessary
condition for constructing feature maps that may be used as additional inputs for the CNN. In particular, we set:
G(x) = maxi G(Ni) (2)
H(x) = meani H(Ni) (3)
S(x) = mini S(Ni) (4)
R(x) = maxi R(Ni) (5)
L(x) = ori L(Ni) (6)
The relevance of these policies is justified by the semantics associated to the given features. Based on Eqs. (2–6), we can build feature maps G, H, S, R and L as grey-level volumes, with the same structure as the PET and CT images. These feature maps (Fig. 5) may then be considered as 5 potential inputs in addition to the two PET and CT images, providing complementary information to the CNN.
(a) U-PET-CT with ground-truth (b) U-PET vs. U-PET-CT vs. U-PET-CT-all (c) U-PET-CT-all vs. the 5 U-PET-CT-F Fig. 6. Evolution of the accuracy (DSC) function for training and validation sets during training on 1 000 epochs. (a) U-PET-CT: ground-truth vs. improved ground-truth. (b) U-PET vs. U-PET-CT vs. U-PET-CT-all. (c) U-PET-CT-all vs. the 5 U-PET-CT-F .
IV. EXPERIMENTS ANDRESULTS
A. Training
We carried out our experiments on a Titan RTX graphic card with 24GB memory and we used the CNN architecture presented in Sec. III-B. The 3D U-Net was trained on 1 000 epochs using Adam optimization method with an initial learn-ing rate of 0.001 and a batch size of 8. With regards to the loss function, we used the Dice similarity coefficient (DSC).
From the 52 PET/CT exams, 32 exams (201 tumors) were used for training, 10 exams (56 tumors) for validation and 10 exams (63 tumors) for testing.
We performed training by patch extraction. To reduce the variance and avoid to generate batches that are not represen-tative of the overall dataset, we opted for a data generation solution that provided shuffled inter-patient, inter-class and inter-type lymph node samples.
For training, 402 patches of size 80 × 80 × 80 mm3
were used. They satisfy the following constraints: (1) two consecutive patches do not belong to the same patient; (2) each patch as a 0.5 probability of being positive (i.e. 3D region extracted at the center of a lymph nodes tumor location), and negative otherwise (i.e. random region within the remainder of the axillary region); (3) each patch as a 0.5 probability of being artificial (i.e. having undergone rigid data augmentation). B. Quality Metrics
For evaluation purpose, true positives (TP), false positives (FP) and false negatives (FN) were computed voxel-wise (seg-mentation semantics) and region-wise (detection semantics, since LN are small structures). More precisely, for a given image, TPvoxel is the number of voxels that belong both
to the segmentation and the ground-truth, whereas TPregion
is the number of one-to-one mappings between connected components of the segmentation and ground-truth (i.e. the barycentre of each connected component is contained in the other). FP and FN are computed accordingly for voxel and region paradigms (thus quantifying surjectivity and non-injectivity of the segmentation / ground-truth mappings).
We evaluated our results using 3 metrics: (1) Sensitivity, SE = TP / (TP + FN); (2) Positive Predictive Value, PPV = TP
/ (TP + FP); and (3) DSC = 2TP / (2TP + FP + FN), thus leading to 6 quality metrics, namely SEvoxel, SEregion, PPVvoxel,
PPVregion, DSCvoxel and DSCregion.
C. Experimental Protocol
In these experiments our purpose is not to compare our proposed CNN-based framework to other CNN architectures. Indeed, our contribution is not related to the proposal of a new CNN architecture (we mainly build upon U-Net), but on the design of a hybrid approach coupling CNNs and C-Trees by embedding in the first high-level information obtained from the second. On the other hand, as we pointed out in Sec. I-B, the issue of tumoral LN segmentation from multimodal PET/CT was not significantly dealt with beforehand via CNNs.
Then, our purpose is to investigate the plus-value of pro-viding additional, high-level information as input of a CNN architecture for improving LN segmentation.
Based on these assumptions, our baseline is a 1 encoder/1 decoder 3D U-Net taking the only PET image as input (noted U-PET). The proposed experiments are the following:
(i) We compare the results obtained by U-PET vs. the 2 encoders/1 decoder U-Net of Fig. 4 using both PET and CT (noted U-PET-CT). This aims to demonstrate the relevance of using additional morphological information. (ii) Considering U-PET-CT, we also study the impact of the quality of the ground-truth on the segmentation. We aim to show that the C-Tree optimization procedure (Step 3 in the protocol of Sec. II-B) leads to improved results. (iii) For each of the 5 features F in {G, H, S, R, L}, we
compare the impact of enriching U-PET-CT with this unique feature (the resulting networks is called U-PET-CT-F ).
(iv) Finally, we compute the results provided by the whole framework (Fig. 1) that involves the U-Net architecture using PET and CT plus all the 5 C-Tree-based features (noted U-PET-CT-all).
D. Results
Mean Dice similarity coefficients (DSC) on training and validation sets during the network training are provided in
TABLE I
QUALITY SCORES FOR THE SEGMENTATION RESULTS WITHU-PET, U-PET-CT, U-PET-FFORF IN{G, H, S, R, L}ANDU-PET-ALL. THEDSC, PPV
ANDSESCORES(MEAN±STD DEV.)ARE PROVIDED WITH BOTH SEGMENTATION AND DETECTION SEMANTICS. Voxel-based metrics Region-based metrics
DSCvoxel PPVvoxel SEvoxel DSCregion PPVregion SEregion
U-PET 0.833 ± 0.133 0.828 ± 0.148 0.825 ± 0.087 0.799 ± 0.155 0.758 ± 0.221 0.891 ± 0.082 U-PET-CT 0.866 ± 0.080 0.844 ± 0.103 0.887 ± 0.047 0.872 ± 0.131 0.850 ± 0.189 0.926 ± 0.063 U-PET-CT-G 0.850 ± 0.116 0.862 ± 0.142 0.856 ± 0.055 0.874 ± 0.143 0.841 ± 0.194 0.903 ± 0.075 U-PET-CT-H 0.841 ± 0.040 0.835 ± 0.036 0.859 ± 0.059 0.860 ± 0.106 0.848 ± 0.116 0.886 ± 0.113 U-PET-CT-S 0.834 ± 0.102 0.839 ± 0.154 0.840 ± 0.071 0.740 ± 0.213 0.722 ± 0.248 0.930 ± 0.120 U-PET-CT-R 0.831 ± 0.126 0.862 ± 0.158 0.851 ± 0.060 0.821 ± 0.159 0.806 ± 0.233 0.925 ± 0.122 U-PET-CT-L 0.847 ± 0.136 0.844 ± 0.166 0.873 ± 0.051 0.836 ± 0.129 0.815 ± 0.188 0.906 ± 0.084 U-PET-CT-all 0.867 ± 0.116 0.872 ± 0.142 0.896 ± 0.055 0.894 ± 0.143 0.851 ± 0.194 0.933 ± 0.075
Fig. 6. In particular, Fig. 6(a) deals with (ii), Fig. 6(b) with (i) and (iv) and Fig. 6(c) with (iii) and (iv).
Quantitative results on prediction are provided in Tab. I. In particular, the 6 quality scores (DSC, PPV, SE; voxel- and region-based) are computed to compare the segmentation vs. the ground-truth for (i), (ii), (iii) and (iv).
Qualitative results are provided in Fig. 7, which compares segmentation results with U-PET, U-PET-CT and U-PET-CT-all, i.e. for (i) and (iv).
E. Discussion
1) Influence of the morphological information (i): We first investigate the influence of adding morphological information via the CT image. On the one hand, the PET image contains paramount information for LN segmentation. A relevant base-line for segmentation is then a U-Net with the only PET image as input (U-PET). On the other hand, the CT image provides information on the patient’s morphology, that is also likely to guide the process. We then compare the behaviour of a second U-Net with two images, PET and CT, as input (U-PET-CT). In Fig. 6(b), we observe that the U-PET-CT has slightly better results than U-PET for training but significantly better results for validation. In addition, the U-PET-CT validation curves is smoother than the U-PET curve, which tends to show that the learning is more difficult with U-PET. The quality scores of the segmentation results (first two rows of Tab. I) confirm this behaviour and that the CT information is important in the context of tumoral LN segmentation for discriminating true lesions from non-tumoral activations based on anatomical information not available in PET.
2) Influence of the ground-truth quality (ii): Before inves-tigating the influence of the C-Tree-based features, we study the impact of quality of the ground-truths on the segmentation. To this end, we consider U-PET-CT for two datasets of ground-truths, built with and without the C-Tree optimization procedure (Step 3 in Sec. II-B). In Fig. 6(a), we observe both for training and validation a better accuracy with than without this optimization-based refinement of the ground-truth. This is confirmed when comparing the segmentation results. Indeed, the 6 metric values with non-refined ground-truth are (in the same order as in Tab. I): 0.836, 0.840, 0.835, 0.688, 0.688, 0.706, exhibiting better values (from +0.03 to +0.20) in favour of the refined ground-truths. This emphasizes the
importance of defining accurate ground-truths for the (very small) LN objects, and the adequacy of the C-Tree for such task. This also justifies that all our experiments be made with these refined ground-truths.
3) Influence of the C-Tree-based features (iii), (iv): The last step of these experiments consists of investigating the individual and collective impact of the C-Tree features on the segmentation results. To this end, we first compare the results of U-PET-CT-all vs. U-PET-CT. In terms of training and val-idation (Fig. 6(b)), U-PET-CT-all provides better results. This trend is confirmed when observing the segmentation metrics (Tab. I, second and last rows), where U-PET-CT-all provides slightly better to better scores (from +0.001 to +0.028). Beyond these quantitative results, the segmentations illustrated in Fig. 7 show the positive impact of considering additional C-Tree features: e.g. smoother contours, better topology, removal of brown fat false positives.
From an individual point of view, we observe that adding only one C-Tree feature (U-PET-CT-F ) does not provide better results compared to U-PET-CT, and often degrades the results (Figs. 6(b,c) and Tab. I, 2nd to 7th rows). (In this context, U-PET-CT-G seems to be the most powerful of the 5 experimented features.) This emphasizes that each feature provides specific (necessary but not sufficient) information that need to be combined in order to fully express an actual plus-value.
V. CONCLUSION
We proposed a hybrid approach that combines a CNN with a high-level C-Tree analysis of the PET/CT images for tumoral LN segmentation. Experimental results confirm the relevance of this approach.
In particular, the information coming from CT is essential in the detection and segmentation of lymph node tumors. For instance, the only way to differentiate the main tumor from breast cancer in the mammary glands and lymph nodes tumors that have the same size, is their location in the body; this information is only given by the CT. In addition, the information carried / modeled by a C-Tree can be added as input into a CNN as a supplementary channel and help to enhance the results.
Finally, combining CNNs and hierarchical models appears as a promising paradigm. This motivates further
develop-Fig. 7. Predictions (coronal slices, fused PET/CT image samples). Left: U-PET; middle: U-PET-CT; right: U-PET-CT-all. Boundaries of predictions (blue) and ground-truth (green). With U-PET-CT-All, results are smoother and closer to the ground-truth, with a better topology and less false positives.
ments. Beyond a deeper experimental study, geared towards the analysis of various kinds of features, and their impact on the CNN-based segmentation quality, the next steps will also consist of investigating the relevance of other kinds of CNN architectures (e.g. ResNet [25]) and other kinds of tree structures (e.g. the tree of shapes [26]) that could also be used for fine modeling of PET and CT images in the context of
CNN-based segmentation.
REFERENCES
[1] J. Vercher-Conejero, L. Pelegr´ı-Martinez, and D. Lopez-Azna et al., “Positron emission tomography in breast cancer,” Diagnostics, vol. 5, pp. 61–83, 2015.
[2] R. Piva, F. Ticconi, and V. Ceriani et al., “Comparative diagnostic accuracy of 18F-FDG PET/CT for breast cancer recurrence,” Breast Cancer, vol. 9, p. 461, 2017.
[3] D. Groheux, A. Cochet, and O. Humbert et al., “18F-FDG PET/CT for staging and restaging of breast cancer,” J Nucl Med, vol. 57(Supplement 1), pp. 17S–26S, 2016.
[4] I. Nogues, L. Lu, and X. Wang et al., “Automatic lymph node cluster segmentation using holistically-nested neural networks and structured optimization in CT images,” in MICCAI, 2016, pp. 388–397. [5] A. Barbu, M. Suehling, and X. Xu et al., “Automatic detection and
segmentation of axillary lymph nodes,” in MICCAI, 2010, pp. 28–36. [6] N. Bnouni, O. Mechi, and Rekik et al., “Semi-automatic lymph node
segmentation and classification using cervical cancer MR imaging,” in ATSIP, 2018, pp. 1–6.
[7] B. E. Bejnordi, M. Veta, and J. van Diest et al., “Diagnostic assessment of deep learning algorithms for detection of lymph node metastases in women with breast cancer,” J Amer Med Assoc, vol. 318, pp. 2199–2210, 2017.
[8] H. Wang, Z. Zhou, and Y. Li et al., “Comparison of machine learning methods for classifying mediastinal lymph node metastasis of non-small cell lung cancer from18F-FDG PET/CT images,” EJNMMI Res, vol. 7,
p. 11, 2017.
[9] Z. Zhong, Y. Kim, and L. Zhou et al., “3D fully convolutional networks for co-segmentation of tumors on PET-CT images,” in ISBI, 2018, pp. 228–231.
[10] P. Salembier, A. Oliveras, and L. Garrido, “Antiextensive connected operators for image and sequence processing,” IEEE T Image Process, vol. 7, pp. 555–570, 1998.
[11] M. H. F. Wilkinson and M. A. Westenberg, “Shape preserving filament enhancement filtering,” in MICCAI, 2001, pp. 770–777.
[12] A. Dufour, O. Tankyevych, and B. Naegel et al., “Filtering and seg-mentation of 3D angiographic data: Advances based on mathematical morphology,” Med Image Anal, vol. 17, pp. 147–164, 2013.
[13] F. J. Alvarez Padilla, ´E. Grossiord, and B. Romaniuk et al., “Multicriteria 3D PET image segmentation,” in IPTA, 2015, pp. 346–351.
[14] ´E. Grossiord, H. Talbot, and N. Passat et al., “Automated 3D lymphoma lesion segmentation from PET/CT characteristics,” in ISBI, 2017, pp. 174–178.
[15] F. J. Alvarez Padilla, B. Romaniuk, and B. Naegel et al., “Hierar-chical forest attributes for multimodal tumor segmentation on FDG-PET/contrast-enhanced CT,” in ISBI, 2018, pp. 163–167.
[16] ——, “Matching filtering by region-based attributes on hierachical structures for image co-segmentation,” in ICIP, 2018, pp. 131–135. [17] ´E. Grossiord, N. Passat, and H. Talbot et al., “Shaping for PET image
analysis,” Pattern Recogn Lett, vol. 131, pp. 307–313, 2020.
[18] H. Urien, I. Buvat, and N. Rougon et al., “Brain lesion detection in 3D PET images using max-trees and a new spatial context criterion,” in ISMM, 2017, pp. 455–466.
[19] E. J. Breen and R. Jones, “Attribute openings, thinnings, and granulome-tries,” Comput Vis Image Und, vol. 64, pp. 377–389, 1996.
[20] S.-C. Huang, “Anatomy of SUV,” Nucl Med Biol, vol. 27, pp. 643–646, 2000.
[21] N. Passat, B. Naegel, and F. Rousseau et al., “Interactive segmentation based on component-trees,” Pattern Recogn, vol. 44, pp. 2539–2554, 2011.
[22] O. Ronneberger, P. Fischer, and T. Brox, “U-Net: Convolutional net-works for biomedical image segmentation,” in MICCAI, 2015, pp. 234– 241.
[23] R. Jones, “Connected filtering and segmentation using component trees,” Comput Vis Image Und, vol. 75, pp. 215–228, 1999.
[24] E. Carlinet and T. G´eraud, “A comparative review of component tree computation algorithms,” IEEE T Image Process, vol. 23, pp. 3885– 3895, 2014.
[25] K. He, X. Zhang, and S. Ren et al., “Deep residual learning for image recognition,” in CVPR, 2016, pp. 770–778.
[26] P. Monasse and F. Guichard, “Scale-space from a level lines tree,” J Vis Commun Image R, vol. 11, pp. 224–236, 2000.