ARNORES
MASSACHUSFTTS INSI fTF
OF TECHNOLOGY
Calculating Humanitarian Response Capacity
JU N
19 2by
LIBRA RIEL.S
Kathryn K. Nishimura
Bachelor of Business Administration, Marketing and International Business Georgetown University, Washington, DC, 2006
and Jian Wang
Master of Business Adninistration,
China Europe International Business School, Shanghai, China, 2007 Submitted to the Engineering Systems Division in Partial Fulfilhnent
of the Requirements for the Degree of Master of Engineering in Logistics
at the
Massachusetts Institute of Technology June 2013
V 2013 Kathryn K. Nishimura and Jian Wang. All rights reserved. The authors hereby grants MIT permission to reproduce and to distribute publicly
paper and electronic copies of this document in whole or in part.
Signature of Authors.. ... ... .... . ... Master of Engineering in Logistics Program, Engineering Systems Di 'son
/1 - May 10, 2013
Certified by.... ... ...
Dr. Jarrod Goentzel Director, MIT Humanitarian Response Lab
Certified by ...
Dr. Jason Acimovic Assistant Professo; of Vy Chain Management, Pennsylvania State University
Accepted by. . ----.. -....
/
6( Professor YossfiiefiEi4ia Gray I Professor of Engineering Systems, MIT Director, MIT Center for Transportation and Logistics Professor, Civil and Environmental Engineering, MIT
Calculating Humanitarian Response Capacity
ByKathryn K. Nishimura and Jian Wang Submitted to the Engineering Systems Division on May 10, 2013 in Partial Fulfillment of the Requirements
for the Degree of Master of Engineering in Logistics
Abstract
Since the year 2000, at least 300 disasters occurred annually, catching more than 100 million people unprepared and in need of international assistance every year. The United Nations operates five humanitarian response depots (UNHRDs), stocked with over 1,000 types of humanitarian relief items. In the event of an emergency, the UNHRDs deploy the pre-positioned stocks to meet the initial demand of those people affected. Our thesis evaluates the response capacity of the UNHRDs to a single potential disaster: what
percentage of total affected people can be served and in what time period. Developed from a stochastic linear programming model, this two-part index assumes that the depots operate as a network, lead times are proportional to distances from depots, and stockpiles are optimized individually for each relief item. Given a specific level of initial inventory for each item, the model also provides insight into how to distribute relief items throughout the five depots to minimize the expected delivery time. Based on a marginal benefit analysis, each unit of
inventory is allocated to a depot to minimize the total expected delivery times to disasters. We describe how the UNHRDs and other humanitarian relief organizations can strategically pre-position limited emergency relief resources to maximize their capacity to respond to disasters.
Thesis supervisor: Jarrod Goentzel
Title: Director, MIT Humanitarian Response Lab Thesis supervisor: Jason Acimovic
Acknowledgements
We are deeply grateful for all those who made this thesis possible and enriched our experiences at MIT.
-Jason Acimovic and Jarrod Goentzel for advice and direction -Thea Singer for feedback
-SCM staff, professors, and classmates for insight, laughs, and personal growth
Table of Contents Acknowledgem ents... . ---- -...-.. -... 3 List of Figures...- - . - -...-.... --... ... 5 List of Tables... ... ---... ... 6 List of Formulas ... 1. Introduction...----.... ---... ... 8 1.1 Background ... 10
Section i: Classification of a Disaster... 10
Section ii: Disaster Response and Humanitarian Aid ... II Section iii: Stockpiling and Preparedness ... 13
1.2 Structure of Paper...14
2. Literature Review ... 15
2.1 Choosing Key Performance Indicators (KPIs) ... 15
2.2 M easuring Capacity ... 17
2.3 M odeling Capacity ... 18
2.4 Optim izing Fulfillment...20
3. M ethods ... 22
3.1 Input Data...22
Section i: Dem and Inputs...23
Section ii: Supply Inputs...26
Section iii: Delivery Costs ... 28
Section iv: The Basic LP Model...31
3.2 The Stochastic M odel...32
3.3 Developm ent of Simulation Scenarios ... 34
4. Data Analysis... 36
4.1 Analysis on Optim ization Results and Increasing Capita Inventory ... 37
Section i: W eighted Delivery Times to Determ ine Initial Inventory ... 40
Section ii: M arginal Benefit Analysis to Determ ine Depot Usage... 41
Section iii: Disaster Analysis to Determ ine Full Depot Levels... 49
Section iv: The Optimal Index ... 52
4.2 Response Capacities on Select Item s ... 53
4.3 Insight...58
5. Conclusion ... 59
5.1 Areas for Further Research...60
Section i: Replenishm ent Cycles...60
Section ii: Order Policy...60
Section iii: Delivery Costs ... 61
Section iv: Needs Assessm ent...61
5.2 M oving Forward...62
6. References ... 63
List of Figures
Figure 1: Trends and Occurrences of Disasters (Guha-Sapir, Vos, Below, & Ponserre, 2011) ... 11
Figure 2: Adapted Timeline of Disaster Response Phases (Beresford & Pettit, 2012) ... 12
Figure 3: The Humanitarian Relief Supply Chain (Fritz Institute, n.d.)... 13
Figure 4: Distribution of 1,881 Disasters from 2008-2012 by TAP ... 24
Figure 5: Expected Frequency by TAP of the 852 Disasters...25
Figure 6: Optimal Proportional Distribution throughout the Five Depots Based on CI ... 38
Figure 7: Optimal Pre-Positioned CI Levels throughout the Five Depots... 39
Figure 8: Scenario Example of Two Warehouses and Three Potential Disaster Sites ... 42
Figure 9: Expected Time to Serve and Percent of People Served as CI Increases ... 52
Figure 10: Proportional Allocations for Blankets... 55
Figure 11: Allocations for Blankets by CI Units ... 56
Figure 12: Proportional Allocations for Soap Bars ... 57
List of Tables
Table 1: Initial Supply of Seven Pre-Positioned Items... 27
Table 2: Delivery Times (in Hours) from Depots to Sub-Regions... 30
Table 3: Samples of Optimal Pre-Positioned Allocations by Percentage of Initial CI ... 37
Table 4: Delivery Time Savings by Stocking One Unit in a UNHRD ... 40
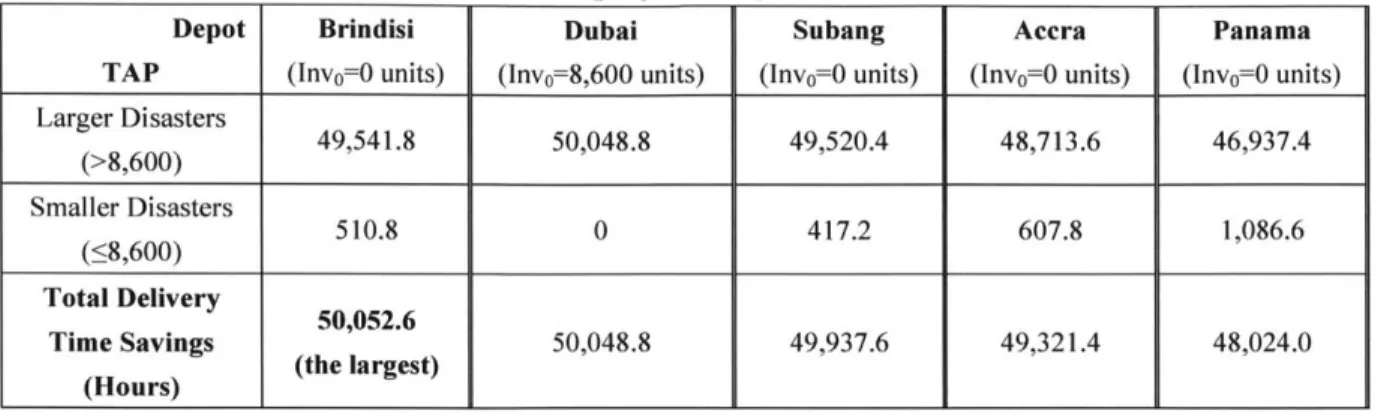
Table 5: Delivery Time Savings by Stocking the 8,600th Unit in a UNHRD ... 45
Table 6: Delivery Time Savings by Stocking the 8,601st Unit in a UNHRD ... 46
Table 7: Delivery Time Savings by Stocking the 10,347th Unit... 47
Table 8: Delivery Time Savings by Stocking the 10,348th Unit... 49
Table 9: Largest Regional TAP Corresponds with Expected Percent of People Served and Delivery Times ... 5 1 Table 10: Index on Seven Items Stored at the UNHRDs ... 54
List of Formulas
Formula 1: Basic LP Model Objective Function... 31
Form ula 2: Stochastic Objective Function ... 32
Formula 3: Optimal Allocation Stochastic Objective Function... 34
Form ula 4: B alance Index ... 34
Formula 5: Delivery Time Savings for Larger Disasters for the 8,6 0 0th Unit ... 44
"Humanitarian aid cannot only intervene after the event to support victims, but as a defense of human rights, it is also aform ofprevention" (Beristain, 2006).
1. Introduction
When a disaster calamitous enough to necessitate international assistance strikes, many international, governmental, and non-governmental organizations deliver emergency relief items in an attempt to assist those affected by the catastrophe. If there is a lack of coordination, needs assessment, and preparation time, such support can be chaotic and inefficient.
To address these issues, the United Nations' World Food Programme (WFP)
established the first United Nations Humanitarian Response Depot (UNHRD) in Brindisi, Italy in the year 2000, with the strategic purpose of coordinating the shipments of relief items to each disaster site. Now expanded to five warehouses around the world, the UNHRDs stockpile over five million humanitarian aid items on behalf of over 50 humanitarian organizations. Known as a "preparedness tool" (UNHRD, 2013), the UNHRDs reduce overall logistics expenses and decrease response times, when compared with humanitarian relief organizations acting independently. Assuming the WFP can coordinate the
deployment of emergency relief items on behalf of all organizations with stockpiles in the UNHRDs, this network approach would result in more productive logistics operations, cost efficiency, and lives saved.
The purpose of our research was to assess how emergency relief items are currently stocked throughout the depot network. Using stochastic linear programming (LP), we developed a measurement index to evaluate the UNHRDs' response capacity to disasters.
depot network were expected to meet the needs of those affected by large disasters. Specifically, we used historic disaster data to examine how fast the UNHRD network can deploy an individual item to multiple disaster site scenarios to most quickly serve people affected during the initial emergency period after the onset of a disaster. We also assessed the percentage of beneficiaries who may be served given current inventory allocations and in what period of time. Partnered with MIT's Humanitarian Response Lab, we established an initial humanitarian response index that may aid the WFP in reassessing its inventory strategy for disaster relief stockpiles.
The measurement of response capacity is crucial to all humanitarian relief
organizations, despite the nominal attention it is given in practice. To increase preparedness to meet the needs of those affected by disasters, organizations like the WFP must know their inventory's capacity to respond to potential victims. According to the Fritz Institute, a nonprofit organization that specializes in disaster response solutions, logistics is the backbone of humanitarian relief organizations: their "chief task is the timely mobilization of financing and goods from international donors and administering relief to vulnerable beneficiaries at disaster sites across the globe" (Fritz Institute, n.d.). By consolidating the delivery of relief items to countries affected, the UNHRDs reduce both the competition for transportation services and the congestion of arrivals at disaster sites. Understanding how to optimize stockpile levels and position inventory throughout the depot network is directly related to how quickly the depots can serve those affected by disasters, thus benefitting both the donors and beneficiaries. Before we address these issues, however, we define the terms to
1.1 Background
Section i: Classification of a Disaster
The Centre for Research on the Epidemiology of Disasters (CRED), located in Brussels, Belgium, maintains and updates an Emergency Events Database, known as EM-DAT. This database holds statistics on more than 18,000 global disasters and their human impact from the year 1900 on. Because of its caliber of detailed, updated information and its objective to support humanitarian action, we chose to adopt EM-DAT's definition for a disaster. A disaster is a "situation or event, which overwhelms local capacity, necessitating a request to [a] national or international level for external assistance" (EM-DAT, 2013). For a disaster to be documented in EM-DAT, it must contain at least one of the following criteria (2013):
-10 or more people killed -100 or more people affected
-Declaration of a state of emergency -Call for international assistance
In its 2011 Annual Disaster Statistical Review, CRED aggregated the annual number of reported disasters and victims, shown in the figure below.
700.-- 421 432 -450
7 Victims (in millions)* 413 4 432 414
==== No.of reported disasters i 386 400
600 -# 0 % 343o % . 355 350 5 332 5 300 278 2595 4 % 250 W 0 227 t300 200-01-4 0 4 1508 200-Z 100 100 0
* Victims: sum of killed and total affected
Fiuure 1: Trends an( Occurrences of Disasters (Guha-Sapir, Vos, Below. & Ponserre, 2011)
While a unique disaster's exact date and impact cannot be predicted, the historic data shows that some trends in disaster occurrence may exist. The information in the database can be
organized so that disaster sites are grouped into one of 23 geographical regions. It is more precise to forecast the number of annual disasters by region than by country. This aggregated, regional view also provides a more accurate estimate of the number of people affected by future disasters per region. Our research adopted EM-DAT's 23 regions in our analysis of disaster trends.
Section ii: Disaster Response and Humanitarian Aid
Every year, billions of dollars' worth of relief items are deployed to people affected by natural disasters and conflicts (Fritz Institute, n.d.). Humanitarian aid encompasses "all cargo required in response to a major emergency or crisis" (Beresford & Pettit, 2012). According to Beresford and Pettit (2012), such items include:
emergency food rations, water and water purification facilities, sanitation equipment, tents and shelters, equipment necessary to aid the construction and maintenance of temporary shelters, medical supplies, clothing, blankets, and all other materials required to support a population left without access to normal living facilities (2012). Responsible humanitarian relief organizations should coordinate all activities before, during, and after a disaster occurs. The humanitarian relief effort conducted during the three months after the onset of a disaster is termed the "emergency" phase of humanitarian response
(Everywhere, Jahre, & Navangul, 2011). Measuring the response capacity of the UNHRD network during this period is the focus of our research. We assume that local stakeholders address the time period before a disaster, and other humanitarian relief and governmental organizations concentrate on the later phases of disaster response. Figure 2 depicts a timeline
of the phases of disaster response, below.
Max xEmergency Restoration Activity Reconstruction Rebuilding Disaster Onset 0 Time
During the emergency period, relief organizations first conduct an initial rapid needs
assessment to determine the number of people affected and relief items needed immediately. It is important to note that this round of emergency relief items is mobilized to disaster sites as quickly as possible to cover the initial demand. The attention to fast delivery is evident in that organizations will choose to charter aircraft to deliver initial relief items, despite their much higher cost per pound-mile compared to the delivery costs of other slower modes of
transportation. Therefore, for the duration of the emergency phrase, we assume the UNHRDs also concentrate on the quick deployment of relief supplies.
Section iii: Stockpiling and Preparedness
The level of preparedness influences the quality of emergency response. The Fritz Institute emphasizes preparedness as the first step in the supply chain for humanitarian relief.
Assessment/ Resource Transportation Tracking & Stock/Asset Extended Point Performance Appeals Mobilization ''*'eet Execution Tracing Management of Delivery Evaluation
Figure 3: The Humanitarian Relief Supply Chain (Fritz Institute, n.d.)
Response capacity increases with the UNHRDs' level of preparedness. One way to increase preparedness and capacity is through inventory pre-positioning. To prepare for disasters,
strategically placed inventory in the depots "through the integration of facility location, inventory management, and transportation decisions, while taking into account the key
factors affecting it, [improves] the response and efficiency of the relief network" (Richardson, de Leeuw, and Vis, 2010). In the middle of suppliers and end users, the UN depots divide the humanitarian response supply chain from a push system to a pull system. The push side, which is less time sensitive, consists of donors and suppliers of humanitarian aid
organizations who send relief items to be stored in the depots. An appeal for disaster relief assistance signals the number of items requested, and stockpiling inventories closer to disaster sites shortens the outbound lead times. Duran et al. conclude that pre-positioning inventory will "reduce the procurement and transportation phase in response to disasters" (Richardson, de Leeuw, and Vis, 2010). Thus, knowing where to pre-position items to minimize delivery times is key in the humanitarian supply chain.
1.2 Structure of Paper
This section provided a background to the humanitarian response sector in the context of preparedness capacity vis-a-vis pre-positioning emergency relief items. The next section
introduces prior research conducted in this field. Building on this research, the third section outlines the methodology for our approach in collecting data and designing our stochastic LP model. The fourth section presents our analysis of the decision variables in the LP model and the conclusions reached. The fifth and final section summarizes how our research can
contribute to the UNHRDs' logistics operations and how other humanitarian organizations can profit from the application of our analysis. It concludes with recommendations and areas for further research and development.
2. Literature Review
The notion of capacity underlies disaster response. According to Ira Haavisto from the Hanken School of Economics, "disaster preparedness focused on developing the capacity to respond quickly and appropriately to a disaster ... is the foundation of all relief activities" (2012). Yet, there is a dearth of literature examining standardized or universal indicators that humanitarian relief organizations use or should use to measure their response capacity. Even the Humanitarian Response Review, an independent assessment by humanitarian response experts commissioned by the UN, notes the "lack of a transparent mechanism" and recommends to "organizations to reassess their declared response capacities" (2005).
In this section, we highlight existing frameworks regarding key performance
indicators in the humanitarian response sector; capacity measurements; and contributions by LP modeling, fulfillment optimization, and stochastic programming. Our research aimed to
further this literature with the development of our stochastic LP model and index that calculates humanitarian response capacity.
2.1 Choosing Key Performance Indicators (KPIs)
A humanitarian response organization must consider how the trade-off between
agility and leanness in its supply chain matches its strategy and goals. Organizations face the dilemma of maintaining regional stockpiles of relief items to anticipate future demand while also earmarking their donors' funds for more pressing applications. Donations to cover overhead, like inventory holding costs, are not deemed as critical or transparent as other expenses, such as the purchase of tents for people made homeless by an unanticipated
earthquake. After all, donors typically want proof of their impact.
The choice of KPIs helps organize and focus an organization's strategy for
humanitarian response. Davidson (2006) recommends a framework of four performance indicators for the International Federation of Red Cross and Red Crescent Societies (IFRC) to measure its humanitarian logistics operations: donation-to-delivery time, appeal coverage, financial efficiency, and assessment accuracy. Without access to financial and operational reports, we do not attempt to assess the financial efficiencies of the UNHRDs' operations, and we rely on EM-DAT's collection of past disasters to assume expected demand for relief items.
Therefore, the scope of our research encompasses the first two indicators.
Donation-to-delivery time measures the time to deliver an item after a donor has pledged to donate it (Davidson, 2006). For our research, we assume the donor is the UNHRD network and delivery times for relief items increase if disasters occur farther from a depot. Likewise, donation-to-delivery times will be shortened if a disaster occurs closer to a stocked depot. Regarding appeal coverage, we believe that the UNHRD network aims to fulfill 100% of the needs of the total population affected by large disasters. Thus, an appeal for a potential disaster would be equal to the total number of people affected by it. We would then measure coverage in terms of how well-stocked the UNHRD network is to meet the demand of those affected, a concept we coined as the network's capita inventory (CI). CI, which we
2.2 Measuring Capacity
Knight defines capacity as the "ability and quality of organizations to respond to a disaster event with goods" (2012). In her research, Knight ran simulations to record the humanitarian response capacity of the UNHRDs to satisfy the needs of people affected by a specific disaster. She selected ten key emergency relief items stored in the UNHRDs and three specific, single disaster scenarios, and she determined current inventory levels, air and ocean lead times, supply replenishment times, and the expected demand for each item at each disaster. Her research measured the inventory levels, aggregated at a UNHRD network level, after the onset of the disaster. The simulation monitored daily total inventory from the day the disaster hit to the modeled deployment and replenishment of items to their
order-up-to levels. The simulation also recorded demand satisfied day-by-day, denoted by the percentage of people affected that were allocated a particular emergency relief item. In this way, "ability" was measured in terms of inventory on hand meeting simulated demand,
and "quality" was assessed by the speed of demand fulfillment.
In concurrence with Knight's simulation, we measure capacity in an index that considers both the percentage of people that could be served by UNHRD stockpiles and the time to deliver certain emergency relief items. To further the robustness of Knight's model,
our research includes a probability analysis that examines hundreds of potential disaster scenarios, multiple initial inventory allocations, and the value of holding additional inventory in certain depots over others. To do so, we applied stochastic linear programming to assess
2.3 Modeling Capacity
The amount of literature covering capacity from a mathematical perspective is limited. Beamon and Kotleba find that "mathematical [modeling] of inventory management in
emergency relief efforts has received little attention" (2006). Yet, LP models allow for the use of optimization to assess humanitarian response capacity. LP requires the following four components (IBM, 2013):
-Decision variables -An objective function -Constraints
-Data
Decision variables are resources the model optimizes on. In our paper, they are represented
by the UNHRDs' inventory allocations. The objective function indicates how decision
variables affect the minimization or maximization equation. In the case of our paper, the objective is to minimize the total expected time to deliver stockpiled relief items to a potential disaster site. Constraints represent the limited resources that the decision variables depend on; they could be represented by initial inventory levels. The final piece, data, is needed to quantify the relationships between the objective function and constraints. EM-DAT and the
UNHRD websites provide an abundance of information necessary to run the LP model and
apply a stochastic formulation.
With an LP model, our research assumes the objective function and constraints are linearly-related. Although directly proportionate relationships may be relevant in some industries, such a measure may not be the most realistic in calculating the fulfillment of demand in a life-saving setting, like humanitarian response. Professor Jose Holguin-Veras,
a director in sustainable freight systems, mentioned in a lecture at MIT on November 2, 2012 that human suffering is not linearly proportionate to the amount of time spent waiting for an emergency relief item, such as a ready-to-eat food bar. As an example, he noted that a person may live a few days without food, but to survive, his need for food would increase
exponentially-not linearly-as the days progressed, up until death or nourishment ends that need.
Despite this complex reality, Srivastava, Shenoy, and Sharma (1989) describe multiple advantages of using LP models, including such models' efficient distribution of decision variables given scarce resources; improved, objective decision-making; and usage of sensitivity analysis and shadow prices (1989). With limited funding and finite warehouse capacity, the depots cannot stock a bottomless number of emergency relief items, and it's necessary for the UNHRDs to serve all people affected by disasters without personal prejudices. For the scope of our research, a LP model should give adequate insight to measure UNHRD capacity and determine optimally pre-positioned UNHRD stockpiles.
We found two papers that applied mathematical modeling to the humanitarian response sector. In one, Akkihal (2006) addresses the issue of selecting ideal locations to pre-position non-consumable humanitarian relief supplies. He runs his optimization by minimizing the distance between potential warehouse locations and people made homeless by large disasters
(2006). Our research also uses EM-DAT to extrapolate our demand data for emergency relief items. However, our research does not limit expected demand to cover solely
homeless people, or those needing shelter. Some disasters, like droughts for example, may necessitate humanitarian assistance even though people affected by the disaster still have
shelters. Therefore, we chose to use information regarding the total affected populations (TAP), or those people made "injured, homeless, or affected" (EM-DAT, 2013) by disasters to construe our feasible disaster scenarios.
Similarly, Kendal, Abidi, and Klumpp (2011) develop a model to determine the ideal location for a single depot stocked with humanitarian relief supplies. They use 11 large disasters in EM-DAT as their input data and compare their model's transportation
performance against that of the UNHRDs and IFRC in responding to the disasters (2011). They assume the depot closest to the disaster site would deliver inventory first: our model agrees with and adopts this statement. While operating only one depot requires longer transportation times to fulfill the total demand of people affected, the authors suggest that total costs with one depot would be lower than those for the UNHRDs and IFRC due to less fixed costs and coordination expenses. Regardless, our research focuses on the five
established UNHRD locations. Rather than assess where depots should optimally be located, our emphasis is on where inventory should optimally be placed within the five depots.
2.4 Optimizing Fulfillment
In the commercial sector, LP models are used extensively to execute fulfillment operations. Acimovic's (2012) research, for example, analyzes a large online retailer's outbound distribution costs and replenishment policy. Acimovic applies optimization modeling to propose solutions to minimize the retailer's total expenses concerning customer order fulfillment and warehouse replenishment. By considering both a customer's current order for an item and potential future orders for the same item, his dynamic programming, or
"perfect hindsight" framework, aims to minimize the immediate expense plus expected future costs (Acimovic, 2012). The concept of perfect hindsight is also highlighted in our
stochastic LP model: it knows each disaster scenario and its probability of occurring before optimizing on the variables.
In order to run his LP heuristics, Acimovic made the assumption that, in cases where supply cannot meet demand, a dummy warehouse holds an extremely large amount of inventory-albeit at a much higher cost-for the retailer to meet its demand. The dummy warehouse serves as the last recourse; our LP model also includes a dummy depot to account for occasions where demand exceeds supply.
UNHRD and EM-DAT provide enough data on emergency relief supplies and people
affected by past disasters. Having this wealth of data allows for the application of probability distributions. With a stochastic element, a model may apply the probability that certain disasters in a large number of finite disaster scenarios may occur (Shapiro & Ruszczynski,
2009). As disasters have an element of uncertainty in terms of when they happen, where they
are, and what their impact is, stochastic modeling addresses the uncertainty by estimating the likelihood of a future disaster based on the large collection of past disaster information. Doing so to minimize expected delivery times would result in a deterministic optimization model (Shapiro & Ruszczynski, 2009). Based on the types of optimization models presented, we detail in the following Methods section how we tailored our model to the issue of measuring humanitarian response capacity.
3. Methods
Our research aims to develop an index that measures the UNHRDs' response capacity to serve the people affected by large disasters. In order to define this index, we constructed an LP model with the objective of minimizing the average delivery time to send pre-positioned relief items from five UNHRDs to a potential disaster site. We formulated and solved a stochastic linear program, coded in Python and on a Gurobi platform, by Pennsylvania State University Assistant Professor Jason Acimovic, to calculate part of the index. This stochastic model minimizes the expected sum of delivery times to serve the people affected by a
disaster. The initial allocation of inventory can be fixed or set as a decision variable. We used the outputs from running the stochastic model to evaluate how well-prepared current
UNHRD stockpiles were to serve disasters of various magnitudes and how fast the depots
delivered these stocks to disasters.
In this chapter, we first explain our methodology for the data collection of EM-DAT disaster records and UNHRD stock reports, as well as delineate other supply and demand
assumptions. Then, we walk through the LP model's formulation. After, we explain Acimovic's stochastic programming model and the many simulations we developed to run in it.
3.1 Input Data
This section explains how we normalized the key inputs run for our LP model. With more extensive input data, logisticians can easily adjust these inputs to run future optimizations for more specific results.
Section i: Demand Inputs
It is impossible to forecast when and where each disaster will occur, as well as the magnitude of its influence. Yet, the UNHRDs must pre-position inventory in preparation for disasters. For our model, we assume that what happened in the past is equally likely to occur in the future. Therefore, we utilized past disasters as possible scenarios for future disasters: we based potential future demand for emergency relief items from the recorded disaster events in EM-DAT. The website keeps records of the following defined statistics
(2013):
-Injured: People suffering from physical injuries, trauma, or an illness requiring medical treatment as a direct result of a disaster
-Homeless: People needing immediate assistance for shelter
-Affected: People requiring immediate assistance during a period of emergency; it can also include displaced or evacuated people
We used the sum of injured, homeless, and affected people from each reported disaster as the total affected population (TAP) statistic. TAPs became the proxy for the demand for relief items. TAPs account for all types of victims who may require basic emergency relief items upon the onset of a disaster. We chose to define our demand dataset conservatively by using the more inclusive TAP statistics. In a humanitarian context, one could argue that the cost of underage, either in the form of lives lost or negative media publicity, greatly exceeds the overage cost of stocking extra relief items.
To determine which disasters' to include in the demand dataset, we selected a time period of five years because we wanted to collect recent statistics. We examined
EM-DAT's 2,951 registered disaster records between 2008 and 2012, and we avoided including disasters that occurred too far in the past because recent exogenous variations may
have affected TAP statistics. Such variations include climate change, advances in
communication and technology, and stronger pre-disaster preparedness efforts. Therefore, we assume that recent disasters are a better predictor of future disasters. We eliminated the
755 disaster entries with missing TAP records and 315 records with missing disaster start
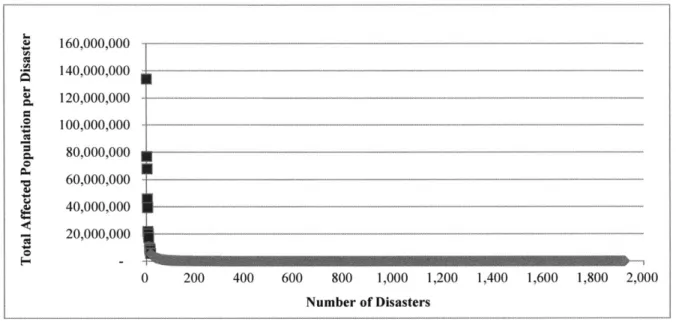
dates. Figure 4 shows the magnitude of the TAPs of the remaining 1,881 disasters.
0 200 400 600 800 1,000 1,200 1,400 1,600 1,800 2,000
Number of Disasters
Figure 4: Distribution of 1,881 Disasters from 2008-2012 bv TAP
We further eliminated 68 disaster records for epidemics and 90 for industrial accidents. These two types of disasters require specific medicines, vaccines, and handling supplies for hazardous materials, instead of the more typical emergency relief items deployed to disasters. Then, we identified the extreme outliers, highlighted in red in Figure 4 above. The outliers, representing the top 1% of disasters, increased the average TAP per disaster almost four times from 110,301 to 405,265 people. We removed the outliers from the potential demand
scenarios, resulting in a dataset of 1,706 disasters with the median TAP per disaster as 750 people. As the objective of the UNHRDs is to send emergency relief supplies to people
160,000,000 - 140,000,000 120,000,000 100,000,000 8 0 80,000,000 40,000,000 20,000,000 .~20,000,000 6
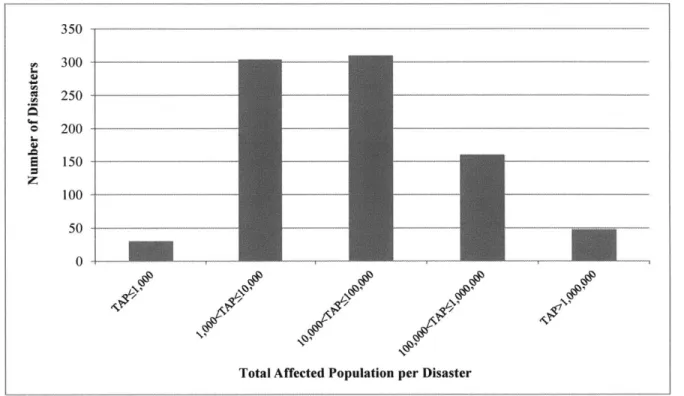
affected by large disasters, we defined a "large disaster" as one with a TAP greater than 750.
Figure 5, below, shows the expected frequency by TAP of the final 852 disasters: these disasters represent the potential disasters and TAPs that the UNHRDs may serve in our model. 350 300 250 o 200 -E 150 -100 - --- -50 0
-Total Affected Population per Disaster Figure 5: Expected Frequency by TAP of the 852 Disasters
To finalize the disaster input dataset, we made two final assumptions. First, we assume that each beneficiary within a disaster's TAP would require an equal amount of emergency relief items during the emergency phase of disaster response. In reality, those affected by disasters have varying degrees of needs, both in terms of quantity and resource type. Our model simplified such demand. Second, we assume that each disaster has a chance of occurring next. This means that each of the 852 disasters inputted in the model had an equal weight of importance, regardless of whether the TAP size was 754 people or
Section ii: Supply Inputs
The UNHRDs operate regionally and hold inventory on the behalf of different humanitarian organizations. To streamline disaster relief efforts, we presuppose that a network system would make the UNHRDs' capable of executing disaster response activities
faster. Therefore, in the model, we assume that the UNHRDs coordinate deployment operations as a united, collaborative system. The UNHRDs together would decide inventory replenishment and distribution policies.
The UNHRD website updates a stock report of the inventory records for over one thousand SKUs stocked in the five depots. We sourced our supply dataset from the online report collected on February 12, 2013. From IFRC appeals, we analyzed which items were targeted to beneficiaries during the emergency stage of response to disasters, where they were pre-positioned, and what levels of inventory were stocked. We chose to run optimizations on items that were 1) pre-positioned across at least three depots and 2) customary requests to fulfill basic needs in emergency appeals. Based on the two criteria, we chose to analyze the inventory levels of the following stockpiled items: blankets, buckets, jerry cans, kitchen sets, latrine plates, mosquito nets, and soap bars. To simplify each category, we combined similar items. For example, the contents and weight of a "kitchen set" were similar to those of a "cooking set;" hence, all items were accounted for under the term "kitchen set." Table
TFable 1: Initial Supply of Seven Pre-Positioned Items
Item Blanket Bucket Jerry Kitchen Latrine Mosquito Soap Bar
Depot Can Set Plate Net
Accra 39,130 16,560 500 5,167 800 6,100 240 Brindisi 18,558 - 43,450 7,779 3,650 2,000 5,000 Dubai 45,383 20,754 70,999 3,586 838 60,197 15,000 Panama 37,333 2,000 30,441 4,466 352 23,148 5,000 Subang 24,220 - 11,165 4,008 300 16,500 -Total UNHRD Inventory 164,624 39,314 156,555 25,006 5,940 107,945 25,240 Persons Served/Unit 2.5 5.0 2.5 5.0 50.0 2.5 1.0 Total Capita 411,560 196,570 391,388 125,030 297,000 269,863 25,240 Inventory
With 164,624 units, blankets had the highest level of inventory within the UNHRDs for these selected items. Latrine plates, on the other hand, had the lowest UNHRD inventory at 5,940 units. Each single item in stock, however, may serve a different number of people. One soap bar and one latrine plate, for example, can respectively assist either an individual or a small community.
Humanitarian aid organizations may be more concerned with how many beneficiaries can be served with their stockpiles than the actual inventory quantities. For instance, a latrine plate can serve 50 beneficiaries; 5,940 latrine plates, 297,000 beneficiaries. We converted each unit of inventory in the UNHRDs into how many beneficiaries the item can serve. We defined the total number of potential beneficiaries a given level of inventory may serve as capita inventory (CI). Defined in units of CI, blankets still have the largest
stockpile with 411,560 units. Latrine plates, with 297,000 units of CI, are no longer the least stockpiled item. The last row in Table 1 above summarizes the CI of the seven items. We refer to these CI levels as the status quo levels of initial supplies.
If CI levels could not meet expected demand, a dummy depot-stocked with enough
Cl-served the remaining demand after the UNHRDs stocked out. We assume there would be no supply replenishment between the appeal for emergency relief items and the
deployment of those items to disaster sites. More than 100 of the 852 disasters in the
demand dataset have a TAP greater than the highest CI level of the seven selected relief items; given the status quo inventory levels, the UNHRDs would not be able to meet the expected demand 100% of the time. As other organizations also deploy emergency relief supplies, a less than 100% response capacity may be sufficient. The dummy depot can be viewed as the UNHRDs' supplier who delivered directly to disaster sites as a last resort for the
UNHRDs. As a result, the delivery time from the dummy depot to any disaster sub-region would be longer than any lead time between the five depots and any disaster site.
Section iii: Delivery Costs
During the emergency phase of disaster response, humanitarian organizations prioritize fast delivery of relief items. When a large disaster necessitates international aid, the organizations aim to deploy supplies in chartered flights to cover initial demand very quickly. We assume that the central planner, the UNHRD network, is willing to pay for the chartered flights. Our model focuses on minimizing expected delivery time, assuming that air freight is the sole type of transportation.
The total delivery time from depots to disasters involves the completion of paperwork, such as pro-forma invoices; dispatch and transportation of cargo; clearance of customs; unpacking and sorting; and last-mile distribution to beneficiaries. Regardless of the end-to-end time to deliver items to a particular disaster from any depot, the UNHRDs must
follow the steps above. We assume the chartered flight air time is the key time differential in all delivery times and is linearly related to the as-the-crow-flies geographical distances between the depots and disasters. We approximated delivery times under this assumption.
In EM-DAT, each disaster record is categorized into one of 23 geographic
sub-regions. We slightly simplified delivery times by assigning equal times to all disasters in the same sub-region; therefore, we grouped each of the 852 disaster inputs into one of the
23 regions. We used Google Maps to determine the center of each sub-region. For example, the website positioned Northern Europe in Tofsingdalen National Park, Sweden (Google Maps, 2013). We then calculated the distance of each depot to sub-region arc, using an application by Daft Logic, a website that measures distances on Google Maps. 115 geographical distances were determined (see Appendix B). Our method assumes that each direct arc is representative of the direct path a chartered flight would travel.
To convert the delivery distances into delivery times, we rounded the 115 distances to the nearest hundred miles. Given an approximate average airplane speed of 500 miles per hour, we divided each distance by 500 miles. For example, an arc from Accra, Ghana to Western Africa is 529 miles, rounded to 500 miles, and equivalent to one hour. Similarly, we calculated the distance of the longest arc, Subang, Malaysia to Central America: 11,000 miles converted into a 22 hour flight. The time to travel between each depot and sub-region represented our model's dataset for delivery times, summarized in Table 2 below.
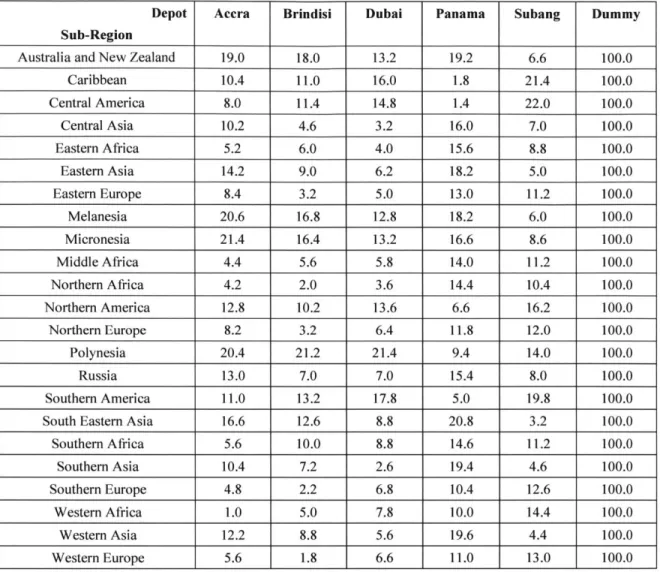
Table 2: Delivery Times (in Hours) from Depots to Sub-Regions
Depot Accra Brindisi Dubai Panama Subang Dummy Sub-Region
Australia and New Zealand 19.0 18.0 13.2 19.2 6.6 100.0
Caribbean 10.4 11.0 16.0 1.8 21.4 100.0 Central America 8.0 11.4 14.8 1.4 22.0 100.0 Central Asia 10.2 4.6 3.2 16.0 7.0 100.0 Eastern Africa 5.2 6.0 4.0 15.6 8.8 100.0 Eastern Asia 14.2 9.0 6.2 18.2 5.0 100.0 Eastern Europe 8.4 3.2 5.0 13.0 11.2 100.0 Melanesia 20.6 16.8 12.8 18.2 6.0 100.0 Micronesia 21.4 16.4 13.2 16.6 8.6 100.0 Middle Africa 4.4 5.6 5.8 14.0 11.2 100.0 Northern Africa 4.2 2.0 3.6 14.4 10.4 100.0 Northern America 12.8 10.2 13.6 6.6 16.2 100.0 Northern Europe 8.2 3.2 6.4 11.8 12.0 100.0 Polynesia 20.4 21.2 21.4 9.4 14.0 100.0 Russia 13.0 7.0 7.0 15.4 8.0 100.0 Southern America 11.0 13.2 17.8 5.0 19.8 100.0
South Eastern Asia 16.6 12.6 8.8 20.8 3.2 100.0
Southern Africa 5.6 10.0 8.8 14.6 11.2 100.0 Southern Asia 10.4 7.2 2.6 19.4 4.6 100.0 Southern Europe 4.8 2.2 6.8 10.4 12.6 100.0 Western Africa 1.0 5.0 7.8 10.0 14.4 100.0 Western Asia 12.2 8.8 5.6 19.6 4.4 100.0 Western Europe 5.6 1.8 6.6 11.0 13.0 100.0
Last, we assigned a delivery time of 100 hours between the dummy depot and any sub-region. Doing so forced the model to use the dummy depot as the last warehouse option in delivering emergency relief supplies to disasters. In calculating humanitarian response capacity, we ignored any supplies shipped from the dummy depot; after all, those supplies didn't really exist in the UNHRD network.
Section iv: The Basic LP Model
We inputted the defined demand, supply, and delivery time datasets to build the first iteration of our LP model in Excel Solver. Applying Acimovic's (2013) denominations for variables, they are as follows:
d - Demand in regionj in time period t
Zti - Capita inventory at the beginning of time t in depot i cy - Hours required to deliver an item from depot i to regionj
xt; - Capita inventory deployed at the beginning of time t from depot i to regionj We set the objective function to minimize the total time to deliver the CI necessary to meet each disaster's demand. The formula is below:
min x cij)
Formula 1: Basic LP11 Model Objective Function
The objective function was subject to the following constraints:
I xi Zi
t
xi; > d;
Ztj = j'
Zti Z(t-1)i ~ xti
For each time period, the total number of items deployed by each depot could not exceed the depot's inventory on hand. Also for each time period, the number of items requested at each disaster must be satisfied. A depot's current inventory was equal to the starting inventory one time period before minus the inventory sent to a disaster one time period before. Variables were non-negative.
To test the model, we assigned demand for a disaster, based on sample TAPs, and ran it with various allocations for initial capita inventory. We attempted to model the UNHRDs' ability to respond to three consecutive disasters and with 23 regions forj. However, this basic model and its over 400 variables were too complex for Excel Solver to optimize on. Therefore, to manage our large datasets, we adopted Acimovic's stochastic model using
Gurobi as the the LP solver.
3.2 The Stochastic Model
Similar to the basic model described above, Acimovic's model minimized the "average time it takes to ship items from depots to beneficiaries" (2013). However, his model included a stochastic element. It allowed for inputting K scenarios, each scenario represented by a unique disaster record and TAP. Each scenario had a probability, p k of
occurring. Therefore, the objective function is defined as follows:
min p
(x;cj
k i,j
Formula 2: Stochastic Objective Function
Subject to:
xii
s;
zix11 t dj
The objective function was also subject to the following constraints: the total amount of CI sent from each depot must be less than or equal to the depot's starting inventory, the total amount of capita inventory sent from all depots to a disaster must be at least equal to each
disaster's TAP, and variables were non-negative. With this objective, the model first calculated the number of units of CI sent from a depot to a disaster sub-region for a given disaster. This amount of CI was multiplied by its delivery time, for all units demanded by each disaster, to realize a total delivery time per a disaster. Each total delivery time for a disaster scenario was multiplied by its respective probability of occurring. These weighted sums were added together, and the stochastic model aimed to minimize the total weighted delivery time.
Our research benefitted from applying the stochastic model's framework for two reasons. One, we could incorporate our entire demand dataset and run the optimization model. For our research, we assigned an equal probability of occurrence to each of the 852 disaster data inputs. Two, given an initial level of CI, the model could recommend where to pre-position initial supplies throughout the UNHRD network. The recommendation is useful in order to determine the impact on the potentially suboptimal delivery time given a current inventory position. To determine the optimal pre-positioned allocation of supplies, we solved Formula 2 with the following two changes. First, zi's became decision variables. Second, the following constraint was added: Z is equal to the total amount of initial capita inventory throughout the five depots, so that:
zi = Z
The other constraints from Formula 2 still applied to the revised objective function, Formula
min p> x;x cj)
k i,j
Formula 3: Optimal Allocation Stochastic Objective Function
If we assign V(OPT, Z) as the objective value in Formula 3 and V(z) as the objective value
in Formula 2, we determined the imbalance of a given inventory position as the Balance Index, defined below.
V(z)
V(OPT, Z) Formula 4: Balance Index
In order to analyze such outputs, we first needed to determine what scenarios to run in the model.
3.3 Development of Simulation Scenarios
To create the response capacity index, we needed to understand how changes in CI affected UNHRD response capacity to disasters. Therefore, we kept the inputs for demand
and delivery costs constant, changing only the input for initial supplies. We ran the stochastic model with initial CI ranging from 0 units to 20 million units, and we allowed the model to recommend optimal allocations for initial inventory among the five UNHRDs. While it's intuitive that increasing CI should serve more beneficiaries and yield shorter response times, instinct does not suggest where to ideally stockpile CI and what levels of CI correspond to what service levels.
After understanding if and how the stochastic LP model worked, we wanted to apply the index to status quo UNHRD stockpiles. Therefore, we measured the humanitarian
response capacity of each of the seven selected items in their status quo distributions throughout the five depots. We also measured the response capacity of the items as if they were optimally pre-positioned, as determined by Acimovic's model. We compared each item's Balance Index, or its status quo capacity with its optimal capacity, to assess the misallocation-or potential for improvement in inventory management-of each item throughout the UNHRD network. By inputting various scenarios into the stochastic model, we observed how the UNHRDs' response capacity changed. In the next section, we analyze the results in more detail.
4. Data Analysis
Running the stochastic optimization model under numerous initial situations
generated valuable insight. The output recommended where to place initial inventory and recorded which depots sent inventory to each disaster scenario. With these outcomes, we could calculate the percentage of TAPs served and the average time to deliver inventory for the given disaster scenarios. In all cases, the disaster scenarios were kept constant, meaning that each run in the model faced the same demand dataset of 852 equally-likely-to-occur disasters. Instead of varying demand for emergency relief items, we adjusted the level of supply. We ran optimizations by varying the amounts of initial supplies, also known as capita inventory (CI), inputted into the model. By doing so, we could analyze how changes in CI affected inventory allocations and response capacity.
In the first part of our data analysis, we forced the model to allocate initial supplies throughout the five UNHRDs in ideal quantities that would minimize overall expected delivery times. As we increased the initial supply of CI, we examined how and why the UNHRDs distributed the units within the five depots. In the second section, we assessed the current inventory positions of the seven selected types of items stocked within the UNHRD network. We wanted to quantify how well pre-positioned these items were; therefore, we applied our two-part index to calculate their inventories' response capacity. Given the actual inventory levels, we measured the percentage of potential beneficiaries the relief supplies could serve and the expected time for delivery.
4.1 Analysis on Optimization Results and Increasing Capita Inventory
Using the LP model if Formula 3 to distribute the optimal mix of initial supplies throughout the UNHRD network, we set CI levels from one unit to over 20.5 million units in different runs. Given a certain starting inventory size, we wanted to discover where the
items were distributed throughout the depots. Despite changing CI, we had expected that the optimal allocations between the depots would remain proportional; however, our results were unexpected. The proportion of units held in each depot changed based on initial
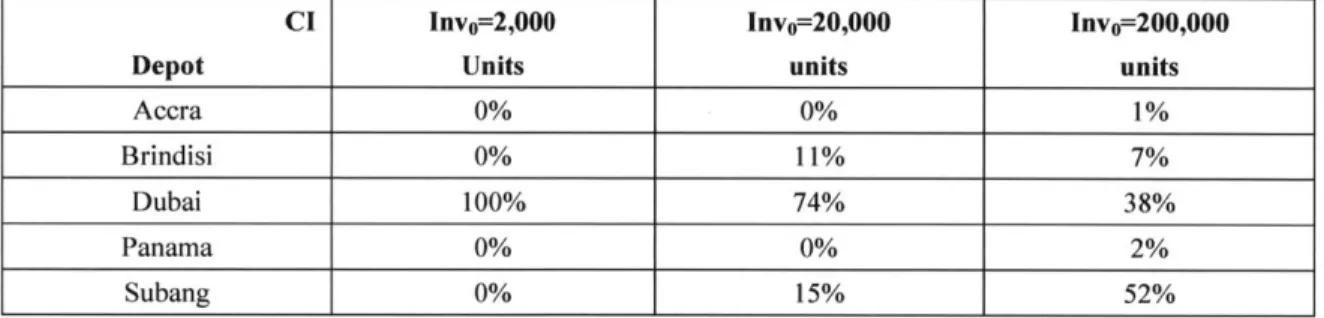
inventory levels. Table 3 highlights the allocations based on three samples of initial CI. Table 3: Samples of Optimal Pre-Positioned Allocations by Percentage of Initial C
CI Invo=2,000 Invo=20,000 Invo=200,000
Depot Units units units
Accra 0% 0% 1%
Brindisi 0% 11% 7%
Dubai 100% 74% 38%
Panama 0% 0% 2%
Subang 0% 15% 52%
The different pre-positioned mixes of inventory throughout the depots were directly affected by how much initial supplies a humanitarian relief organization, like the UNHRDs, had in stock. In turn, given a certain level of starting CI, we found that the UNHRDs can create an optimal allocation strategy for the distribution of relief items throughout the five depots. A less than optimal allocation would result in longer delivery times, represented by the placement of inventory in depots farther away from the expected disaster locations. For a visual representation of an optimal allocation strategy, Figures 6, as follows, illustrates how CI is allocated as a proportion of total CI throughout the depot network. Figure 7 then
100% -90% -80% * 70%--- --60% 50%-e 40% 30% 20% 10% 0%. 1 100 1,000 10,000 20,000 40,000 80,000 160,000 320,000 640,000 1,280,000 2,560,000 5,120,000 Capita Inventory
Accra N Panama w Subang U Brindisi Dubai
Figure 6: Optimal Proportional Distribution throughout the Five Depots Based on CI
10,000,000 1,000,000 100,000 10,000 1,000 100 10
Capita Inventory (CI)
e Accra U Panama 6 Subang U Brindisi Dubai Figure 7: Optimal Pre-Positioned CI Levels throughout the Five Depots
The graphs raised the following three questions:
1. Why was capita inventory first placed in Dubai?
2. When did the model decide to stock inventory in an additional depot?
3. As capita inventory increased, when did the model level off the number of items placed
in certain depots?
In the consecutive sections, we address these issues.
Section i: Weighted Delivery Times to Determine Initial Inventory
The model allocated the first 8,600 units of CI to the depot in Dubai. In order to serve
8,600 people (or fewer) most efficiently, the UNHRDs should pre-position all initial supplies in
Dubai. Examining delivery times clarified why Dubai was the first depot selected to carry an emergency response item. That is, why the model placed the first unit of CI in Dubai.
With no CI in the UNHRD network, the model would be forced to rely on the dummy depot. For each disaster scenario, the time to deploy relief items would be reduced if one unit was pre-positioned in any of the depots. Stocking one unit in a depot would yield delivery time savings equal to the difference between the delivery time to use the dummy depot (100 hours) and the time to deploy the item from a depot to the respective disaster scenario. If one unit of
CI was stocked in one of the depots, the UNHRDs' total time savings to deploy the item to the
852 disaster scenarios are summarized in Table 4 below.
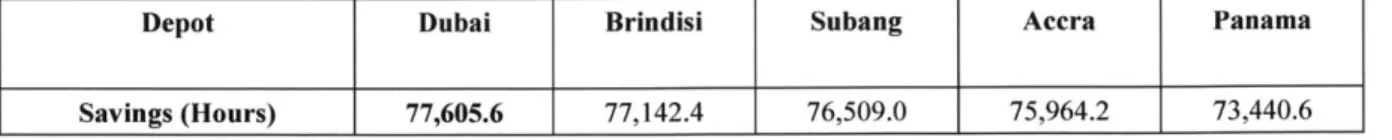
Table 4: Delivery Time Savings by Stocking One Unit in a UNIHRD
Depot Dubai Brindisi Subang Accra Panama
Total delivery time to all the 852 scenarios could be reduced by over 73,440 hours just by delivering one item from the UNHRD network. Dubai acquired the largest potential savings in time: 77,605.6 hours. Therefore, the model allocated capita inventory to Dubai first. The model's objective function forced the allocation of initial supplies to depots that minimized the overall weighted delivery times. On average, stocking one unit of CI in Dubai would save
91.09 hours (=77,605.6/852) for the UNHRD network to respond to one disaster with one unit of Cl.
Section ii: Marginal Benefit Analysis to Determine Depot Usage
We applied marginal benefit analysis to verify how increases in capita inventory in the
UNHRD system affected its pre-positioning. In other words, once the UNHRD network had a
certain level of initial supplies, we examined the potential delivery time savings earned by placing an extra unit in one of the five depots. If a UNHRD deployed an additional unit of CI, the item may serve one more beneficiary, meaning the dummy depot (with a 100 hour delivery time) would not be relied upon. As a result, UNHRD response capacity would increase.
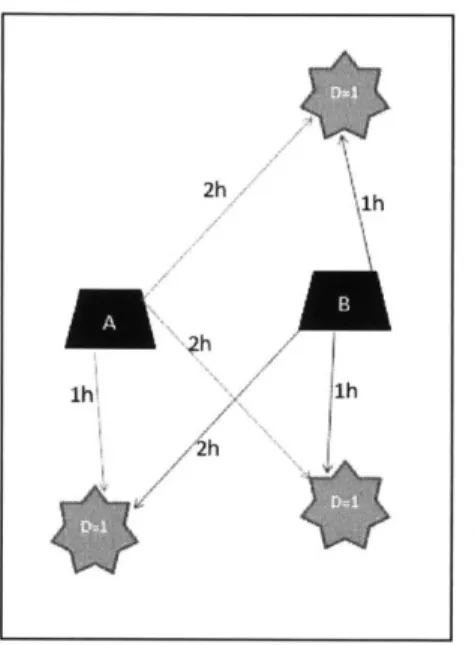
To help us understand why multiple depots were used and why the proportional allocation of depots changed as a function of initial inventory levels, we first provide a simple example. Let's assume one disaster will happen, and it has an equal chance of occurring in one of three places. When the disaster strikes, the people there will need one unit of emergency relief supplies. Two warehouses, A and B, may store such units to send to disaster sites. However, only one unit is available to pre-position in a warehouse, and an organization must decide which warehouse to store the item in before the disaster hits. The organization requests
to minimize the delivery time from the warehouse to potential disaster site. Figure 8 below illustrates this scenario and indicates the delivery times in hours, h, between the warehouses to the three disaster sites, D.
2h
1 2h
1h 1h
Figure 8: Scenario Example ofTwo Warehouses and Three Potential Disaster Sites
If warehouse B is used, the expected delivery time is 1.33 hours (=(1) + 1(1) + 1(2)).
3 3 3
Warehouse A incurs an expected 1.67 hour delivery time (= (2) + 1(2)+ 1 (1)). Therefore, the
3 3 3
organization should place the unit of emergency supplies in warehouse B. If the organization had two units of emergency supplies and expected one future disaster, where would the
organization stock the second unit? With one unit already in warehouse B, an additional unit in B would not shorten the expected delivery time to a disaster. However, with one unit in
warehouse A, the expected delivery time by using two warehouses is 1 hour ( (1)+ 1(1) +
1
-(1)). Stocking one unit in both warehouse A and B yields a 0.33 hour savings in response time. Warehouse A may take longer to send the unit to two of the three disaster sites; however, the
organization knows that warehouse B is available to deploy more quickly its one unit to those two sites.
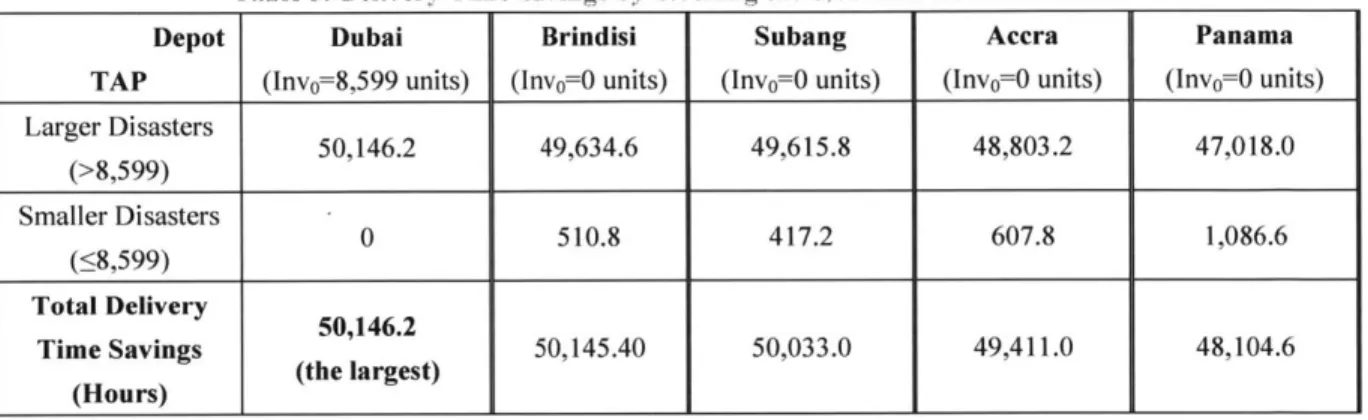
Returning to our UNHRD analysis, to justify when the model recommended using a second depot, we first determined the additional savings in delivery times if an 8,6 0 0th unit of CI was added to one of the five depots. We compared the savings between each of the five
potential placements of the unit. The optimal depot to place the unit in was the one that
incurred the largest additional savings in delivery time. Then, we ran the same analysis with an
8,601s' unit.
The model already allocated 8,599 units of CI to Dubai. An extra relief item would serve the 8,600th person only in disasters with a TAP larger than 8,599 people. A total of 549 disasters fell into this category. For these larger disasters, the 8,600th unit would incur a delivery cost in each of these disaster scenarios, regardless of the depot the unit was stocked in because it would be deployed to the disaster. The extra 8,60 0th unit would now be deployed
from a UNHRD rather than the dummy depot for these 549 larger disasters. As a result, the time savings in stocking an additional unit would be equal to the difference between 100 hours
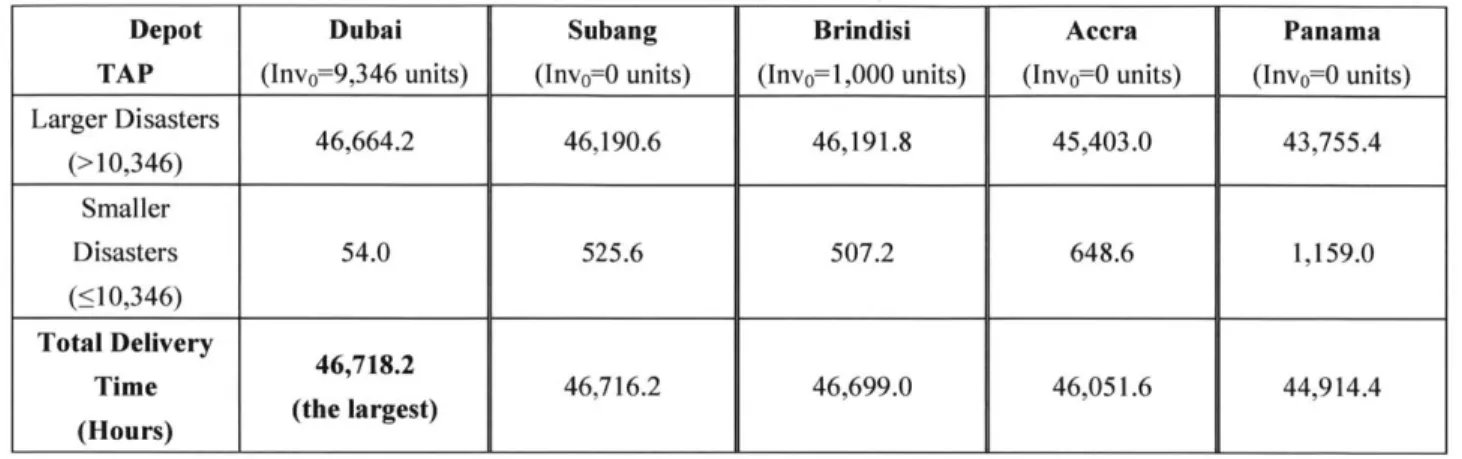
from the dummy depot and the time each depot required to send the unit to each disaster's sub-region. The row in Table 5, entitled Larger Disasters, adds up the time saved for each depot to deploy the 8,600th unit to the 549 larger disasters. Because the dummy depot would equally serve all remaining demand above 8,600 units of CI irrespective of where the 8,60 0th unit was pre-positioned, we did not include its delivery times in our calculations. Therefore, the
time saved from these larger disasters, if one unit is placed in a depot, is shown in Formula 5
below.
(100 - cg;)
j:dj>8,599
Formula 5: Delivery Time Savings for Larger Disasters for the 8,600"' Unit
Disasters with a TAP less than or equal to 8,599 people would value the 8,6 0 0th unit of
capita inventory differently. Response times to such smaller disasters would improve by stocking an additional item only in the scenarios where the item was stocked in a depot closer than Dubai to the disaster site. Moreover, stocking an extra unit in any depot would not add to the overall total number of beneficiaries potentially served because the existing 8,599 units of CI would be sufficient to serve these TAPs. In Table 5, the row entitled Smaller Disasters adds the potential savings in delivery times of the depots to sub-regions for those disasters with a TAP
under 8,599 people. For these 303 smaller disaster scenarios, if Dubai were the closest depot to the disaster site, none of the remaining depots acquired any delivery time savings by stocking an
extra unit of CI. If one of the other four depots were located closer to a certain disaster site, then the depot acquired a time savings equal to the difference between its delivery time and Dubai's delivery time. Explicitly, i' is the depot in question that deployed its inventory to disaster
j,
before the 8,6 00,h unit of CI was added to the UNHRD system.I (cgj - min(cgy, cgrj)) j:d1s8,599