Publisher’s version / Version de l'éditeur:
Fluid Phase Equilibria, 182, 1-2, pp. 313-324, 2001-06-05
READ THESE TERMS AND CONDITIONS CAREFULLY BEFORE USING THIS WEBSITE.
https://nrc-publications.canada.ca/eng/copyright
Vous avez des questions? Nous pouvons vous aider. Pour communiquer directement avec un auteur, consultez la
première page de la revue dans laquelle son article a été publié afin de trouver ses coordonnées. Si vous n’arrivez pas à les repérer, communiquez avec nous à PublicationsArchive-ArchivesPublications@nrc-cnrc.gc.ca.
Questions? Contact the NRC Publications Archive team at
PublicationsArchive-ArchivesPublications@nrc-cnrc.gc.ca. If you wish to email the authors directly, please see the first page of the publication for their contact information.
Archives des publications du CNRC
This publication could be one of several versions: author’s original, accepted manuscript or the publisher’s version. / La version de cette publication peut être l’une des suivantes : la version prépublication de l’auteur, la version acceptée du manuscrit ou la version de l’éditeur.
For the publisher’s version, please access the DOI link below./ Pour consulter la version de l’éditeur, utilisez le lien DOI ci-dessous.
https://doi.org/10.1016/S0378-3812(01)00408-3
Access and use of this website and the material on it are subject to the Terms and Conditions set forth at
Molar volume and speed of sound in the neighbourhood of the
liquid-liquid critical point of (tetrachloromethane +
tetradecafluoromethylcyclohexane)
Kumaran, M. K.
https://publications-cnrc.canada.ca/fra/droits
L’accès à ce site Web et l’utilisation de son contenu sont assujettis aux conditions présentées dans le site LISEZ CES CONDITIONS ATTENTIVEMENT AVANT D’UTILISER CE SITE WEB.
NRC Publications Record / Notice d'Archives des publications de CNRC:
https://nrc-publications.canada.ca/eng/view/object/?id=f8772202-85d2-4f34-91bc-1b0e7d138b8f https://publications-cnrc.canada.ca/fra/voir/objet/?id=f8772202-85d2-4f34-91bc-1b0e7d138b8f
(tetrachloromethane +
tetradecafluoromethylcyclohexane
Kumaran, M.K.
A version of this paper is published in / Une version de ce document se trouve dans : Fluid Phase Equilibria, v. 182, no. 1-2, 2001, pp. 313-324
www.nrc.ca/irc/ircpubs
Molar Volume and Speed of Sound in the Neighbourhood of the Liquid-liquid
Critical Point of (Tetrachloromethane + Tetradecafluoromethylcyclohexane)
Mavinkal K Kumaran
Institute for Research in Construction National Research Council of Canada Ottawa, Ontario K1A 0R6
Canada
Abstract
The universal critical exponents given by the three-dimensional Ising model and derived through renormalization group calculations accurately describe the gas-liquid critical phenomena of pure fluids and the liquid-liquid critical phenomena of binary liquid mixtures. Thus the behaviour of order parameters, such as density or molar volume, along the respective coexistence curve is well represented by the exponent β = 0.325. For a binary liquid mixture, along the critical isotherm, the critical anomaly of molar volume shall be described by the exponent (1 - α)/β = 2.74. The experimental data obtained for the full range of composition for (tetrachloromethane + tetradecafluoromethylcyclohexane) confirm this requirement.
Speed of sound, though strictly not a generalized density, should be associated with the same set of exponents that describe the behaviour of molar volume. The results on the speed of sound of (tetrachloromethane + tetradecafluoromethylcyclohexane) along the coexistence curve and along the full range of the critical isotherm generally agree with the universality concept.
1. Introduction
Three dimensional Ising model captures the details of the gas-liquid critical phenomenon shown by pure fluids and the liquid-liquid critical phenomenon shown by binary liquid mixtures [1,2]. A set of universal critical exponents, derived using renormalization group calculation, quantitatively represents the behaviour of majority of pure fluids and binary liquid mixtures, in the neighbourhood of the respective critical points. As an exception, for a while it was believed that ionic fluids might not be Ising-like asymptotically [3-5]. Although the approach to asymptotic behaviour may be somewhat different in aqueous ionic fluids, the asymptotic behaviour itself is now believed to be Ising-like and described by the same set of universal critical exponents [6]. The universal values of the critical exponents calculated by Le Guillou and Zinn-Justin [7] are as follows:
α = 0.11 β = 0.325
The scaling laws [8] have defined exact relationships between the various critical exponents; the Rushbrooke and Griffiths inequalities [9,10] have turned out to be equations. Hence the other commonly used critical exponents have been given the following values [1]:
γ = 1.24 δ = 4.81 µ = 1.26 ν = 0.63
The exponent α that describes the divergence of constant-volume heat capacity of pure fluids and the exponent β that defines the shape of coexistence curve on a generalized density – temperature plain are the subjects of this paper. For a pure fluid, the exponents γ,δ, µ and ν are associated with isothermal compressibility, critical isotherm on the pressure-volume-temperature surface, surface tension and correlation length respectively [1].
Widom and Khosla [11] have concluded that for a binary liquid mixture that shows a liquid-liquid critical phenomenon, the quantity ôVm – Vm,cô approaches the critical solution point as
ôVm – Vm,cô
∼
A1ôx - xcô + A2ôx - xcô (1 - α) / β (1) where Vm is the molar volume of the mixture at mole fraction x. The quantities Vm,c and xc are respectively the molar volume and mole fraction of the mixture at the critical solution point and A1 and A2 two proportionality constants or amplitudes, characteristic of the heterogeneous systemunder investigation. Constant pressure is implied in equation (1). Kumaran [12] has analyzed a set of experimental results obtained on the molar volume of (methylcyclohexane + tetradecafluoromethylcyclohexane) [13] in terms of equation (1) and obtained quantitative agreement. New sets of results on (tetrachloromethane + tetradecafluoromethylcyclohexane) is reported in this paper and the requirement imposed by equation (1) is reexamined.
The exponent β, as stated above, is associated with a generalized density. For the liquid-liquid critical phenomenon there are several choices for the generalized density. The (mass) density, mole fraction, molar volume and volume fraction – all are equivalent choices. A quite different choice is the speed of sound.
Speed of sound is not really a proper density: it is not of the form (X / Y) where both X and Y are extensive in the restricted sense of each being the sum of the X’s and Y’s of the constituent parts of a heterogeneous system. Still it is expected that asymptotically on approach to the critical solution point, the same two critical exponents, α and β, that describe the behaviour of Vm in the neighbourhood of the critical solution point shall describe the behaviour of speed of sound [14]. According to Van Dael [15], the speed of sound, u, of either coexisting phase will approach uc, the speed of sound of the binary mixture at the critical solution point as
ôu – uc ô
~
B1 τβ (2) where τ = ôT -Tcô / Tc and T is the temperature of the coexisting phase and Tc the critical solution temperature of the binary mixture. For a wide range of temperature, equation (2) is written as [16] ôu – uc ô = B1 τβ+
B2 τ 2β+
B3 τβ +∆+
B4 τ 1-α+ ……. (
3)
where ∆ = 0.5, the Wegner correction exponent [17]. In equations (2) and (3) the B’s are proportionality constants similar to A1 and A2.
The exponent (1 - α)/β may then describe the critical anomaly shown by speed of sound at the critical solution temperature on approach to the critical solution point as
ôu – ucô
∼
C1ôx - xcô + C2ôx - xcô (1 - α) / β(4) where C1 and C2 are two characteristic proportionality constants, similar to the A’s and B’s.
This paper also presents results from measurements on the speed of sound of (tetrachlomethane + tetradecafluoromethylcyclohexane) along the coexistence curve and at the critical solution temperature for the full composition range and analyzes those results in terms of equations (3) and (4).
2. Experimental
The tetrachloromethane (Fisher Scientific Co., certified ACS Spectroanalyzed) and tetradecafluoromethycyclohexane (Aldrich Chemical Co., Lot No. 1611KH and showed no significant impurities from a Chromatographic analysis) used in the present investigation are from the same batch as reported in an earlier investigation [18]. The densities of the materials at 298.15 K were respectively 1584.2 kg m-3 and 1787.4 kg m-3. These agree well with literature values: 1584.3 kg m-3 and 1787.0 kg m-3 respectively [19, 20]. The critical solution temperature for the mixture at atmospheric pressure was determined to be (301.91 ± 0.04) K by observing the unmixing temperature of several critical mixtures with the composition xc-C6F11CF3 = 0.286 ± 0.005 [21]. The excess molar volume of the mixture for the full composition range was determined at (301.950 ± 0.002) K, as indicated by the unmixing temperature of a critical mixture prior to those measurements, using the dilution dilatometer described by Kumaran and McGlashan [22] with an estimated accuracy better than 0.1% (An interesting feature of the excess molar volume data in the critical region is presented in the Appendix). The temperature coefficient of density for the two pure components was determined using a densimeter to be -2.801 kg m-3 K-1 for c-C6F11CF3 and -1.962 kg m-3 K-1 for CCl4.
The pulse-echo overlap method combined with a dilution technique [18,23, 24] was used to measure the speed of sound with a reproducibility of 0.02 m s-1 and an accuracy better than 0.2 m s-1 for completely miscible binary mixtures. The measurement details for compositions along the coexistence curve were reported earlier [18]. Two separate series of dilution measurements were carried out at (301.878 ± 0.002) K , as indicated by the unmixing temperature of a critical mixture prior to those measurements.
3. Results
The critical composition was assigned xc-C6F11CF3 = 0.2855 [19]. From the excess molar volume measurements, Vm,c = 128.50 cm3 mol-1. As reported earlier [18], for a critical mixture with an unmixing temperature of (301.901 ± 0.002) K, the speed of sound at the critical point was determined to be (701.21 ± 0.02) m s-1 (The frequency at which this measurements were made was not recorded). The above four values are used to derive the quantities listed in Tables 1 to 4.
Table 1. The change in the quantity ôu – uc ô with τ along that branch of the coexistence curve where xc-C6F11CF3 is > 0.2855. τ ôu – uc ô, m s-1 τ ôu – uc ô, m s-1 0.002531 40.32 0.000593 26.48 0.00206 38.41 0.000454 24.27 0.001716 36.46 0.000325 21.52 0.001418 34.62 0.000222 18.81 0.001156 32.64 0.000149 16.04 0.000951 30.68 0.000103 12.88 0.000752 28.65 5.63E-05 9.08
Table 2. The change in the quantity ôu – uc ô with τ along that branch of the coexistence curve where xc-C6F11CF3 is<0.2855. τ ôu – uc ô, m s-1 τ ôu – uc ô, m s-1 0.002806 52.1 0.000232 20.75 0.002289 48.84 0.000195 19.66 0.001984 46.19 0.000129 16.29 0.001514 41.72 9.61E-05 14.65 0.001163 37.9 7.95E-05 12.31 0.000778 32.71 6.96E-05 10.26 0.00052 27.89 2.65E-05 6.14 0.000368 24.43
Table 3. The change in the quantity ôV – Vm,c ô with ôx – xc ô along the critical isotherm where xc-C6F11CF3 is > 0.2855. ôx – xc ô ôV – Vm,c ô, cm3 mol-1 ôx – xc ô ôV – Vm,c ô, cm3 mol-1 0.0011 0.115 0.1300 13.493 0.0238 2.486 0.1647 17.045 0.0272 2.839 0.1851 19.122 0.0433 4.517 0.2700 27.646 0.0492 5.133 0.3620 36.647 0.0653 6.807 0.5613 55.196 0.1009 10.495
Table 4. The change in the quantity ôV – Vm,c ô with ôx – xc ô along the critical isotherm where xc-C6F11CF3 is < 0.2855. ôx – xc ô ôV – Vm,c ô, cm3 mol-1 ôx – xc ô ôV – Vm,c ô, cm3 mol-1 0.0147 1.534 0.1581 16.72 0.0375 3.918 0.1854 19.685 0.0626 6.553 0.2142 22.863 0.0861 9.032 0.2402 25.77 0.1134 11.927 0.2673 28.85 0.1353 14.263
The speed of sound along the critical isotherm was measured at a frequency of 2.36 MHz and from the knowledge of the critical composition, uc at that frequency is estimated to be (702.85
± 0.02) m s-1. (As reported earlier, the frequency used has a measurable effect on the speed of sound [18].) This value is used to derive the quantities listed in Tables 5 and 6.
Table 5. The change in the quantity ôu – uc ô with ôx – xc ô along the critical isotherm where xc-C6F11CF3 is > 0.2855. ôx – xc ô ôu – uc ô, m s-1 ôx – xc ô ôu – uc ô, m s-1 0.0218 18.5 0.2034 71.0 0.0421 25.8 0.2546 81.8 0.0622 33.2 0.3112 91.5 0.0779 38.2 0.3700 100.0 0.0954 43.5 0.4398 115.7 0.1140 48.9 0.5132 122.6 0.1350 54.9 0.6018 128.8 0.1584 60.8 0.7145 134.2
Table 6. The change in the quantity ôu – uc ô with ôx – xc ô along the critical isotherm where xc-C6F11CF3 is < 0.2855. ôx – xc ô ôu – uc ô, m s-1 ôx – xc ô ôu – uc ô, m s-1 0.0232 9.2 0.1846 97.6 0.0417 24.0 0.2078 122.1 0.0810 30.1 0.2325 145.6 0.1101 47.7 0.2568 171.0 0.1361 64.9 0.2806 198.3 0.1623 84.0 0.2855 204.2
4. Analysis in terms of universality
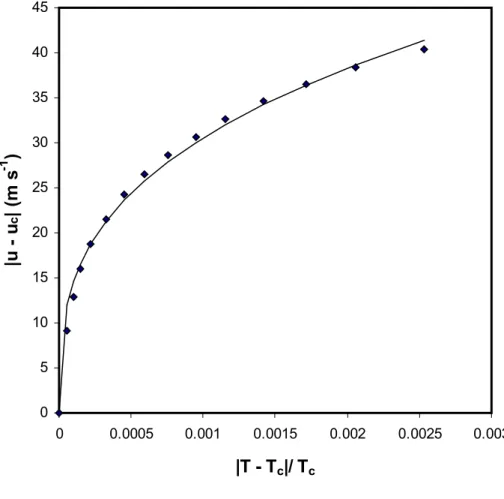
Figure 1 shows the speed of sound data in Table 1 expressed in terms of the limiting relation given by equation (2). The statistics of the curve fit show a systematic and not a random scatter. The standard deviation is 1.04 m s-1 and is much higher than the estimated precision of 0.2 m s-1. The low value of the overall correlation factor r2 = 0.992 for the curve fit is not justifiable. Therefore, in subsequent analyses equation (3) was used with successively adding the second, third and fourth terms. The statistics are given in Table 7.
Table 7. The influences of the second, third and fourth terms in equation (3) in accounting for the critical behaviour of speed of sound as given in Table 1.
Terms used from equation (3) r2 (95 % confidence limits) Standard deviation, m s-1
First 0.992 1.04
First and second 0.992 1.07
First, second and third 0.998 0.52
All terms 0.9996 0.26
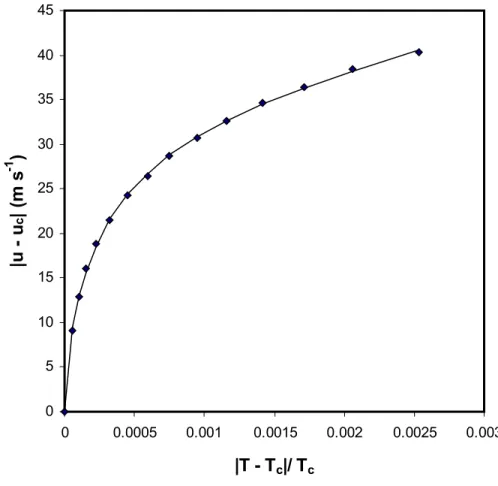
As shown in Table 7 and Figure 2, inclusion of all the terms given by equation (3) for the analyses gives a representation of the data in Table 1 within the limits of the experimental uncertainty. Van Dael [25] had already shown that the higher terms in equation (3) are not negligible even for τ = 2 x 10⁻⁴. The results from Table 2 also follow the same behaviour, though the r2 is only 0.999 (when all the terms are included) and the standard deviation of 0.62 is higher than the experimental uncertainty.
The molar volume data in Tables 3 and 4 were analyzed in terms of equation (1) and the following statistics show that the data give an excellent fit to the equation, well within the limits of the experimental uncertainty. For the results in Table 1: r2 = 0.999998 with a standard deviation = 0.02 cm3 mol-1 and for the results in Table 4: r2 = 0.9999998 with a standard deviation = 0.005
cm3 mol-1. For confirmation, a linear fit to the results in Table 3 gave the following statistics: r2 = 0.9992 and standard deviation = 0.46 cm3 mol-1 and both do not justify the results.
Figure 1. The speed of sound data in Table 1 expressed in terms of equation (2). The points are the experimental data and the continuous curve is obtained from equation (2): B1 = 288.46 m s-1.
0 5 10 15 20 25 30 35 40 45 0 0.0005 0.001 0.0015 0.002 0.0025 0.003
|T - T
c|/ T
c|u - u
c| (m s
-1)
Figure 2. The speed of sound data in Table 1 expressed in terms of equation (3). The points are the experimental data and the continuous curve is obtained from equation (3): B1 = -216.4 m s-1, B2 = 31541 m s-1, B3 = -243256 m s-1, B4 = 241095 m s-1. 0 5 10 15 20 25 30 35 40 45 0 0.0005 0.001 0.0015 0.002 0.0025 0.003
|T - T
c|/ T
c|u - u
c| (m s
-1)
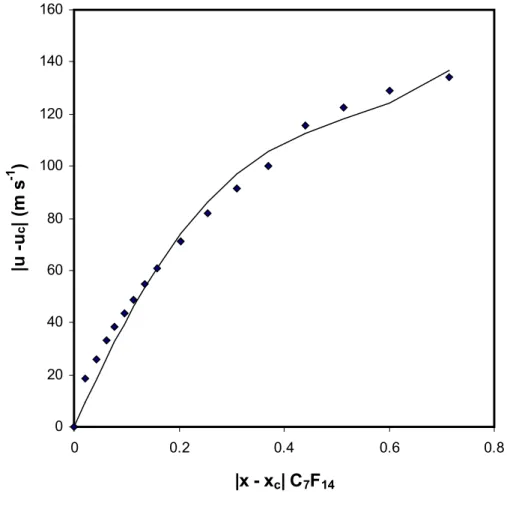
Figures 3 and 4 show the speed of sound data in Tables 5 and 6 analyzed in terms of equation (4). The statistics of the analysis are the following - for Table 5 results: r2 = 0.959 with a standard deviation = 8.7 m s-1 and for Table 6 results: r2 = 0.998 with a standard deviation = 2.9 m s-1. Figure 4 shows that the results in Table 6 are reasonably well represented by equation (4) whereas Figure 3 shows that those in Table 5 are only poorly represented. The latter covers a much broader range in x: from 0.2855 to 1 while the former covers the shorter range from 0 to 0.2855. Therefore the next term was introduced as, C3ôx - xcô1 / β
in equation (4) and the results in Table 5 were reanalyzed. The statistics were r2 = 0.985 with a standard deviation = 5.3 m s-1, a significant improvement over equation (4), but still inadequate to represent the experimental data. The results of this analysis are shown in Figure 5.
Figure 3. The speed of sound data in Table 5 expressed in terms of equation (4). The points are the experimental data and the continuous curve is obtained from equation (4): C1 = 351 m s-1, C2 = -314 m s-1. 0 20 40 60 80 100 120 140 160 0 0.2 0.4 0.6 0.8
|x - x
c| C
7F
14|u -u
c| (m s
-1)
Figure 4. The speed of sound data in Table 6 expressed in terms of equation (4). The points are the experimental data and the continuous curve is obtained from equation (4): C1 = 386.8 m s-1, C2 = 2940 m s-1. 0 50 100 150 200 250 0 0.05 0.1 0.15 0.2 0.25 0.3
|x - x
c| C
7F
14|u -u
c| (m s
-1)
Figure 5. The speed of sound data in Table 5 expressed in terms of equation (4) adding the next term in the scaled equation; the points are the experimental data and the continuous curve is obtained from equation (4) with the additional term.
5. Concluding remarks
The analyses presented above show that the liquid-liquid critical phenomenon of (tetrachloromethane + tetradecafluoromethycyclohexane) belongs to the universality class of the 3D Ising model. The universal set of critical exponents quantitatively describes the behaviour of molar volume. Speed of sound can not be regarded as an order parameter equivalent to molar volume because terms other than the lead term may be necessary, even very close to the critical
0 20 40 60 80 100 120 140 160 0 0.2 0.4 0.6 0.8
|x - x
c| C
7F
14|u -u
c| (m s
-1)
point, for a proper representation of its behaviour. Appropriate higher terms may be introduced for this purpose.
Indeed the results presented here do not contradict the universality concept. Neither do they rigorously prove the concept. For example, the value of A1 in equation (1) can be directly determined from the dilution measurements as (104.2 ± 0.2) cm3 mol-1. With this value, (1-α)/β = 2.61 ± 0.02 perfectly represents the experimental results on the larger branch of the isotherm. The Ising value for (1-α)/β is 2.74. Therefore direct determination of the critical exponents from experimental data on real systems continues to be rather challenging.
6. Acknowledgement
The author gratefully acknowledges helpful communications related to this work with Prof. B. Widom and Dr. J. M. H. Levelt Sengers.
7. Nomenclature
A, B, C Proportionality constants or Amplitudes in equations (1) to (4)
c Critical (subscript)
m Molar (subscript)
r2 Overall correlation coefficient for a least-squares fit T Temperature u Speed of sound V Volume x Mole fraction α, β, γ, δ, µ, ν Critical exponents τ Reduced temperature
Appendix:
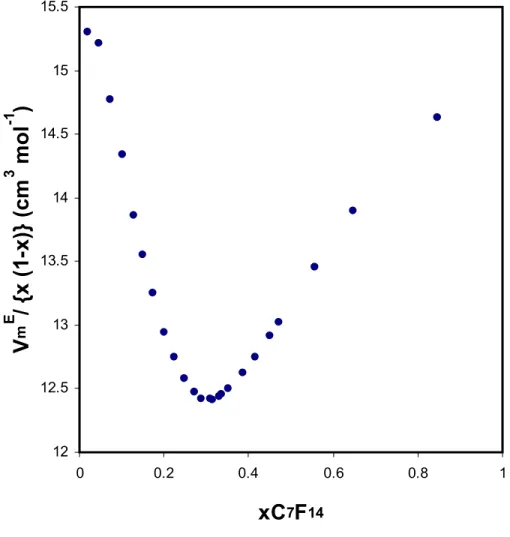
The second derivative of excess molar volume with respect to mole fraction vanishes at the critical solution points of binary liquid mixtures [13,26]. This makes the critical isotherm of excess molar volume nearly linear for a measurable range of mole fraction, about the critical composition. This in turn probably results in the behaviour of the quantity VmE/x1x2 shown in Figure A1: there is a clear minimum at the critical composition of CCl4 + C7F14. Similar behaviour is found with methylcyclohexane + tetradecafluoromethylcyclohexane [13]. As shown in Figure A2, all three types of isotherms- critical, supercritical and sub-critical - have a minimum at the critical composition.
Figure A1. Excess molar volume of tetrachloromethane + tetradecafluoromethylcyclohexane at the critical solution temperature; the quantity VmE/x1x2 shows a clear minimum at the critical composition. 12 12.5 13 13.5 14 14.5 15 15.5 0 0.2 0.4 0.6 0.8 1
xC
7F
14V
m E/ {
x
(1-x)}
(cm
3mol
-1)
Figure A2. Excess molar volume of methylcyclohexane + tetradecafluoromethylcyclohexane at three different temperatures; the quantity VmE/x1x2 shows a clear minimum at the critical composition for the supercritical, the critical and the sub-critical isotherms.
15
16
17
18
19
20
21
22
23
24
25
0
0.2
0.4
0.6
0.8
1
xC
7F
14V
m E/ {
x
(1-x)}
(cm
3mol
-1)
References
[1] B. Widom, J. Phys. Chem. 100 (1996) 13190.
[2] R. L. Scott, Chem. Soc. Specialist Periodical Report, Vol. 2, chap. 8 (1978) [3] J. M. H. Levelt Sengers, J. A. Given, Molecular Physics 80, 4 (1993) 899. [4] M. E. Fisher, J. Phys.: Condens. Matter 8 (1996) 9103.
[5] T. Narayanan and K. S. Pitzer, J. Chem. Phys. 102, 20 (1995) 8118.
[6] M. A. Anisimov, A. A. Povodyrev, J. V. Sengers, Fluid Phase Equilibria 158-160 (1999) 537. [7] J. C. Le Guillou, Zinn-Justin, J. Phys. Rev. B21 (1980) 3976.
[8] B. Widom, J. Chem. Phys. 43 (1965) 3898. [9] G. S. Rushbrooke, J. Chem. Phys. 39 (1963) 842. [10] R. B. Griffiths, J. Chem. Phys. 43 (1965) 1958.
[11] B. Widom, P. Khosla, J. Chem. Soc. Faraday I, 76 (1980) 2043. [12] M. K. Kumaran, J. Chem. Thermodynamics, 13 (1981) 789. [13] M. K. Kumaran, M. L. McGlashan, Aust. J. Chem. 33 (1980) 1909. [14] B. Widom, Private Communication, 1983.
[15] W. Van Dael, Experimental Thermodynamics, Vol. II, Experimental Thermodynamics of Nonreacting Fluids, chap. 11 (1975)
[16] W. Van Dael, P. Mijlemans, Proceedings 8th Symposium on Thermophysical Properties, Vol. I (1982) [17] F. J. Wegner, J. Phys. Rev. B5 (1972) 4529.
[18] M. K. Kumaran, C. J. Halpin, G. C. Benson, J. Chem. Thermodynamics, 15 (1983) 1071.
[19] Selected Values of Properties of Chemical Compounds, Thermodynamics Research Centre: Texas A & M University, College Station, Texas, Table 23-10-2-(4.011)-a 30 June 1957.
[20] J. S. Rowlinson, R. Thacker, Trans. Faraday Soc. 53 (1957) 1. [21] D. R. Thompson, O. K. Rice, J. Am. Chem. Soc. 86 (1964) 3547.
[22] M. K. Kumaran, M. L. McGlashan, J. Chem. Thermodynamics, 9 (1977) 259. [23] O. Kiyohara, J. -P.E. Grolier, G. C. Benson, Can. J. Chem. 52 (1974) 2287. [24] O. Kiyohara, C. J. Halpin, G. C. Benson, Can. J. Chem. 55 (1977) 3544.
[25] W. Van Dael, IUPAC Conference on Chemical Thermodynamics, Section 3-Critical State (1982) [26] W. J. Gaw, R. L. Scott, J. Chem. Thermodynamics, 3 (1971) 335.