HAL Id: hal-01445512
https://hal.archives-ouvertes.fr/hal-01445512
Submitted on 25 Jan 2017HAL is a multi-disciplinary open access archive for the deposit and dissemination of sci-entific research documents, whether they are pub-lished or not. The documents may come from teaching and research institutions in France or abroad, or from public or private research centers.
L’archive ouverte pluridisciplinaire HAL, est destinée au dépôt et à la diffusion de documents scientifiques de niveau recherche, publiés ou non, émanant des établissements d’enseignement et de recherche français ou étrangers, des laboratoires publics ou privés.
Towards a Better Understanding of Cities Using
Mobility Data
Maxime Lenormand, José Ramasco
To cite this version:
Maxime Lenormand, José Ramasco. Towards a Better Understanding of Cities Us-ing Mobility Data. Built Environment, Alexandrine Press, 2016, 42 (3), pp.356-364. �http://dx.doi.org/10.2148/benv.42.3.356�. �hal-01445512�
1
Towards a Better Understanding of Cities Using
Mobility Data
Maxime Lenormand
1and José J. Ramasco
21
Irstea, UMR TETIS, 500 rue François Breton, FR-34093 Montpellier, France
2
Instituto de Física Interdisciplinar y Sistemas Complejos IFISC (CSIC-UIB), Campus Universitat de les Illes Balears, E-07122 Palma de Mallorca, Spain
[email protected] [email protected]
Abstract
The increasing concentration of people in cities generates many problem of control in the management of resources and urban space. Urban sprawl, for example, generates serious environmental, social and economic challenges that pertain to congestion, increasing transport costs, and segregated urban environments. Making cities “smarter” has the potential to provide a solution for handling more efficiently new sources of digital information, to gain a better understanding of urban dynamics and human mobility and last but not least, to search for more sustainable living conditions. In this context, the increasing availability of geolocated data generated by the use of information and communication technologies (ICT) provide new tools to analyse activity and mobility patterns in urban environments. In this paper, we present an overview of recent findings in empirical applications of such ‘big data’ to the systematic study of cities and their problems of movement. The paper concludes with a discussion on the potential of this new source of data and on how the coupling of big data analysis and computer modelling can open new horizons for the analysis of urban systems.
2
Introduction
According to the World Health Organization (United Nations, 2014), 54% of the global population presently lives in cities. This fraction has notably increased from the 34% registered back in 1960. The growth of population in urban environments puts a heavy strain on the resources but also on the capacity of planners and local authorities to improve living standards. Indeed, urban sprawl and the consumption of land that it generates pose many social, environmental and economic problems that in the light of our current usage of fossil fuels, is unsustainable. Urban sprawl contributes to global warming by increasing mobility, it reinforces social segregation, and it imposes enormous costs from the development of new infrastructure (roads, schools, waste collection, and so on). These issues raise many questions concerning the definition of the “sustainable city” which embody the principles of sustainable development and ecological urbanism.
The advent of new information and communication technologies (ICT) can help us tackle these questions by allowing real-time monitoring of the current situation across different cities, a akin to our thinking of the city as a nervous system in a living organism. This new perception is powerful in letting us put together new capabilities to process and analyse information, which highlights the possible interactions and feedback loops between citizens’ actions and locations. This has led to a new focus on mobility through the framework that we now call the Smart Cities movement. The widespread use of geolocated devices have contributed with an even stronger impulse to this direction, since new digital data coming from these devices makes it possible for us to measure the concentration, opinions and demands of a large part of the population in real time.
The study of cities has followed long tradition in urbanism, architecture, economics, geography, engineering and the social sciences. The difference now is that the convergence of these disciplines with complex systems and computer sciences together with new analogies and metaphors with the way physical systems are treated statistically brings a new opportunity for developing and testing theories regarding urban systems at unprecedented scale in the so-called Science of Cities (Batty, 2013). Moving from the study of individuals to world-city behaviours, this paper presents some applications of new digital data from ICT data to the systematic study of urban problems and their solutions with a particular focus on aiming at a better understanding of human mobility and city structure and function. It also introduces a reflection on the role and potential of big data as well as the biases that it can generate. We finally discuss the importance of coupling such data analysis to simulation in the understanding of urban dynamics.
3
Human Mobility and the City
Every second1, an increasing amount of geolocated data is generated by the use of ICT devices and tools such as mobile phones, GPS, public transport cards or credit cards. Therefore, this ICT data reflects the way people “interact” with the city and between each other. Indeed, geolocated data enables the identification of when and where people are using ICT devices, bringing the possibility of partially recovering the spatio-temporal trajectories of individuals within cities. Moreover, beyond geographical positioning, some datasets offer the possibility of gathering information about the user’s demography in terms of their social and economic characteristics and the type and duration of the interaction or the operation using such ICT tools.
In statistical physics, measures such as jump length distribution and radius of gyration have been widely studied in order to better understand human trajectories. For example, Brockmann et al., 2006 and Gonzalez et al., 2008 used Web site reporting and mobile phone datasets to investigate how people move in their daily life showing that human trajectories exhibit a high degree of temporal and spatial regularity. The characterization of human trajectories is also useful in studying how people interact within the city according to where they live (place of residence) and who they are (i.e. their sociodemographic characteristics). Lotero et al. (2014) show that the socioeconomic characteristics of the population have a strong impact on human mobility using the city of Bogotá (Colombia). In particular, the authors observed an opposition of poor and rich with the lowest-income individuals tending to cover a large fraction of the urban area in a sparse way using cheap transportation modes and the highest-income individuals using costly transport modes to cover a small and highly connected fraction of the urban area. In the same way, we (Lenormand et al., 2015a) found that mobility patterns vary according to gender, age and occupation by analysing credit-card records from Barcelona and Madrid. Women, older people and inactive individuals tended to travel shorter distances and stay closer to their home than men, young individuals and inactive people as we show in Figure 1a. We can also observe in this figure that people move differently according to the purpose of their travel. Therefore, large datasets of human activity are of the utmost importance to quantify the influence of socioeconomic heterogeneity with respect to the way residents perceive their city.
New data sources make it possible not only to characterize who the residents of a city are and how residents behave in their day-to-day lives, but also to track the inflows and outflows of visitors, what their activities are and how they interact with and affect the local community. It is thus possible to use this new source of data to study visitors’ duration of stay (Poletto et al., 2012) but also the spatio-temporal distribution of
1
Estimates vary but it is suggested that Facebook is the most active social media currently generating more than 4 million posts per minute: http://wersm.com/how-much-data-is-generated-every-minute-on-social-media/
4
individuals according to their nationality (Bajardi et al., 2015). This new source of information can help policy makers to understand and predict tourists’ activity and travel patterns in a more efficient way. The impact of traffic disruptions or major events such as concerts and sports competitions can be measured, and the results of local and state government interventions and policies can be observed in real time so that appropriate additional measures can be planned and executed.
Finally, another important aspect of the analysis of human mobility behaviour from ICT-based data sources is the study of online social networks. It is possible to know from geo-located data records where and when an individual makes a call or tweet, but sometimes information such as the ID of the caller/callee for mobile data or the followee/follower for Twitter data as well as information regarding the number of interactions or the call duration are also available. This information gives researchers an opportunity to study in more detail human behaviours by analysing the structure, intensity and spatial properties of social interactions. Thus, social relations can be mapped to investigate in detail the interaction between social relations, location and mobility (Grabowicz et al., 2014; Picornell et al., 2015 ; Toole et al., 2015). It is thus possible to examine the relationship between travel behaviour and social networks using ICT data such as mobile phone or Twitter data. For example, we (Picornell et al., 2015) focused on the analysis of the characteristics of the locations shared by social contacts in Spain using mobile phone records, aiming to understand and quantify why and to what degree those locations are shared. The results show that the mobility of individuals sharing the same social network is more similar than the one of two strangers. Moreover, as it can be seen in Figure 1b, a strong correlation between the intensity of the social link between two individuals and the number of shared locations in common is observed.
Figure 1. (a) Average distance between individuals’ residence and business according to sociodemographics and business category. Distances are expressed in kilometre and are computed using the Haversine distance between the latitude and longitude coordinate of the centroid of the postcode of residence and the business’ latitude and longitude coordinates for
5
each transaction (based on 24,920,896 transactions made in the province of Madrid in 2011). (b) Correlation between the average number of phone calls between two users and the number of frequent positions in common (based on 1,878,454 mobile phone users in Spain in September/October 2009).
From Human Mobility to City Structure and Function
These new capabilities for registering human activity have also brought a fresh view on how cities and territories evolve, allowing researchers to address issues such as city structure (Lenormand et al., 2014a; Louail et al., 2014; Louail et al., 2015), road and long range train traffic (Lenormand et al., 2014b), the spatial organization of land use (Lenormand et al., 2015c) and the systematic comparison of urban areas of different sizes and in different countries around the globe (Bettencourt et al., 2007; Batty, 2008; Bettencourt, 2013; Batty, 2013; Lenormand et al., 2015b).
Figure 2. Mobile Phone Usage in Barcelona. (a) Spatial distribution of the average number of mobile phone users in the metropolitan area of Barcelona on Mondays between 9am and 10am. (b) Geographical location of land use types identified with mobile phone data for the metropolitan area of Barcelona. In red, Residential; In blue, Business; In cyan, Logistics; And in orange, Nightlife.
The relevant ICT data enables us to extract many types of description of individual mobility patterns. These individual spatio-temporal trajectories can be spatially and temporally aggregated in order to estimate the average number of individuals at a given time in a particular area of the city. Different geographical area definitions and time windows can be used, with the smallest scale mostly constrained by the quality and the type of data available. Such spatio-temporal aggregations enable the analysis of how the spatial distribution of users evolves over time and also how the temporal distribution of users changes over space. In the first case, for example, we (Louail et
6
al., 2014) aggregated mobile phone data to identify hotspots, areas of the city where
people are concentrated as we show in Figure 2a, and then observe how the spatial distribution of hotspots changes over time allowing us to understand how cities “breath”. In that work, we defined various indices that helped us to characterize some of the dynamical morphological properties of cities speculating that these exhibit the existence of a single “urban rhythm” common to all cities. In the second case, the aggregated data can be used to identify the type of activity that is most common in specific urban areas. Indeed, observing when it is most likely to find an individual in an area allow us to characterize this area in term of land use (Lenormand et al., 2015c). For example, an area where the probability to find a user is higher during weekdays evenings and weekends can be defined as residential. On the contrary, an area where people are mostly using their cell phone between 9am and 7pm on weekdays is probably a business/office/retail area as implied in Figure 2b. In Lenormand et al. (2015), four major land use types were detected using mobile phone data that correspond to different temporal patterns (Residential, Business, Logistic/Industry and Nightlife) exhibiting strong similarity between Spanish cities in terms of spatial organization and scaling.
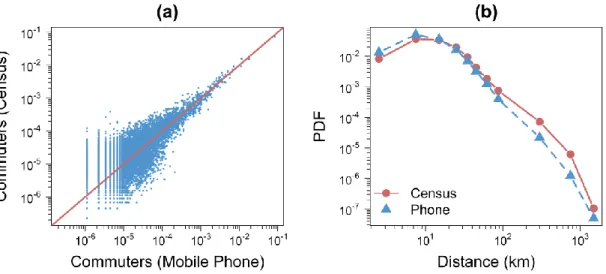
From a dynamical perspective, individual spatio-temporal trajectories generated by the use of ICT data can be condensed to extract origin-destination (OD) trip matrices. We can, for example, consider that a user performs a trip when two consecutive records provide different locations. However, it is important to keep in mind that, depending on the data source, the estimation of individual trajectories can be more or less accurate. Indeed, the geographical position of an individual is usually revealed only when he or she interacts with an ICT device and therefore this type of data suffers a problem of missing information. This means that only a part of the trajectory is recovered. There exist, however, different methods to assess the validity of a trip and to recover significant results from the data. These methods are usually based on the time elapsed between two consecutive locations. These OD trip matrices can then be used, for instance, to capture the dynamical urban travel demands at different scales in specific time windows and to detect urban traffic congestion (Wang et al., 2014). Another possibility is to consider the locations most frequented by an individual during his/her daily life trajectory in order to extract motifs (Schneider et al., 2013) and origin-destination matrices of commuting and migration flows (Isaacman et al., 2011). The most frequented place of a user in the late afternoon and early morning can be identified as his/her place of residence, while the most frequented area during working hours can be assigned as his/her work place. This simple technique allows the accurate determination of mobility flows at intermediate geographical scales (Lenormand et al., 2014a). Figure 3 displays a comparison between OD matrices of commuting flows between Spain's municipalities extracted from the Spanish Census of 2001 and cell phone records collected in 2009. It is interesting to note that the two matrices are very similar but one can observe that the origin-destination table
7
extracted from the cell phone records underestimates the proportion of long-distance commuters (commuting distance higher than 100 km). However, this is not a major issue since these long-distance commuters represent a small fraction of the total number of commuters and they are probably not daily commuters. The OD matrices can be used to study the spatial structure of mobility networks at the urban scale (Louail et al., 2015).
Figure 3. Comparison of the origin-destination tables between Spanish municipalities extracted from the Spain's Population Census of 2011 and cell phone records collected during the period September-November 2009. (a) Comparison between the non-zero flows (the values have been normalized by the total number of commuters for both origin-destination tables); Blue points are the scatter plot for each pair of units; The red line represents the x=y line. (b) Commuting distance distribution obtained with both datasets. We only consider individuals living and working in two different municipalities. The red circles represent the Census data and the blue triangles the mobile phone data.
Systems of Cities
To paraphrase Berry (1964), cities can be seen as systems within systems of cities. Living in an increasingly complex, connected world, this statement has never been truer than it is today. Socio-economic relationships between cities have been widely studied during the past few decades but mainly at a regional scale or between a few world-cities linked with undirected information whether they share a common resource or interchange goods or people.
The worldwide scale adoption of social networking sites such as Twitter, Foursquare and Flickr offers the possibility of studying socio-economic relationships between different areas of the world across different temporal and spatial scales in an unprecedented comprehensive manner. For example, Twitter data has been used to study mobility between countries (Hawelka et al., 2014) and city-city interactions
8
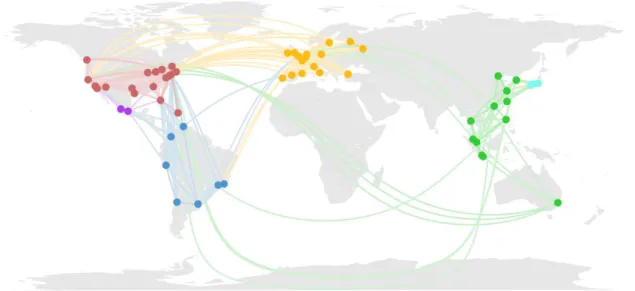
based on mobility flows (Lenormand et al., 2015b). We can also exploit Twitter data to perform analyses that were barely imaginable ten years ago as, for instance, in measuring quantitatively world-city and city-world interactions (Lenormand et al., 2015b). This research was designed to help us gain a better understanding of the relations and competition between world cities leading to the emergence of a hierarchy (Christaller, 1966). To this end, we have analysed a Twitter database containing 20 million geo-located tweets worldwide to quantify and compare the influence areas and the attractiveness of 58 world cities. More specifically, the urban areas are ranked according to the area covered and the radius travelled by the users after visiting each city. Rome, Paris and Lisbon appear consistently as the cities attracting most diverse visitors. The influence of cities measured in this way includes their impact on the whole world and not only on other urban areas, which has been the common way of studying this issue in recent works. However, it is worth noting that results obtained in previous analysis based on city-city interactions can be recover by building a local Twitter users’ mobility network between the 58 world cities (Figure 4). This network provides the basis for a more traditional centrality analysis, in which we recover London and New York as the most central cities at a global scale. Moreover, the world city network can be divided into communities or areas of influence, in which the centrality is studied locally in order to obtain a regional perspective that induces a new ranking of cities. The comparison between the rankings brings about important information on the roles played by the cities at the global and regional scales.
Figure 4. Mobility network. Local Twitter users’ mobility network between 58 world cities. Only the flows representing the top 95% of the total flow have been plotted.
9
As mentioned previously, one can use geo-located ICT data to gather information such as user’s place of work and residence or their duration of stays in a given place, but it is sometimes possible to access the content of the “post” such as the text message in Twitter. One can, for example, identify the language in which the tweet is written and map the distribution of languages at a world scale (Mocanu et al., 2013) or characterize dialects on a global scale (Gonçalves and Sánchez, 2014).
Discussion and Conclusion
We presented here a selection of recent advances in the understanding of cities using new data sources brought about by the rise of big data. This is by no means a systematic or comprehensive collection of these ideas, but it is enough to provide the reader with an overview of the potential of such data generated by the use of ICTs. These new data sources are far from being perfect; they may suffer from socio-economic and demographic bias and observing the World through the lens of ICT data can lead to possible distortions, but compared to more traditional data sources such as the Population Census data or one-off surveys, they have the advantage of a very large size of samples (millions of observations) with a high spatio-temporal resolution. They also offer the possibility for collecting real-time data and studying inter- and intra-urban dynamics in an unprecedented level of detail. The main disadvantage of ICT data is the lack of information about users’ sociodemographic characteristics leading to unrepresentative sample biases. Except for a few cases (Lenormand et al., 2015a), it is particularly complicated to assess the representativeness of a sample in terms of age, gender or occupation. The next step in big data analysis will be to develop statistical methods and tools to measure and ensure sample representativeness by inferring users’ characteristics while preserving individual privacy. It is also worth noting that despite the biases, ICT data are generally automatically and passively collected which can prevent survey biases such as those generated from response and non-response effects.
ICT data and data coming from more traditional data sources are complementary and need to be systematically compared as has already been done in the recent literature (Schneider et al., 2013; Tizzoni et al., 2014; Lenormand et al., 2014a; Deville et al., 2014). Remarkably, the agreement between the different data sources is generally very high, and, as mentioned several times here, geolocalized ICT data are often gathered at a high spatio-temporal level of detail, offering the possibility of studying more thoroughly the influence of scale on the results than with traditional datasets. People do not tweet in the way they make phone call or use their credit cards, and the data are not always geolocalized, so it is important to crosscheck information and to choose the appropriate data sources according to the purpose and the needs of the study. For example, mobile phone data are more representative than Twitter data but they are usually geographically and temporally more constrained.
10
To conclude, big data analysis is of prime importance to extract information from huge datasets in order to better understand the properties of the urban system, but we also need to develop models to explain these properties and try to understand/predict the future by testing different possible scenarios. In this sense, it is crucial to couple data analysis and complex modelling for the understanding of complex systems, and, more particularly, for making progress in urban dynamics. Beyond big data and ICT data, more and more local authorities are sharing their data through open data portals, as well as through collaborative projects such as OpenStreetMap. All these new sources of data are a valuable support for the parameterization, the calibration and the evaluation of new kinds of simulations such as agent-based models relevant to the study cities.
The rise of big data brings unprecedented opportunities in the social sciences but they come along with large theoretical and methodological challenges. Dealing with this new type of data calls for interdisciplinary approaches involving the collaboration of social, computational and natural scientists.
Acknowledgements
Partial financial support has been received from the Spanish Ministry of Economy (MINECO) and FEDER (EU) under project ESOTECOS (FIS2015-63628-C2-2-R), and from the EU Commission through project INSIGHT. JJR acknowledges funding from the Ramón y Cajal program of MINECO.
References
Bajardi, P., Delfino, M., Panisson, A., Petri, G. and Tizzoni, M. (2015) Unveiling patterns of international communities in a global city using mobile phone data. EPJ Data Science
4, 1-17.
Batty, M. (2008) The Size, Scale, and Shape of Cities. Science 319, 769-771. Batty, M. (2013) The New Science of Cities. Cambridge, MA: The MIT Press.
Berry, B. (1964) Cities as Systems within Systems of Cities. Papers of Regional Science
Association 13, 147-163.
Bettencourt, L. (2013) The Origins of Scaling in Cities. Science 340, 1438-1441.
Bettencourt, L., Lobo, J., Helbing, D., Kuhnert, C. and West, G. (2007) Growth, innovation, scaling, and the pace of life in cities. Proc. Natl. Acad. Sci. U.S.A. 104, 7301-7306.
11
Brockmann, D., Hufnagel, L. and Geisel, T. (2006) The scaling laws of human travel.
Nature 439, 462-465.
Christaller, W. (1966) Die Zentralen Orte in Süddeutschland: eine Ökonomisch-Geographische Untersuchung Über die Gesetz Massigkeit der Verbreitung und Entwicklung der Siedlungen mit Städtischen Funktionen, Fischer Verlag, Jena (1933). (English translation: Christaller W, Baskin CW. Central places in Southern Germany, Prentice Hall, Englewood Cliffs, NJ).
Deville, P., Linard, C., Martin, S., Gilbert, M., Stevens, F. R., Gaughan, A. E., Blondel, V. D. and Tatem, A. J. (2014) Dynamic population mapping using mobile phone data.
Proceedings of the National Academy of Sciences, 111, 15888-15893.
Gonçalves, B. and Sánchez, D. (2014) Crowdsourcing dialect characterization through Twitter. PLoS One 9, e112074.
González, M.C., Hidalgo, C.A. and Barabasi, A.-L. (2008) Understanding individual human mobility patterns. Nature 453, pp. 779-782.
Grabowicz, P.A., Ramasco, J.J., Gonçalves, B. and Eguiluz, V.M. (2014) Entangling Mobility and Interactions in Social Media. PLoS ONE 9, e92196.
Hawelka, B., Sitko, I., Beinat, E., Sobolevsky, S., Kazakopoulos, P. and Ratti, C. (2014) Geo-located twitter as a proxy for global mobility patterns. Cartography and
Geographic Information Science 41, 260-271.
Isaacman, S., Becker, R., Caceres, R., Kobourov, S., Martonosi, M., Rowland, J. and Varshavsky, A. (2011) Identifying important places in people’s lives from cellular network data. In Proceedings International Conference on Pervasive Computing, San Francisco, pp 133-151.
Lenormand, M., Louail, T., Garcia Cantu, O., Picornell, M., Herranz, R., Murillo Arias, J., Barthelemy, M., San Miguel, M. and Ramasco, J.J. (2015a) Influence of sociodemographic characteristics on human mobility. Scientific Reports 5, 10075. Lenormand, M., Picornell, M., Garcia Cantu, O., Tugores, A., Louail, T., Herranz, R., Barthelemy, M., Frias-Martinez, E. and Ramasco, J.J. (2014a) Cross-checking different source of mobility information. PLoS ONE 9, e105184.
Lenormand, M., Picornell, M., Garcia Cantu, O., Tugores, A., Louail, T., Herranz, R., Barthelemy, M., Frias-Martinez, E, San Miguel, M. and Ramasco, J.J. (2015c) Comparing and modelling land use organization in cities. Royal Society Open Science 2, 150459. Lenormand, M., Tugores, A., Colet, P. and Ramasco, J.J. (2014b) Tweets on the road.
12
Lenormand, M., Tugores, A., Gonçalves, B. and Ramasco, J.J. (2015b) Human diffusion and city influence. Journal of The Royal Society Interface 12, 20150473 .
Lotero, L., Cardillo, A., Hurtado, R., Gomez-Gardenes, J. (2014) Several Multiplexes in the Same City: The Role of Socioeconomic Differences in Urban Mobility.
Interconnected Networks, Springer International Publishing, 149-164.
Louail, T., Lenormand, M., Garcia-Cantu, O., Picornell, M., Herranz, R., Frias-Martinez, E., Ramasco, J.J. and Barthelemy, M. (2014) From mobile phone data to the spatial structure of cities. Scientific Reports 4, 5276.
Louail, T., Lenormand, M., Garcia-Cantu, O., Picornell, M., Herranz, R., Frias-Martinez, E., Ramasco, J.J. and Barthelemy, M. (2015) Uncovering the spatial structure of mobility networks. Nature Communications 6, 6007.
Mocanu, D., Baronchelli, A., Perra, N., Gonçalves, B. and Vespignani, A. (2013) The Twitter of Babel: Mapping World Languages through Microblogging Platforms. PLoS
One 8, e61981.
Picornell, M., Ruiz, T., Lenormand, M., Ramasco, J.J. , Dubernet, T. and Frías-Martínez, E. (2015). Exploring the potential of phone call data to characterize the relationship between social network and travel behaviour. Transportation 42, 647-668.
Poletto, C., Tizzoni, M. and Colizza, V. (2012) Heterogeneous length of stay of hosts’ movements and spatial epidemic spread. Scientific Reports 2, 476.
Schneider, C.M., Belik, V., Couronné, T., Smoreda, Z. and González, M. C. (2013) Unravelling daily human mobility motifs. Journal of The Royal Society Interface 10, 20130246.
Tizzoni, M., Bajardi, P., Decuyper, A., Kon Kam King, G., Schneider, C.M., Blondel, V., Smoreda, Z., González, M.C. and Colizza, V. (2014) On the use of human mobility proxy for the modelling of epidemics. PLoS Computational Biology 10, e1003716.
Toole, J. L., Herrera-Yaqüe, C., Schneider, C. M. and González, M. C. (2015) Coupling mobility and social ties. Journal of The Royal Society Interface 12, 20141128.
United Nations, Department of Economic and Social Affairs, Population Division (2014). World Urbanization Prospects: The 2014 Revision, Highlights (ST/ESA/SER.A/352). Wang, J., Wei, D., He, K., Gong, H. and Wang, P. (2014) Encapsulating Urban Traffic Rhythms into Road Networks. Scientific Reports 4, 4141.