ANALYSIS OF IN-CORE EXPERIMENT ACTIVITIES FOR THE MIT RESEARCH
REACTOR USING THE ORIGEN COMPUTER CODE
By
Edward M. Helvenston
SUBMITTED TO THE DEPARTMENT OF NUCLEAR SCIENCE
AND ENGINEERING
IN PARTIAL FULFILLMENT OF THE REQUIREMENTS FOR THE DEGREE OF
BACHELOR OF SCIENCE IN NUCLEAR SCIENCE AND ENGINEERING
AT THE
MASSACHUSETTS INSTITUTE OF TECHNOLOGY
JUNE 2006
@ 2006 Edward M. Helvenston. All Rights Reserved.
The author hereby grants to MIT permission to reproduce and to distribute publicly
available paper and electronic copies of this thesis document in whole or in part.
Signature of Author:
Certified by
Edward M. Helvenston
Department of Nuclear Science and Engineering
12 May 2006
L & / N
•k,,)
Mujid S. Kazimi
TEPCO Professor o Nuclear Engineering
Thesis Co-supervisor
C
Certified by:.
Lin-wen Hu
Research Scientist
Thesis Co-supervisor
Accepted by:
MASSACHUSETTS INSTlTUTPE
OF TECHNOLOGYOCT 1
2
2007
LIBRARIES
,
vid G. Cory
Professor of Nuclear Scien
and Engineering
Chairman, NSE Committee for Undergraduate Students
ARCHIVES
r /,
ANALYSIS; OF IN-CORE EXPERIMENT ACTIVITIES FOR THE MIT RESEARCH REACTOR USING THE ORIGEN COMPUTER CODE
By
Edward M. Helvenston
Submitted to the Department of Nuclear Science and Engineering on 12 May 2006 In Partial Fulfillment of the Requirements for the Degree of
Bachelor of Science in Nuclear Science and Engineering ABSTRACT
The objective of this study is to devise a method for utilizing the ORIGEN-S computer code to calculate the activation products generated in in-core experimental assemblies at the MIT Research Reactor (MITR-II). ORIGEN-S is a nuclear depletion and decay analysis code. It accounts for all types of nuclear reactions and eliminates the need for selection of the dominant reactions that will occur in a given experiment, as must be done with the existing activity calculation method. It is expected that the new approach will be easy to use, and will produce radioactivity estimations that are generally more accurate than those produced by the existing method.
The ORIGEN-S method has been developed and tested for four experiments that have been or are scheduled to be irradiated in the MITR. These experiments are the Advanced Cladding Irradiation (ACI), High Temperature Irradiation Facility (HTIF), Electric Power Research Institute Electro-Chemical Potential (EPRI ECP) loop, and Annular Fuel Test Rig (AFTR). The method has also been used to perform activation analyses for ten individual elements (plus U-235 and U-238) that are commonly found in MITR in-core experiment (ICE) assemblies.
The ORIGEN-S analyses for the ACI, HTIF, and EPRI ECP experiments
produced results that were relatively similar to the results produced by previous analyses that utilized the current method of activation estimation. This is because the thermal neutron capture reactions, which are major contributors to the activation of these experiments, are already well accounted for in the existing method. The results of the ORIGEN-S analysis for the AFTR, which contains fissile material, were also very similar to the results of the previous analysis, despite the fact that the previous analysis
accounted for changes in flux due to fissile nuclide depletion during irradiation and the current analysis did not.
It is concluded that the activation calculation method developed should be
generally adequate for all experiments irradiated in the MITR core. A possible exception involves experiments containing quantities of fissile material larger than the quantities contained in the AFTR, as these experiments could produce significant changes in neutron flux levels that would render this method inadequate.
Thesis Co-supervisor: Mujid S. Kazimi Thesis Co-supervisor: Lin-wen Hu Title: TEPCO Professor of Nuclear Engineering Title: Research Scientist
Acknowledgements
First of all, I would like to thank Dr. Lin-wen Hu of the MIT Nuclear Reactor Lab
for her dedication to providing me with whatever assistance I needed during this project.
Her guidance helped ensure that I was continually making progress in the right direction,
and that I achieved the most useful results possible. I also thank Prof. Mujid Kazimi of
the Department of Nuclear Science and Engineering at MIT for his personal attention to
this project, as well as his useful suggestions made at every stage of the project. I thank
Ian Gauld and Germina Ilas of Oak Ridge National Laboratory for their suggestions and
their assistance with the use of the ORIGEN code. I thank Tom Newton of the MIT-NRL
for providing me with the neutron flux data required for this project. I thank Dr. Gordon
Kohse of the MIT-NRL for his suggestions for improving the usefulness of the results of
this thesis, and for his providing me with information on the various in-core experiments
at the MITR. I also thank David Carpenter of the MIT Department of Nuclear Science
and Engineering for providing me with additional information on the ACI experiment. I
thank Judy Maro of the MIT-NRL for her explanation of current in-core experiment
activation calculation methods, and for her additional suggestions on improving the
usefulness of my results. Finally, I thank everyone in my family for their support both
during this project, and during my entire time at MIT. Without all of the people above,
this thesis would not have been possible.
Table of Contents
ABSTRA CT ... ... ... 2
ACKNOWLEDGEMENTS ... 3
TABLE OF CON TENTS... ... 4
LIST O F TA B LE S ... ... ... 6
LIST OF FIGURES ... ... ... 8
CHAPTER 1: INTRODUCTION 1.1 Objective of the Thesis ... ... ... ... 10
1.2 Background Information on the MITR ... 10
1.3 MITR In-Core Experiments ... ... 11
1.4 Previous Work ... 12
1.5 M otivation for the Thesis ... ... ... 13
CHAPTER 2: METHODOLOGY 2.1 The ORIGEN Computer Code ... ... 15
2.2 Assumptions Made in ORIGEN-S Simulations ... 16
CHAPTER 3: ORIGEN ANALYSIS OF MITR ICEs 3.1 Advanced Cladding Irradiation (ACI) ... 20
3.2 High Temperature Irradiation Facility (HTIF) ...21
3.3 Electric Power Research Institute Electro-Chemical Potential (EPRI ECP) ... ... ... 25
3.4 Annular Fuel Test Rig (AFTR) ... 27
CHAPTER 4: SELECTED ELEMENTAL ANALYSES 4.1 Overview... 30
4.2 Analysis of Aluminum (Al) Irradiation ... ... ... 32
4.3 Analysis of Titanium (Ti) Irradiation ... ... 34
4.4 Analysis of Copper (Cu) Irradiation ... ... 38
4.5 Analysis of Vanadium (V) Irradiation ... 42
4.6 Analysis of Iron (Fe) Irradiation ... 45
4.7 Analysis of Magnesium (Mg) Irradiation... ... 49
4.8 Analysis of Manganese (Mn) Irradiation ... 51
4.10
Analysis of Chromium (Cr) Irradiation ... 58
4.11
Analysis of Platinum (Pt) Irradiation ... 61
4.12
Analysis of U-235 Irradiation... 66
4.13
Analysis of U-238 Irradiation ... 67
CHAPTER 5: SUMMARY OF CONCLUSIONS
5.1
Usefulness of ORIGEN-S Results...
... 68
5.2
Suggestions for Future Work ... 70
REFERENCES...73
APPENDIX A: GENERAL FORM OF ORIGEN-S INPUT FILES FOR MITR ICEs....75
APPENDIX B: ORIGEN INPUT FILES FOR THE ICEs ANALYZED IN THIS
THESIS ...
... ...
85
APPENDIX C: EXECUTING AN ORIGEN INPUT FILE ON A PC ...
... 88
APPENDIX D: STRUCTURE OF ORIGEN OUTPUT FILES ... 89
List of Tables
Table 2.1 MITR A-ring and B-ring Three-Group Average Neutron Flux Values.... 18
Table 2.2 Epithermal to Thermal and Fast to Thermal Flux Ratios ... 18
Table 3.1 Initial Element Loading for the ACI Assembly ... ...20
Table 3.2 Curies of Each Radioactive Nuclide in the ACI Assembly versus Decay Time (After Conclusion of Irradiation) ... ... 21
Table 3.3 Initial Element Loading for the HTIF Assembly ... 22
Table 3.4 Curies of Each Radioactive Nuclide in the HTIF Assembly versus Decay Time (After Conclusion of Irradiation) ... .. ... 24
Table 3.5 Initial Element Loading for the EPRI ECP Assembly...26
Table 3.6 Curies of Each Radioactive Nuclide in the EPRI ECP Assembly versus Decay Time (After Conclusion of Irradiation) ... 26
Table 4.1 Grams of Each Nuclide in the Al Sample versus Irradiation Time...32
Table 4.2 Curies of Each Nuclide in the Al Sample versus Decay Time... 32
Table 4.3 Grams of Each Nuclide in the Ti Sample versus Irradiation Time...34
Table 4.4 Curies of Each Nuclide in the Ti Sample versus Decay Time ... 35
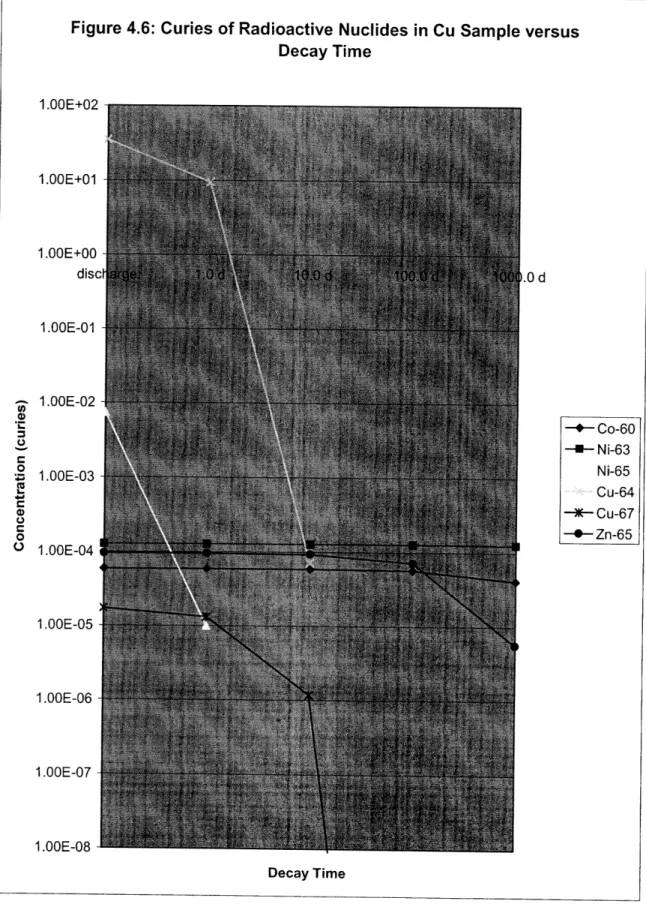
Table 4.5 Grams of Each Nuclide in the Cu Sample versus Irradiation Time...38
Table 4.6 Curies of Each Nuclide in the Cu Sample versus Decay Time... 39
Table 4.7 Grams of Each Nuclide in the V Sample versus Irradiation Time...42
Table 4.8 Curies of Each Nuclide in the V Sample versus Decay Time...43
Table 4.9 Grams of Each Nuclide in the Fe Sample versus Irradiation Time...45
Table 4.10 Curies of Each Nuclide in the Fe Sample versus Decay Time...46
Table 4.11 Grams of Each Nuclide in the Mg Sample versus Irradiation Time...49
Table 4.12 Curies of Each Nuclide in the Mg Sample versus Decay Time ... 49
Table 4.13 Grams of Each Nuclide in the Mn Sample versus Irradiation Time... 51
Table 4.14 Curies of Each Nuclide in the Mn Sample versus Decay Time...52
Table 4.15 Grams of Each Nuclide in the Zn Sample versus Irradiation Time...54
Table 4.16 Curies of Each Nuclide in the Zn Sample versus Decay Time...55
Table 4.17 Grams of Each Nuclide in the Cr Sample versus Irradiation Time...58
Table 4.18 Curies of Each Nuclide in the Cr Sample versus Decay Time... 59
Table 4.20 Curies of Each Nuclide in the Pt Sample versus Decay Time ... 63 Table A. 1 Description of Variables in the General ORIGEN Input File for MITR ICE
Activity Calculations ... ... 83 Table E. 1 Grams of Each Nuclide in the ACI Assembly versus Irradiation
Time ... ... ... 104 Table E.2 Grams of Each Nuclide in the ACI Assembly versus Decay Time (After
Conclusion of Irradiation) ... 106 Table E.3 Grams of Each Nuclide in the HTIF Assembly versus Irradiation
Tim e ... ... ... .. ... 108 Table E.4 Grams of Each Nuclide in the HTIF Assembly versus Decay Time (After
Conclusion of Irradiation) ... ... ... 114 Table E.5 Grams of Each Nuclide in the EPRI ECP Assembly versus Irradiation
Tim e ... .. ... . . ... ... 116 Table E.6 Grams of Each Nuclide in the EPRI ECP Assembly versus Decay Time
(After Conclusion of Irradiation) ... ... 121 Table E.7 Grams of Each Nuclide in the AFTR Assembly versus Irradiation
Time ... 122
Table E.8 Grams of Each Nuclide in the AFTR Assembly versus Decay Time (After Conclusion of Irradiation) ... ... 144 Table E.9 Curies of Each Radioactive Nuclide in the AFTR Assembly versus Decay
Time (After Conclusion of Irradiation) ... . ... 148 Table E.10 Curies of Each Radioactive Nuclide in the U-235 Sample versus Decay
Time ... ... ... 152 Table E. 11 Curies of Each Radioactive Nuclide in the U-238 Sample versus Decay
Figure 1.1
Figure 3.1
Figure 3.2
Figure 4.1
Figure 4.2
Figure 4.3
Figure 4.4
Figure 4.5
Figure 4.6
Figure 4.7
Figure 4.8
Figure 4.9
Figure 4.10
Figure 4.11
Figure 4.12
Figure 4.13
Figure 4.14
Figure 4.15
Figure 4.16
Figure 4.17
Figure 4.18
Figure 4.19
Figure 4.20
Figure A.1
Figure A.2
Figure B. 1
Figure B.2
List of Figures
The Core of the MITR ...
...
11
HTIF Assembly and Close-up View of Tungsten Sample Capsule
(Containing SiC Samples)...
23
AFTR Assembly and Close-up View of AFTR Fuel Sample ...
28
Grams of Radioactive Nuclides in Al Sample versus Irradiation Time.... 33
Curies of Radioactive Nuclides in Al Sample versus Decay Time...33
Grams of Radioactive Nuclides in Ti Sample versus Irradiation Time....36
Curies of Radioactive Nuclides in Ti Sample versus Decay Time... 37
Grams of Radioactive Nuclides in Cu Sample versus Irradiation Time...40
Curies of Radioactive Nuclides in Cu Sample versus Decay Time...41
Grams of Radioactive Nuclides in V Sample versus Irradiation Time...44
Curies of Radioactive Nuclides in V Sample versus Decay Time...45
Grams of Radioactive Nuclides in Fe Sample versus Irradiation Time....47
Curies of Radioactive Nuclides in Fe Sample versus Decay Time...48
Grams of Radioactive Nuclides in Mg Sample versus Irradiation
Tim e ... 50
Curies of Radioactive Nuclides in Mg Sample versus Decay Time...51
Grams of Radioactive Nuclides in Mn Sample versus Irradiation
Tim e ... 53
Curies of Radioactive Nuclides in Mn Sample versus Decay Time...53
Grams of Radioactive Nuclides in Zn Sample versus Irradiation Time... 56
Curies of Radioactive Nuclides in Zn Sample versus Decay Time...57
Grams of Radioactive Nuclides in Cr Sample versus Irradiation Time....60
Curies of Radioactive Nuclides in Cr Sample versus Decay Time...61
Grams of Radioactive Nuclides in Pt Sample versus Irradiation Time.... 64
Curies of Radioactive Nuclides in Pt Sample versus Decay Time...65
ORIGEN-S Input File for Sample Case #1 ... 75
General ORIGEN-S Input File for MITR ICEs ... 82
ORIGEN Input File for the ACI ...
... 85
Figure B.3 ORIGEN Input File for the EPRI ECP ... 86 Figure B.4 ORIGEN Input File for the AFTR ... ... 86 Figure D. 1 ORIGEN Output File for the ACI ... ... ...89
Chapter 1: Introduction
1.1 Objective of the Thesis
The objective of this thesis is to devise a method for determining the level of
radioactivity for in-core experiments (ICEs) that are irradiated in the core of the MITR
research reactor. The radioactivities will be determined for immediately after irradiation,
as well as after specified decay periods. This method should be easy to use, and it will
also streamline the process of ICE activity calculations because the same simple method
can be used fbr nearly all ICEs, regardless of their elemental composition or whether they
contain fissile materials. Also, this method should generally be more accurate than those
currently followed for safety reviews. The method will achieve this accuracy through
utilization of ORIGEN, a computer simulation code that was developed for isotope
depletion/decay analysis for spent fuel, fissile materials, and structural/cladding materials
[1,2]. ORIGEN has been validated by experimental data, and is widely used in research
and in industry [1,2]. Once the method is developed, it will be validated by the
comparison of its results (for calculations involving four ICEs that have been or will be
irradiated in the MITR) with results produced by previous activity calculations for the
same four ICEs. Additionally, the method will be used to perform analyses of the
neutron activation occurring in several individual elements that are commonly found in
MITR ICEs, in order to estimate the effect on total post-irradiation activity from using
each of these elements in an ICE.
1.2 Background Information on the MITR
The Massachusetts Institute of Technology Reactor, or the MITR, is a non-power
university research reactor capable of operating at power levels as high as five
megawatts. The MITR is light water cooled and moderated, and heavy water reflected.
Its core consists of positions for 27 fuel elements. Each of these positions is part of one
of three rings: the A ring, which is the center ring, has 3 positions numbered A-1 through
A-3; the B ring, which is the middle ring, has 9 positions numbered B-1 through B-9; and
the C ring, or outer ring, has 15 positions numbered C-l through C-15. [3] A schematic
of the MITR core that shows these 27 positions is provided in Figure 1.1.
Figure 1.1: The Core of the MITR [4]
Normally 24 of these 27 fuel element spaces contain individual highly-enriched
uranium (HEU) fuel elements when the reactor is operating. [3] Each of the positions
that do not contain fuel elements can be filled with a dummy element [3], or,
alternatively, with an in-core experiment (ICE) or an in-core sample assembly (ICSA)
[1]. (Note: An ICE differs from an ICSA in that an ICE includes dedicated
instrumentation and control systems, and has additional operating procedures, alarm
procedures, or scrams [1]. Throughout this thesis, ICE will be used to describe both ICEs
and ICSAs.)
1.3 MITR In-Core Experiments
ICEs are one of several experiment formats that can be used at the MITR. They
are used when an experimenter wishes to expose a particular experiment to the radiation
fluxes (especially fast neutron fluxes) under a controlled irradiation environment in the
MITR core. Up to two A-ring core positions and one B-ring position may contain ICEs
at any given time. [3] Because these assemblies are exposed to large neutron fluxes,
neutron activation of the materials in the assembly will be significant [1,5]. The fast
neutron flux is particularly high, and therefore fast neutron induced nuclear reactions,
such as (n,p), (n,alpha), and (n,2n), must be considered in addition to thermal neutron
capture reactions [1]. If a particular assembly contains a fissile material such as U-235,
then the neutron fluxes will lead to fission of this material, which in turn causes buildup
of fission products in the assembly. Because fissile materials can also undergo neutron
capture reactions that result in the production of other actinides, actinides will also
accumulate in an ICE containing fissile material. In summary, activation products,
fission products, and actinides can all contribute to the activity of an irradiated ICE. [1,5]
1.4 Previous Work
A calculation of the actinide and fission product inventories for the entire core of
the MITR after various burnup intervals, using the ORIGEN computer code, was
previously performed by Kennedy [6], whose work is an expansion on earlier
calculations of core nuclide inventories made by Mull [7] and Li [8]. These earlier works
only considered a relatively small number of fission product isotopes in their
calculations. Kennedy's work considered a much larger number of actinides and fission
products and also avoided the overly conservative assumptions made in the previous
calculations [6].
Kennedy's work, as part of the Maximum Hypothetical Accident (MHA) analysis,
includes activity calculations for a normal core loading of 24 fuel elements. It did not
attempt to calculate the additional activity that would be created in any ICEs that are also
present in the core and are irradiated along with the fuel. [1,6] Therefore, because it will
define a method to calculate the activity of ICEs, this thesis can be considered to be an
expansion of Kennedy's work.
Per the requirements of the Quality Assurance program at the MITR,
post-irradiation activities for all ICEs are estimated in order to provide a basis for personnel
radiation protection planning and waste disposal [1]. Section 1.5 provides more detail on
the methods currently used for these estimations and how this thesis will improve upon
those methods.
1.5 Motivation for the Thesis
It is important to obtain a good estimate for the types and activities of
radioisotopes contained in an ICE for three reasons. First, knowing the quantities and
types of radioactive isotopes contained in an ICE allows for an accurate calculation of the
dose rate associated with that ICE. This allows for a good estimate of the radiological
hazard posed by ICE when it is removed from the core. This information is essential for
experiment safety reviews, radiation protection, and waste disposal. Second, the
radioactive nuclides in an ICE contribute to the activity inventories of each nuclide for
the core as a 'whole. Therefore, a better estimate for the activity of an ICE at any given
time allows a more accurate value for the activity of the entire core to be calculated.
Third, in case of ICEs containing fissile materials, calculation of the activity of the ICE is
a prelude to determination of the decay heat produced by fission products in the ICE.
[1,5]
Currently, the radioactivities of an irradiated ICE are approximately predicted
based on an evaluation of the individual neutron activation reactions that occur for each
of the elements that are initially contained in the ICE. These reactions include thermal
neutron capture and the fast neutron interactions mentioned in Section 1.3. [1,5] In case
of ICEs containing fissile material, fission reactions are also considered. ICE safety
reviews, such as References [9], [10], and [ 11] include examples of activity
approximations based on the current method.
Unfortunately, the accuracy of the current method of estimating the
post-irradiation activity of ICEs is limited because of the limitation on the number of neutron
interactions that can be considered. Most ICEs contain a relatively wide range of
elements due to the use of metal alloys or metals that contain various amounts of
impurities. Most or all of the nuclides that are included in this range of elements will
undergo various reactions with the thermal, epithermal, and fast neutrons in the core.
The daughter nuclides of these reactions, in turn, can also undergo interactions with
neutrons or, in the case of unstable nuclides, radioactive decay. The same is true for the
product nuclides created by the decays and interactions of the first group of product
nuclides. Even after a given nucleus has been transformed from one nuclide to another,
the new nucleus can continue to be transformed through additional interactions and
decays. The consequence of this is that there is an extremely large number of neutron
interactions and decays that must be considered, and a large number of nuclides that must
be kept track of, in order to calculate the quantities of each type of nuclide in an
irradiated ICE as accurately as possible.
It would be extremely difficult to manually calculate the quantities of all of the
nuclides in an ICE if every one of the nuclide transformations occurring in the ICE were
taken into account. Therefore the current method attempts to include the interactions that
are most important, while neglecting the others. The current method tends to focus
primarily on thermal neutron capture reactions because these reactions generally have the
highest cross sections. Because many types of fast neutron reactions exist for given
target materials, few of the fast reactions are accounted for in experiment safety reviews.
Also, the current method typically focuses on primary interactions (interactions between
neutrons and the original ICE materials), while neglecting secondary interactions, tertiary
interactions, and so on. [9,10,11,12]
The advantage of using ORIGEN, instead of the current method, to calculate ICE
activities is that ORIGEN considers nearly all of the neutron interactions and radioactive
decays that could occur in the ICE [2]. ORIGEN utilizes updated nuclear data libraries,
and it has been experimentally verified for a wide range of applications [1]. The use of
ORIGEN should allow for a more accurate analysis of the ICE nuclide activities, and it
also prevents the need to pre-judge which reactions are most important. Furthermore,
once the user is familiar with the application-specific method of using ORIGEN that will
be described in this thesis, the user would be able to make activity calculations more
quickly and easily than is currently possible.
Chapter 2: Methodology
2.1 The ORIGEN Computer Code
ORIGEN is a nuclear depletion and decay analysis code that was created and is
maintained at Oak Ridge National Laboratory (ORNL). The code simulates the
destruction, creation, and decay over time of each of the nuclides in an input sample. [2]
For each nuclide, ORIGEN determines the concentration of that nuclide,
Ni,
as a function
of time by solving the differential equation
= Formation Rate - Destruction Rate - Decay Rate [2]
Formation of a particular nuclide results from the fission, decay, or transmutation (due to
neutron capture) of other nuclides into that nuclide; destruction of a particular nuclide
results from the fission or transmutation of that nuclide into other nuclides; and decay of
a particular nuclide is simply a result of that nuclide undergoing radioactive decay to a
different nuclide. [2] The full, more complex form of the equation solved by ORIGEN is
-
yj,iofjNj
+
oc,i-lNi-jl
+ X'Ni'
-ofiNi-
-
oc,iNij
-
X
1Ni,
where (i = 1, ... I), and
.
yjiofjNj
is the yield rate of
Ni
due to the fission of all nuclides
Nj;
cji-lNi-j0
is the rate of transmutation into
Ni
due to radiative neutron capture by
nuclide
Ni-1;
Xi'Ni
'is the rate of formation of
Ni
due to the radioactive decay of nuclides Ni';
of,iNij
is the destruction rate of
Ni
due to fission;
oc,iNio
is the destruction rate of
Ni
due to all forms of neutron absorption other
than fission (n,y, n,cx, n,p, n,2n, n,3n);
XiNi
is the radioactive decay rate of Ni." [2]
The current version of ORIGEN is ORIGEN-S Version
5,
which is included in the
SCALE
5.0
software package distributed by the Radiation Safety Information
improvements over previous versions of ORIGEN. Most notably, improvements were made to the built-in nuclear data libraries, and other improvements were made to simplify ORIGEN input files. Although ORIGEN-S can be executed on a PC, it does not have a graphical user interface and requires the creation of a text input file for each case that is to be run. [2] The format of ORIGEN-S input files, customized for MITR ICE activity calculations, will be described in Section 2.3. Section 2.3 will also describe the procedure for executing ORIGEN-S on a PC once an input file has been created.
Another component of the SCALE 5.0 software package, ORIGEN-ARP, provides a graphical user interface that allows the user to input case parameters and then uses these parameters to automatically generate an ORIGEN-S input file and execute ORIGEN-S for this file. For very standard and straightforward cases, the "Express Form" feature of ORIGEN-ARP can be used to input case parameters especially quickly. Unfortunately, the current version of ORIGEN-ARP, version 5, does not provide a wide enough range of input options to accommodate MITR ICE activity calculations. For example, it does not allow neutron fluxes to be specified directly (actinide concentrations and power levels must be specified instead), and it does not accommodate the use of the appropriate nuclear data libraries. For these reasons, ORIGEN-S input files for MITR ICEs will need to be manually created, and ORIGEN-S will need to be manually executed for these files. [2] ORNL is expected to release a new version of SCALE later in 2006 that will include a new version of ORIGEN-ARP. It is possible that the new features of this version will allow ORIGEN-ARP to be used for MITR ICE activity calculations. [13]
2.2 Assumptions Made in ORIGEN-S Simulations
Although ORIGEN-S should produce nuclide activity calculations that are more accurate than those produced by the current method, there are still a number of
assumptions that will be made for simplicity when running ORIGEN-S simulations. Some of these assumptions are built into the ORIGEN-S code [2] while others are specific to the particular ORIGEN-S method for calculating ICE activities that is described in this thesis.
First, ORIGEN-S assumes that for a particular sample that is being irradiated, all of the individual isotopes or elements contained in that sample are homogenously mixed.
Second, the code assumes that the neutron flux levels (which are specified by the user)
are constant throughout the sample. Third, when the flux levels are user-specified, the
flux is assumed to be constant over the entire irradiation time. [2] These assumptions are
similar to assumptions made in the current activity calculation methods [12].
ORIGEN-S includes a number of nuclear data libraries that provide the decay
constants, fission yields, and cross-sections needed to solve the equations given in
Section 2.1. Many of these data libraries are specific to a particular type of reactor, in
that the cross-sections are spectrum-weighted based on the particular neutron energy
spectrum that exists in the core of that reactor type. As ORIGEN-S does not include any
specific libraries for the MITR, there is no preferred library to be used. For the MITR
ICE cases, ORIGEN-S will utilize another set of its built-in nuclear data libraries known
as card-image libraries. The card-image libraries contain three-group neutron-cross
sections for all of the various nuclides that might be contained in an MITR ICE at any
time during its irradiation. The card-image libraries' three-group cross sections
correspond to three energy ranges of less than 0.625 eV (thermal), 0.625 eV to 1 MeV
(epithermal), and greater than 1 MeV (fast). Although the cutoffs for these energy groups
are somewhat larger than conventional values, these cutoff values are used for the
analyses in the thesis simply because they are the values that the card-image libraries are
based on. When using ORIGEN-S to calculate ICE activities, the user will specify
three-group neutron fluxes based on these three energy three-groups. Therefore the assumption of a
three-group neutron energy spectrum will also be made for the ICE activity calculation
method outlined in this thesis. [2] This is an improvement over the current activity
calculation method, which only considers two neutron groups [12].
Three:-group neutron flux values for these energy ranges for the upper third,
middle third, and lower third of the A- and B-rings have been calculated by Newton using
MCNP [14]. These values were calculated for empty A-1 and B-3 core positions
surrounded by an annulus of water 0.489 cm thick [14] (to simulate the moderation that
would occur in the primary coolant surrounding an ICE). It is desirable to have values
for both the A and B rings, as either of these rings can contain ICEs. For each of the
A-and B-rings, the upper third, middle third, A-and lower third values are averaged together to
determine the three-group flux values that will be used as ORIGEN-S inputs. Table 2.1
lists the flux values calculated by Newton, as well as the average three-group flux values that will be used for the A- and B-ring ICE calculations. The epithermal/thermal and fast/thermal ratios are also calculated and listed in Table 2.2, since ORIGEN-S takes epithermal and fast flux inputs in this form rather than as raw flux values [2]. The numbers in boldface on the tables are the values that will be input into ORIGEN depending on whether a calculation for an A-ring or a B-ring ICE is desired.
Table 2.1: MITR A-ring and B-ring Three-Group Average Neutron Flux Values [14] A-ring
Themal Flux, n/cmA2*s 4.13E+13 4.65E+13 4.64E+13
4.53E+13
Epith. Flux, n/cmA2*s
1.24E+14 1.52E+14 1.07E+14 1.28E+14
Fast Flux, n/cmA2*s 4.17E+13 5.06E+13 3.60E+13 4.28E+13
B-ring
Themal Flux, n/cmA2*s
Lower 3.97E+13 Middle 4.01E+13 Upper 3.94E+13 Average 3.97E+13 Table 2.2: Epithermal to Ti A-ring Epith. Lower Middle Upper Average
Epith. Flux, n/cmA2*s Fast Flux, n/cmA2*s
1.09E+14 3.82E+13
1.29E+14 4.53E+13
9.22E+13 3.29E+13
1.10E+14 3.88E+13
hermal and Fast to Thermal Flux Ratios
./Thermal Fast/Thermal 2.877 0.968 3.269 1.088 2.306 0.776 2.817 0.944 B-ring Epith./Thermal Fast/Thermal Lower 2.746 0.962 Middle 3.217 1.130 Upper 2.340 0.835 Average 2.768 0.976
Another assumption that is made in using the ORIGEN-S method outlined in this thesis involves the temperature of the ICE being irradiated. One of the inputs for
ORIGEN-S is a value known as THERM, where
THERM = ý -- Tý = 293.15 K. b4T'
[2]
THERM is a factor that adjusts the card-image thermal neutron cross-sections for variances in temperature of the target material. THERM is multiplied by the original
Lower Middle Upper Average
thermal neutron cross-sections to calculate the new cross-sections. [2] As temperature, T,
increases beyond 293.15 K, THERM will decrease, and therefore the thermal neutron
cross-sections will decrease as well. The ICEs that operate in the core of the MITR
operate at a wide range of internal temperatures; some are only slightly above the normal
core temperature of the MITR (-323 K) while others are considerably above it. Even
when the internal temperature of an ICE is very high, the outer sections of the ICE will
have to be at lower temperatures because of their closer proximity to the primary coolant.
Because of the wide range in possible ICE temperatures, it will be assumed for all of the
ICE cases run for this thesis that the temperature of the entire ICE assembly is 323 K.
This is a conservative assumption because increasing the temperature would decrease the
cross-sections, therefore decreasing the amount of activation occurring in the ICEs.
Based on the formula above, T
=
323 K corresponds to THERM
=
0.844. Appendix A,
which discusses ORIGEN-S input files, will describe how THERM can be modified if
desired.
Chapter 3: ORIGEN Analysis of MITR ICEs
3.1 Advanced Cladding Irradiation (ACI)
The ACI is an ICE being irradiated in the MITR in 2006. This particular ICE
contains various different silicon carbide ceramic samples, and it is designed to allow
these samples to be irradiated under conditions (flux as well as coolant
temperature/pressure) which simulate a PWR reactor core. The temperature and pressure
within the ACI are designed to be 300 degrees Celsius and 8.58 MPa, respectively. It is
desired to irradiate the samples under these conditions in order to evaluate the potential of
each of the various samples as a PWR fuel cladding material. [15]
The ACI will be irradiated in the B-ring of the MITR's core for the equivalent of
67.5 full-power days [16,17]. The materials that are present in the ACI assembly
immediately prior to commencement of its irradiation include approximately 1.07 kg of
grade 9 Ti, 0.879 kg of 6061-T6 Al, and 0.101 kg of SiC [17]. Using the description of
grade 9 Ti from [18] and the description 6061 -T6 Al from [19], the total elemental
content of the ACI can be calculated. The masses of each element are listed in Table 3.1.
Note that the total mass of the elements in the table is slightly larger than the total mass
above; this is due to the use of the conservative assumption that the maximum allowable
quantities of all impurities are present in the Ti and Al.
Table 3.1: Initial Element Loading for the ACI Assembly
Element Atomic Number Concentration (grams)
Ti 22 1012.4 Al 13 893.5 V 23 26.8 Cr 24 3.1 Cu 29 3.5 Fe 26 6.2 Mg 12 10.5 Mn 25 1.3 Si 14 77.8 Zn 30 2.2 C 6 30.3
The
ORIGEN
calculation for irradiation of the ACI yields the results that are
listed in Tables E.1, E.2, and 3.2. Table E.1 lists the number of grams of each nuclide in
the assembly versus irradiation time. Table E.2 lists the number of grams of each nuclide
in the assembly versus decay time after completion of the irradiation. Table 3.2 is similar
to Table E.2, except that only radioactive nuclides are listed and units of curies are used
instead of grams. Table 3.2 is shown here because it contains the primary result desired from the ORIGEN calculation, namely the amount of activation occurring in the ACI ICE. Tables E. 1 and E.2 can be found in Appendix E due to their length as well as their secondary importance. Note that these three tables are subject to the cutoff values described in Appendix A, so nuclides with small concentrations are not listed.
Table 3.2: Curies of Each Radioactive Nuclide in the A CI Assembly Versus Decay Time (After Conclusion ofIrradiation)
charge O.OOE+00 O.OOE+00 O.OOE+00 O.OOE+00 O.OOE+00 O.OOE+00 O.OOE+00 O.OOE+00 O.OOE+00 O.OOE+00 O.OOE+00 O.OOE+00 O.OOE+00 0.00E+00 0.OOE+00 0.00E+00 0.OOE+00 0.00E+00 0.00E+00 3.37E-1 5 discharge 4.0 d 2.44E+01 2 3.10E-04 2 1.54E-01 1 5.03E-03 2 5.17E+00 5. 2.21 E+01 9. 3.99E+00 8 1.92E-05 1 1.94E+01 1. 5.33E-02 5 3.90E-01 3 1.59E-01 1 3.22E-04 3 6.88E-04 6 1.08E+02 5 1.36E-03 4 1.60E+00 1. 4.97E+00 2 3.34E-01 2 6.70E+03 3. 30.0 d .60E-01 .55E-04 .52E-01 .73E-03 00E+00 65E+00 .69E-01 .91 E-05 75E+01 .29E-02 .89E-01 .49E-01 .22E-04 .88E-04 .74E-01 .62E-04 58E+00 .85E-03 .65E-03 62E+01 100.0 d 1000.0 d 3.98E-14 7.22E-05 1.36E-01 5.13E-05 4.03E+00 4.43E-02 4.37E-05 1.81E-05 9.15E+00 4.99E-02 3.82E-01 9.95E-02 3.19E-04 6.88E-04 9.30E-16 4.23E-07 1.47E+00 6.37E-17 5.93E-17 1.54E+01 0.00E+00 2.40E-06 1.01E-01 1.16E-09 2.26E+00 2.65E-08 1.16E-16 1.57E-05 1.59E+00 4.27E-02 3.63E-01 3.34E-02 3.11E-04 6.87E-04 0.00E+00 2.80E-15 1.21 E+00 0.00E+00 0.00E+00 5.59E+00 0.OOE+00 6.34E-10 2.24E-03 0.00E+00 1.32E-03 0.00E+00 0.00E+00 2.47E-06 2.65E-10 5.79E-03 1.94E-01 2.73E-08 2.25E-04 6.75E-04 0.OOE+00 0.OOE+00 9.33E-02 0.00E+00 0.00E+00 2.98E-01
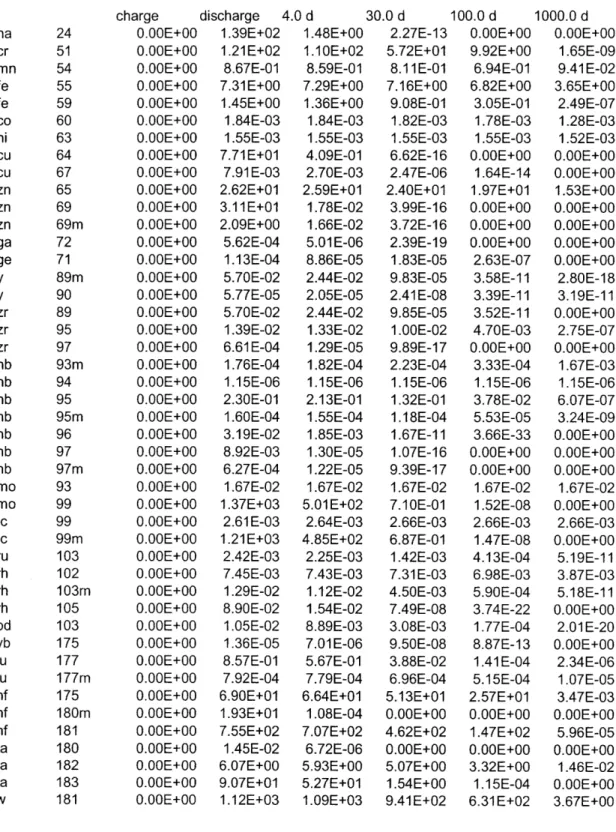
3.2 High Temperature Irradiation Facility (HTIF)
The HTIF is another ICE assembly that was used to create an environment for the irradiation of materials at high temperatures (approximately 1000 to 1400 degrees
Celsius). These sample materials (various silicon carbide samples) were inserted inside the HTIF assembly and were insulated by a neon, helium, or Ne/He mixture inside the assembly. The HTIF was located in the A-ring of the MITR core, and it is assumed for the purpose of this analysis to have been irradiated for 220 full-power days (although in actuality it was irradiated for a shorter period of time). [ 1,11] The initial element content for the HTIF is given in Table 3.3. Table 3.3 does not include element concentrations
Nuclide na p ca ca sc sc sc v cr mn fe fe co ni cu cu zn zn zn Totals 24 32 45 47 46 47 48 49 51 54 55 59 60 63 64 67 65 69 69m
from any silicon carbide samples in the HTIF assembly, as these are not included in the activation analysis for the assembly. Figure 3.1 shows a drawing of the HTIF assembly as well as a close-up view of one of tungsten sample capsules contained in the assembly [20].
Table 3.3: Initial Element Loading for the HTIF Assembly [ 1] Element Atomic Number Concentration (grams)
W 74 5055 Mo 42 632 Rh 45 9.9 Re 75 1.5 Hf 72 34 Pt 78 89 Al 13 4677 Cr 24 14 Mn 25 7.1 Cu 29 2.1 Fe 26 33 Zn 30 12
Figure 3.1: HTIF Assembly and Close-up View of Tungsten Sample Capsule (Containing
SiC Samples) [20]
The ORIGEN calculation for the HTIF yields three tables of data, as was the case
with the ACI calculation. Tables E.3 and E.4 list nuclide concentrations in grams versus
irradiation time and nuclide concentrations in grams versus irradiation time, respectively.
Tables E.3 and E.4 can be found in Appendix E. Table 3.4, which is shown below, lists
radioactive nuclide concentrations
in
curies versus decay time after irradiation ceases. As
was also the case for the ACI calculation data, the data in these three tables are subject to the cutoffs described in Appendix A.
Table 3.4: Curies of Each Radioactive Nuclide in the HTIF Assembly Versus Decay Time (After Conclusion of Irradiation)
charge discharge 4.0 d 30.0 d 100.0 d 1000.0 d
na 24 0.00E+00 1.39E+02 1.48E+00 2.27E-13 0.OOE+00 0.00E+00
cr 51 0.00E+00 1.21E+02 1.10E+02 5.72E+01 9.92E+00 1.65E-09
mn 54 0.00E+00 8.67E-01 8.59E-01 8.11E-01 6.94E-01 9.41E-02 fe 55 0.OOE+00 7.31E+00 7.29E+00 7.16E+00 6.82E+00 3.65E+00
fe 59 0.00E+00 1.45E+00 1.36E+00 9.08E-01 3.05E-01 2.49E-07
co 60 0.00E+00 1.84E-03 1.84E-03 1.82E-03 1.78E-03 1.28E-03 ni 63 0.OOE+00 1.55E-03 1.55E-03 1.55E-03 1.55E-03 1.52E-03
cu 64 0.OOE+00 7.71E+01 4.09E-01 6.62E-16 0.OOE+00 0.00E+00
cu 67 0.OOE+00 7.91 E-03 2.70E-03 2.47E-06 1.64E-14 0.OOE+00 zn 65 0.OOE+00 2.62E+01 2.59E+01 2.40E+01 1.97E+01 1.53E+00 zn 69 0.OOE+00 3.11E+01 1.78E-02 3.99E-16 0.OOE+00 0.OOE+00 zn 69m 0.OOE+00 2.09E+00 1.66E-02 3.72E-16 0.OOE+00 0.OOE+00 ga 72 0.OOE+00 5.62E-04 5.01E-06 2.39E-19 0.OOE+00 0.OOE+00 ge 71 0.OOE+00 1.13E-04 8.86E-05 1.83E-05 2.63E-07 0.OOE+00
y 89m 0.OOE+00 5.70E-02 2.44E-02 9.83E-05 3.58E-11 2.80E-18
y 90 0.OOE+00 5.77E-05 2.05E-05 2.41E-08 3.39E-11 3.19E-11 zr 89 0.OOE+00 5.70E-02 2.44E-02 9.85E-05 3.52E-11 0.OOE+00 zr 95 0.OOE+00 1.39E-02 1.33E-02 1.00E-02 4.70E-03 2.75E-07 zr 97 0.OOE+00 6.61 E-04 1.29E-05 9.89E-17 0.OOE+00 0.OOE+00 nb 93m 0.OOE+00 1.76E-04 1.82E-04 2.23E-04 3.33E-04 1.67E-03 nb 94 0.OOE+00 1.15E-06 1.15E-06 1.15E-06 1.15E-06 1.15E-06 nb 95 0.OOE+00 2.30E-01 2.13E-01 1.32E-01 3.78E-02 6.07E-07 nb 95m 0.OOE+00 1.60E-04 1.55E-04 1.18E-04 5.53E-05 3.24E-09 nb 96 0.OOE+00 3.19E-02 1.85E-03 1.67E-11 3.66E-33 0.OOE+00
nb 97 0.00E+00 8.92E-03 1.30E-05 1.07E-16 0.OOE+00 0.00E+00
nb 97m 0.OOE+00 6.27E-04 1.22E-05 9.39E-17 0.OOE+00 0.OOE+00
mo 93 0.OOE+00 1.67E-02 1.67E-02 1.67E-02 1.67E-02 1.67E-02
mo 99 0.OOE+00 1.37E+03 5.01E+02 7.10E-01 1.52E-08 0.OOE+00 tc 99 0.OOE+00 2.61E-03 2.64E-03 2.66E-03 2.66E-03 2.66E-03 tc 99m 0.OOE+00 1.21E+03 4.85E+02 6.87E-01 1.47E-08 0.OOE+00 ru 103 0.OOE+00 2.42E-03 2.25E-03 1.42E-03 4.13E-04 5.19E-11 rh 102 0.OOE+00 7.45E-03 7.43E-03 7.31E-03 6.98E-03 3.87E-03
rh 103rn 0.OOE+00 1.29E-02 1.12E-02 4.50E-03 5.90E-04 5.18E-11
rh 105 0.OOE+00 8.90E-02 1.54E-02 7.49E-08 3.74E-22 0.OOE+00 pd 103 0.OOE+00 1.05E-02 8.89E-03 3.08E-03 1.77E-04 2.01E-20
yb 175 0.OOE+00 1.36E-05 7.01E-06 9.50E-08 8.87E-13 0.OOE+00
lu 177 0.OOE+00 8.57E-01 5.67E-01 3.88E-02 1.41 E-04 2.34E-06
lu 177rn 0.OOE+00 7.92E-04 7.79E-04 6.96E-04 5.15E-04 1.07E-05 hf 175 0.OOE+00 6.90E+01 6.64E+01 5.13E+01 2.57E+01 3.47E-03
hf 180rn 0.OOE+00 1.93E+01 1.08E-04 0.OOE+00 0.OOE+00 0.OOE+00
hf 181 0.OOE+00 7.55E+02 7.07E+02 4.62E+02 1.47E+02 5.96E-05 ta 180 0.OOE+00 1.45E-02 6.72E-06 0.OOE+00 0.OOE+00 0.OOE+00 ta 182 0.OOE+00 6.07E+00 5.93E+00 5.07E+00 3.32E+00 1.46E-02 ta 183 0.OOE+00 9.07E+01 5.27E+01 1.54E+00 1.15E-04 0.OOE+00
w 183rn O.OOE+00 9.07E+01 5.27E+01 1.54E+00 1.15E-04 0.00E+00
w 185 O.OOE+00 2.10E+04 2.03E+04 1.59E+04 8.35E+03 2.06E+00
w 187 O.OOE+00 4.94E+05 3.05E+04 4.22E-04 2.92E-25 O.OOE+00
w 188 O.OOE+00 1.49E+02 1.43E+02 1.11E+02 5.50E+01 6.90E-03
re 186 0.00E+00 3.71E+03 1.78E+03 1.51E+01 3.97E-05 0.00E+00
re 187 3.61E-08 4.12E-06 4.14E-06 4.14E-06 4.14E-06 4.14E-06
re 188 0.00E+00 4.29E+04 1.01E+03 1.12E+02 5.56E+01 6.97E-03
re 189 O.OOE+00 5.00E+00 3.24E-01 6.05E-09 9.43E-30 O.OOE+00
os 185 O.OOE+00 2.70E-03 2.62E-03 2.16E-03 1.29E-03 1.65E-06
os 191 O.OOE+00 7.16E-03 6.21E-03 1.93E-03 8.26E-05 2.14E-22
os 191rn 0.00E+00 7.35E-03 4.57E-05 2.09E-19 0.00E+00 0.00E+00
os 193 O.OOE+00 4.62E-04 5.22E-05 3.62E-11 9.49E-28 O.OOE+00
ir 192 O.OOE+00 1.35E+00 1.30E+00 1.02E+00 5.28E-01 1.14E-04
ir 194 O.OOE+00 2.41E-01 7.45E-03 6.60E-09 6.46E-09 4.86E-09
ir 194rn O.OOE+00 3.08E-03 3.03E-03 2.73E-03 2.05E-03 5.38E-05
pt 191 0.00E+00 5.40E+00 2.08E+00 4.20E-03 2.35E-10 O.OO00E+00
pt 193 O.OOE+00 6.13E-01 6.14E-01 6.15E-01 6.14E-01 5.93E-01
pt 193rn O.OOE+00 1.17E+01 6.17E+00 9.60E-02 1.30E-06 O.OOE+00 pt 195rn 0.00E+00 1.92E+01 9.61E+00 1.09E-01 6.21E-07 O.OOE+00
pt 197 O.OOE+00 1.30E+02 3.45E+00 1.89E-10 O.OOE+00 O.OOE+00
au 198 O.OOE+00 1.82E+01 6.51E+00 8.13E-03 1.24E-10 O.OOE+00
au 199 O.OOE+00 2.35E+02 9.76E+01 3.13E-01 6.06E-08 0.00E+00
hg 197 O.OOE+00 1.34E-05 4.76E-06 5.61E-09 7.31E-17 O.OOE+00
Totals 3.61 E-08 6.62E+05 5.70E+04 1.77E+04 9.31 E+03 1.17E+01
3.3 Electric Power Research Institute Electro-Chemical Potential (EPRI ECP) The EPRI ECP assembly was designed to provide an environment within the core of the MITR that simulated the conditions in a BWR reactor core (1500 psi and 290 degrees Celsius). The assembly contained Inconel as well as the BWR fuel cladding material Zircaloy. It was desired to measure the electro-chemical potential between the Inconel and Zircaloy under the BWR conditions, as well as to measure the effect on Zircaloy corrosion of placing various materials either close to or touching the Zircaloy material. [10]
The EPRI ECP assembly was located in the B-ring of the MITR [1], and was irradiated for 10 full-power days [10]. Table 3.5 lists the initial element loading for the EPRI ECP assembly.
Table 3.5: Initial Element Loadingfor the EPRI ECP Assembly [10] Element Atomic Number Concentration (grams)
Al 13 1782.24 Ti 22 824.84 Zr 40 2.27 Mo 42 20.72 V 23 17.22 Pt 78 16.36 Fe 26 8.8 Cr 24 5.28 Cu 29 5.28 Ni 28 19.5 Mn 25 1.76 Nb 41 0.1
Again, three tables of results are generated by the ORIGEN calculations
performed for the EPRI ECP irradiation. Tables E.5 and E.6 list nuclide concentrations
in grams versus irradiation time and nuclide concentrations in grams versus irradiation
time, respectively. Tables E.5 and E.6 are located in Appendix E due to their length.
Table 3.6, which appears below, lists radioactive nuclide concentrations in curies versus
decay time after irradiation ceases. As was the case for the ACI and HTIF calculation
data, the data in these three tables are subject to the cutoffs described in Appendix A.
Table 3.6: Curies of Each Radioactive Nuclide in the EPRI ECP Assembly Versus Decay Time (After Conclusion of Irradiation)
na ca ca sc sc sc v cr mn fe fe co co ni charge 0.00E+00 0.00E+00 0.00E+00 0.00E+00 0.00E+00 0.00E+00 0.00E+00 0.00E+00 0.00E+00 0.00E+00 0.00E+00 0.00E+00 0.00E+00 0.00E+00 ni 63 0.00E+00 0.00E+00 0.00E+00 0.00E+00 0.00E+00 discharge 4.0 d 4.78E+01 5.11E-01 2.10E-02 2.06E-02 3.20E-03 1.74E-03 7.82E-01 7.56E-01 1.57E+01 6.87E+00 3.18E+00 6.93E-01 1.95E-06 1.93E-06 8.98E+00 8.12E+00 1.20E-02 1.18E-02 9.35E-02 9.33E-02 5.00E-02 4.69E-02 1.31E+00 1.26E+00 6.44E-04 6.43E-04 1.53E-04 1.53E-04 1.88E-02 1.88E-02 2.47E-05 1.63E+02 3.49E+01 6.50E-05 7.31E-06 8.62E-01 7.32E-06 2.22E-05 30.0 d 7.83E-14 1.85E-02 3.27E-05 6.10E-01 3.15E-02 3.48E-05 1.83E-06 4.24E+00 1.12E-02 9.16E-02 3.13E-02 9.76E-01 6.37E-04 1.53E-04 1.88E-02 2.66E-09 1.40E-15 2.66E-09 2.03E-08 100.0 d 0.00E+00 1.37E-02 7.39E-10 3.42E-01 1.85E-08 9.27E-17 1.59E-06 7.36E-01 9.57E-03 8.72E-02 1.05E-02 4.93E-01 6.21E-04 1.53E-04 1.88E-02 1.46E-18 0.00E+00 1.46E-18 1.34E-16 1000.0 d 0.00E+00 3.05E-04 0.00E+00 2.00E-04 0.00E+00 0.00E+00 2.51E-07 1.23E-10 1.30E-03 4.67E-02 8.59E-09 7.45E-05 4.49E-04 1.53E-04 1.84E-02 0.00E+00 0.00E+00 0.00E+00 0.00E+00
zn 65 0.OOE+00 2.19E-05 2.16E-05 2.01E-05 1.65E-05 1.28E-06 sr 89 0.OOE+00 7.71E-06 7.30E-06 5.11E-06 1.96E-06 8.57E-12
y 89m 0.OOE+00 2.57E-03 1.10E-03 4.44E-06 1.84E-10 7.97E-16
y 90 0.OOE+00 3.17E-03 1.12E-03 1.32E-06 9.64E-13 8.91E-13
y 91 0.OOE+00 4.46E-05 4.27E-05 3.14E-05 1.37E-05 3.20E-10
zr 89 0.00E+00 2.58E-03 1.10E-03 4.45E-06 1.59E-12 O.OOE+00
zr 95 0.OOE+00 2.97E-02 2.84E-02 2.14E-02 1.00E-02 5.88E-07 zr 97 0.OOE+00 3.41E-01 6.64E-03 5.10E-14 O.OOE+00 0.OOE+00 nb 94 0.OOE+00 1.58E-06 1.58E-06 1.58E-06 1.58E-06 1.58E-06 nb 95 0.OOE+00 4.11E-03 6.00E-03 1.34E-02 1.37E-02 1.30E-06
nb 95m 0.00E+00 1.85E-04 2.58E-04 2.52E-04 1.18E-04 6.92E-09
nb 96 0.00E+00 9.28E-04 5.37E-05 4.84E-13 1.06E-34 0.OOE+00
nb 97 0.OOE+00 3.41E-01 6.68E-03 5.49E-14 0.OOE+00 0.00E+00
nb 97m 0.OOE+00 3.23E-01 6.30E-03 4.84E-14 0.OOE+00 0.OOE+00
mo 93 O.OOE+00 2.16E-05 2.16E-05 2.16E-05 2.16E-05 2.16E-05
mo 99 0.OOE+00 3.57E+01 1.30E+01 1.85E-02 3.96E-10 0.OOE+00
tc 99 0.OOE+00 2.12E-06 2.99E-06 3.49E-06 3.49E-06 3.49E-06
tc 99m 0.OOE+00 3.12E+01 1.26E+01 1.79E-02 3.83E-10 0.OOE+00
os 191 0.00E+00 1.52E-06 1.27E-06 3.94E-07 1.69E-08 4.38E-26
os 193 0.OOE+00 6.03E-05 6.80E-06 4.72E-12 1.24E-28 0.OOE+00 ir 192 0.OOE+00 9.01E-04 8.68E-04 6.80E-04 3.53E-04 7.58E-08 ir 194 0.OOE+00 3.34E-05 1.03E-06 3.38E-11 3.30E-11 2.48E-11
pt 191 0.OOE+00 8.84E-01 3.40E-01 6.88E-04 3.84E-11 0.OOE+00
pt 193 0.OOE+00 4.26E-03 4.43E-03 4.62E-03 4.61E-03 4.45E-03
pt 193m 0.OOE+00 1.52E+00 8.03E-01 1.25E-02 1.69E-07 0.OOE+00
pt 195m 0.00E+00 2.52E+00 1.26E+00 1.43E-02 8.17E-08 0.OOE+00
pt 197 0.OOE+00 1.93E+01 5.12E-01 2.81 E-11 0.OOE+00 0.OOE+00 au 198 0.OOE+00 7.66E-02 2.74E-02 3.42E-05 5.21E-13 0.OOE+00 au 199 0.OOE+00 3.25E+01 1.35E+01 4.35E-02 8.41E-09 0.OOE+00 total 6.50E-12 1.11E+04 6.15E+01 6.18E+00 1.74E+00 7.21E-02
3.4 Annular Fuel Test Rig (AFTR)
The AFTR was an ICE that differed from the three ICEs described above in that it
contained fissile materials as well as other types of materials. This ICE was designed to
contain up to four capsules of PWR reactor fuel with an annular geometry [21] (although
during actual operation it never contained more than two
[5]).
The purpose of the ICE
was to determine the possible effects of irradiation on these samples. The peak
temperature inside the samples was expected to be no more than 500 degrees Celsius.
[21] Figure 3.2 shows a drawing of the AFTR assembly, as well as a close-up view of
one of the fuel samples that could be contained in the AFTR [20].
Figure 3.2: AFTR Assembly and Close-up View of AFTR Fuel Sample [20]
The AFTR was located in the A-ring of the MITR core, and is assumed to have
been irradiated for 420 full-power days. The ORIGEN calculation is performed for one
of the individual fuel samples in the AFTR. This sample contains uranium dioxide
powder that is 5% enriched in U-235. The amount of heavy metal in the capsule chosen
for analysis is 114.7 grams, so it will be assumed that the sample contains 5.735 grams of
U-235 and 108.965 grams ofU-238. [21] Although the sample contains other materials
such as those contained in cladding, et cetera [21], those materials will not be included in
the analysis performed here because their contribution to total activation will be very
small [16]. The initial loading for the AFTR is therefore taken to be 5.735 grams of
U-235 and 108.965 grams of U-238.
The three tables of results generated by the ORIGEN calculation for the AFTR
are placed in Appendix E due to their length. Table E.7 and E.8 list nuclide
concentrations
in
grams versus irradiation time and nuclide concentrations in grams
versus decay time, respectively. Table E.9 lists radioactive nuclide concentrations in
curies versus decay time after irradiation ceases. As was the case with the data for the
ICEs described in Sections 3.1 through 3.3, the data in these three tables are subject to the
cutoffs described in Appendix A. It should also be noted that tables E.7, E.8, and E.9
include actinides as well as fission products generated during AFTR irradiation.
Chapter 4: Selected Elemental Analyses
4.1 Overview
This chapter lists the results of ORIGEN analyses of the irradiation often selected
elements (plus the two nuclides U-235 and U-238), all of which are commonly used in
MITR ICEs. The purpose of these analyses is to generate separate listings for each of
these elements of nuclides of all of the nuclides produced during irradiation of the
element or nuclide. Because each listing is based on the irradiation of one individual
element or nuclide, the listing will only include irradiation products of that specific
element or nuclide. When the initial element or nuclide being irradiated is known, the
presence of the nuclides in the irradiation product listing can be justified using the chart
of the nuclides. This chapter will also use the chart of the nuclides, as provided by [22],
to justify the presence of some of the nuclides present in the irradiation product listings
for each of these selected elements.
The ORIGEN results in this chapter were produced using ORIGEN input files of
the general format described in Appendix A. It was assumed that one gram of each of the
selected elements or nuclides was irradiated in the A-ring of the core of the MITR for 40
days, then allowed to decay for 1000 days. Concentrations of each nuclide in the samples
are given in grams for 0, 10, 20, 30, and 40 days of irradiation; concentrations of
radioactive nuclides in the samples during the decay (post-irradiation) period are given in
curies for 0, 1, 10, 100, and 1000 days after the start of the decay period. Cutoffs of
le-10 grams during the irradiation period and 1 e-6 curies during the decay period are applied
to these data to limit the nuclides listed to those with significant concentration levels (see
Appendix A for a description of how these cutoffs are applied). Other assumptions made
for the analyses in this chapter are identical to the assumptions described in Section 2.2.
The elements chosen for analysis are Al, Ti, Cu, V, Fe, Mg, Mn, Zn, Cr, and Pt.
Al is analyzed because it is the primary component of ICE outer structural materials. Fe
is the main component in stainless steel, which is often used as ICE internals. Ti is
frequently used in ICEs as well, because of its corrosion resistance and low activation.
The remaining elements can exist as trace elements in alloys of Al, Ti, and stainless steel.
The nuclides U-235 and U-238 are also analyzed because of their presence in fissile
material irradiation experiments. [1]
It should be noted that on the plots of nuclide concentration versus decay time
included in this chapter, the plots for certain nuclides stop before reaching 1000 days of
decay time. The lack of data points indicates that the concentration of that nuclide is
effectively zero beyond the point where the data points stop (since a concentration of zero
cannot be indicated on a graph utilizing a log scale for the axis corresponding to
concentration). Similarly, on the plots of nuclide concentration versus irradiation time in
this chapter that utilize log scales for the axis corresponding to concentration, the points
for initial concentration before irradiation (charge) are not plotted. However, in this case
it should be obvious that the concentration values for these points will be zero.
The analysis for each of the elements includes a discussion of the neutron
reactions and/or radioactive decay schemes that are involved in the creation of the
important activation products of the element. Reaction cross-sections and decay
half-lives are given whenever this data is provided in [22]. It should be noted that two values
are given for the cross sections for fast reactions [(n,alpha), (n,p), and (n,2n)] [22]. The
first value given for each reaction is based on a neutron energy of 14 MeV, and the
second is the value of the cross section for that reaction averaged over the entire fission
neutron energy spectrum. The cross sections given for thermal reactions [(n,gamma)] are
for a neutron energy of 0.0253 eV [22]. Although the MITR contains very few 14 MeV
neutrons, the 14 MeV cross sections are still provided for the fast neutron reactions in
order to have values that are somewhat representative of the cross-sections for the full
range of fast neutron energies (although the 14 MeV values can still vary greatly from the
values for the fast neutron energies seen in the MITR, and from values for the full range
of fast neutron energies). [22] does not provide cross section values for lower-energy fast
neutrons. Because the 14 MeV values are for such a large energy value and may not
always be representative of the lower-energy fast neutrons in the MITR, fission spectrum
average cross sections are also provided for the fast neutron reactions. The fission
spectrum average values will be very small, however, as they include smaller neutron
energies in addition to fast neutron energies, and the (n,alpha), (n,p), and (n,2n) reactions
generally have extremely small cross sections for lower energy neutrons. For each fast
neutron reaction described in this chapter for which cross section values are available
from [22], the 14 MeV cross section is given first, followed by the fission spectrum
average cross section in parentheses.
4.2 Analysis of Aluminum (Al) Irradiation
The grams of each nuclide in the Al sample versus irradiation time are listed in
Table 4. 1, and the curies of each radioactive nuclide in the Al sample versus decay time
are listed in Table 4.2.
Table 4.1: Grams of Each Nuclide in the Al Sample versus Irradiation Time
Nuclide charge (0.0 d) 10.0 d 20.0 d 30.0 d 40.0 d
h 1 0.00E+00 7.66E-09 1.53E-08 2.30E-08 3.07E-08 h 2 0.00E+00 8.83E-14 3.53E-13 7.95E-13 1.41E-12 h 3 0.00E+00 7.96E-22 6.37E-21 2.15E-20 5.09E-20 h 4 0.00E+00 3.49E-40 2.79E-39 9.42E-39 2.23E-38 he 3 0.00E+00 2.95E-25 4.56E-24 2.23E-23 6.81 E-23 he 4 0.OOE+00 6.29E-09 1.26E-08 1.89E-08 2.52E-08 he 6 0.OOE+00 0.OOE+00 0.OOE+00 0.OOE+00 0.OOE+00 na 22 0.OOE+00 1.47E-26 4.74E-26 8.68E-26 1.29E-25
na 23 0.OOE+00 1.53E-16 3.21E-16 4.89E-16 6.57E-16 na 24 0.OOE+00 3.32E-09 3.32E-09 3.32E-09 3.32E-09 na 24m 0.OOE+00 4.36E-29 9.14E-29 1.39E-28 1.87E-28 na 25 0.OOE+00 3.93E-19 3.93E-19 3.93E-19 3.93E-19
mg 24 0.OOE+00 3.44E-08 7.21E-08 1.10E-07 1.48E-07
mg 25 0.OOE+00 7.22E-13 2.90E-12 6.52E-12 1.16E-11
mg 26 0.OOE+00 3.87E-18 3.10E-17 1.05E-16 2.48E-16
mg 27 0.OOE+00 1.96E-10 1.96E-10 1.96E-10 1.96E-10
mg 28 0.OOE+00 5.91E-17 5.91E-17 5.91E-17 5.91E-17
al 27 1.00E+00 1.00E+00 1.00E+00 1.00E+00 1.00E+00
al 28 0.OOE+00 1.93E-09 1.93E-09 1.93E-09 1.93E-09
al 29 0.OOE+00 3.63E-21 1.45E-20 3.27E-20 5.81E-20 al 30 0.OOE+00 3.76E-31 3.01E-30 1.02E-29 2.41 E-29 si 28 0.OOE+00 8.61 E-06 1.72E-05 2.58E-05 3.44E-05
si 29 O.OOE+00 2.67E-11 1.07E-10 2.40E-10 4.27E-10
si 30 0.OOE+00 4.05E-17 3.24E-16 1.09E-15 2.59E-15 si 31 0.OOE+00 4.77E-24 3.82E-23 1.29E-22 3.05E-22 si 32 0.OOE+00 7.45E-30 1.20E-28 6.08E-28 1.93E-27
Totals 1.00E+00 1.00E+00 1.00E+00 1.00E+00 1.00E+00
Table 4.2: Curies of Each Radioactive Nuclide in the Al Sample versus Decay Time
Nuclide charge discharge 1.0 d 10.0 d 100.0 d 1000.0 d na 24 0.OOE+00 2.96E-02 9.52E-03 3.49E-07 0.OOE+00 0.OOE+00 Totals 0.OOE+00 5.97E+00 9.52E-03 3.49E-07 4.85E-16 4.22E-16
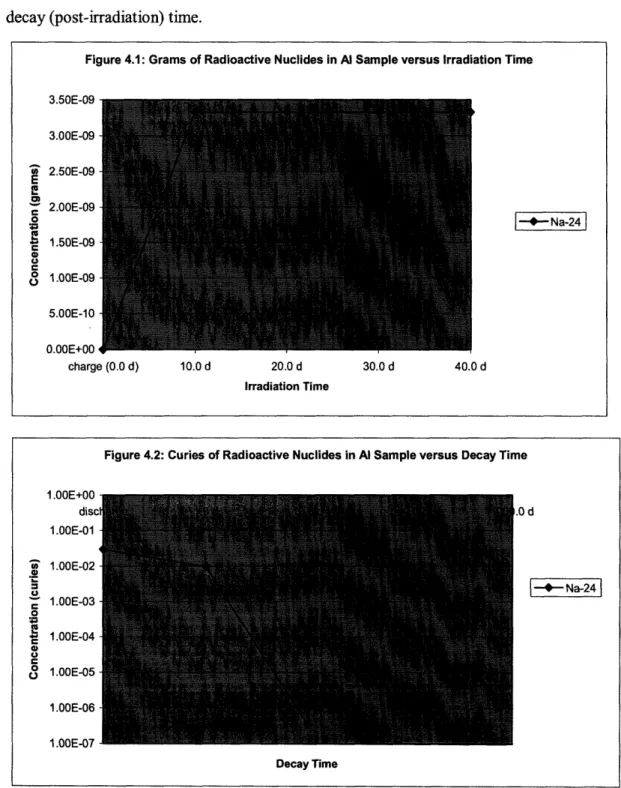
Na-24 is the only nuclide listed in Table 4.2 because it is the only radioactive
nuclide with a concentration of greater than le-6 curies at the end of the Al sample
irradiation. Figure 4.1 shows a plot of the Na-24 concentration in grams versus
irradiation time, and Figure 4.2 shows a plot of the Na-24 concentration in curies versus
decay (post-irradiation) time.
Figure 4.1: Grams of Radioactive Nuclides in Al Sample versus Irradiation Time 3.50E-09 3.00E-09 S2.50E-09 E 2.00E-09 . S1.50E-09 L 1.00E-09 5.00E-10 0.OOE+00 charge (0.0 d) 10.0 d 20.0 d 30.0 d 40.0 d Irradiation Time -+- Na-24 Decay Time
The Na-24 activation product is created by a (n,alpha) reaction with Al-27. This
Figure 4.2: Curies of Radioactive Nuclides in Al Sample versus Decay Time
1.00E+00C dis 1.00E-01 S1.00E-02 1.00E-03 0 • 1.00E-04 • 1.00E-05 1.00E-06 1.00E-07 0 d -*- Na-24
reaction has a cross section of 122.2 millibarns (687.7 microbarns). While Na-24 will
contribute to near-term dose from irradiated Al, it is not a concern for long-term disposal
because of its short half-life of 14.95 hours. [22]
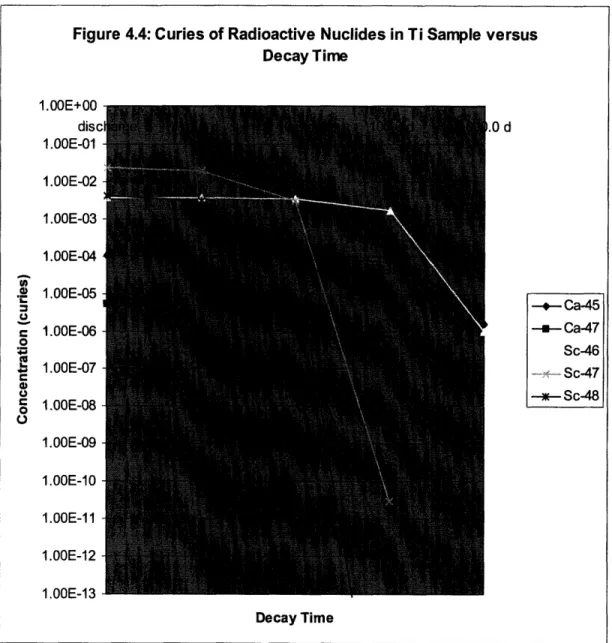
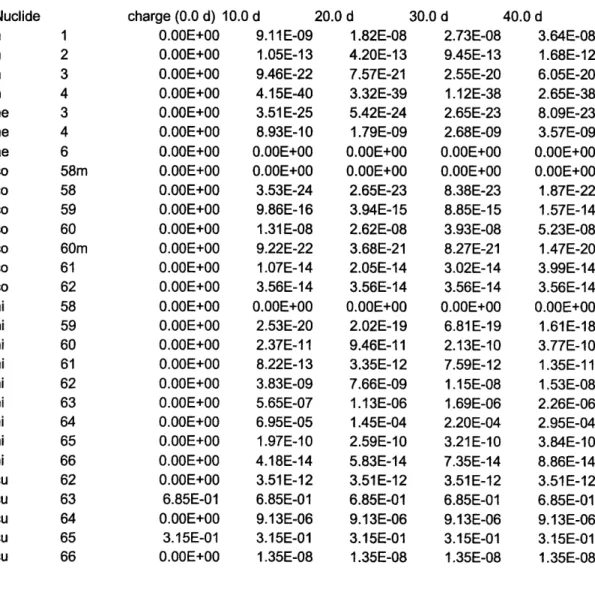
4.3 Analysis of Titanium (Ti) Irradiation
The grams of each nuclide in the Ti sample versus irradiation time are listed in
Table 4.3, and the curies of each radioactive nuclide in the Ti sample versus decay time
are listed in Table 4.4.
Table 4.3: Grams ofEach Nuclide in the Ti Sample versus Irradiation Time
charge (0.0 d) 10.0 d 0.OOE+00 2 0.OOE+00 2 0.OOE+00 2 0.OOE+00 1 0.OOE+00 8 0.OOE+00 8 0.OOE+00 0. 0.00E+00 2 0.OOE+00 9 0.OOE+00 5 0.OOE+00 2 0.OOE+00 4 0.OOE+00 1 0.OOE+00 2 0.OOE+00 6 0.OOE+00 2 0.OOE+00 9 0.OOE+00 3 0.OOE+00 3 0.OOE+00 3 0.00E+00 2 0.OOE+00 2 0.OOE+00 2 0.OOE+00 9 7.92E-02 7 7.31 E-02 7 7.38E-01 7 5.52E-02 5 5.43E-02 5 0.OOE+00 2 0.OOE+00 2 0.OOE+00 1 0.OOE+00 3 0.OOE+00 2 20.0 d .22E-09 .55E-14 :.30E-22 .01E-40 .54E-26 .15E-10 OOE+00 .41 E-34 1.16E-26 *.17E-17 .52E-09 .60E-09 .58E-09 .02E-10 .99E-12 .69E-16 .14E-24 .37E-11 .09E-08 .70E-19 .53E-08 .84E-09 .22E-12 .07E-15 .92E-02 .31 E-02 .38E-01 .54E-02 .43E-02 .OOE-10 .44E-24 .12E-15 .47E-07 .30E-14 4.43E-09 1.02E-13 1.84E-21 8.07E-40 1.32E-24 1.63E-09 0.OOE+00 3.86E-33 7.36E-25 2.08E-1 6 5.03E-09 9.20E-09 3.10E-09 4.06E-10 8.51E-12 7.51 E-1 6 2.55E-23 1.33E-10 5.93E-08 1.46E-18 2.85E-08 2.90E-09 2.23E-12 9.07E-15 7.92E-02 7.31 E-02 7.38E-01 5.56E-02 5.43E-02 2.00E-10 1.94E-23 4.50E-15 6.94E-07 4.61 E-14 30.0 d 6.65E-09 2.30E-13 6.21 E-21 2.72E-39 6.44E-24 2.44E-09 0.OOE+00 1.96E-32 2.49E-24 4.70E-16 7.54E-09 1.38E-08 4.55E-09 6.11E-10 8.84E-12 1.28E-15 4.33E-23 2.95E-10 8.54E-08 3.24E-18 2.89E-08 2.90E-09 2.24E-12 9.07E-15 7.92E-02 7.31 E-02 7.38E-01 5.58E-02 5.43E-02 2.01 E-1 0 6.51 E-23 1.01E-14 1.04E-06 6.91E-14 40.0 d 8.86E-09 4.09E-13 1.47E-20 6.45E-39 1.97E-23 3.26E-09 0.OOE+00 6.22E-32 5.93E-24 8.39E-16 1.01E-08 1.84E-08 5.95E-09 8.18E-10 8.92E-12 1.81E-15 6.15E-23 5.17E-10 1.10E-07 5.67E-18 2.90E-08 2.90E-09 2.24E-12 9.07E-15 7.92E-02 7.31 E-02 7.38E-01 5.60E-02 5.43E-02 2.01E-10 1.53E-22 1.80E-14 1.39E-06 9.22E-14 Nuclide 1 2 3 4 3 4 6 40 41 42 43 44 45 46 47 48 49 45 46 46m 47 48 49 50 46 47 48 49 50 51 49 50 51 52
0.OOE+00 O.OOE+00 O.OE+00 O.OOE+00 O.OOE+00 O.OOE+00 O.OOE+00 0.OOE+00 9.96E-28 1.98E-33 3.85E-29
2.08E-20
3.07E-11 2.79E-1 6 4.48E-20 2.07E-28 7.97E-27 3.17E-32 5.88E-28 1.57E-19 1.23E-102.23E-15
7.17E-19 3.31E-272.69E-26
1.61E-312.84E-27
5.01 E-1 9 2.76E-107.52E-15
3.63E-18
1.67E-266.38E-26
5.07E-318.59E-27
1.12E-18 4.91 E-10 1.78E-14 1.15E-17 5.29E-26Totals I.00E+00 1.00E+00 1.00E+00 1.00E+00 1.00E+00
Table 4.4: Curies of Each Radioactive Nuclide in the Ti Sample versus Decay Time
charge discharge 1.0 0.00E+00 1.05E-04 0.OOE+00 5.47E-06 0.00E+00 3.71E-03 0.OOE+00 2.41 E-02 0.OOE+00 4.33E-03 0.00E+00 1.61 E-01 d 1.05E-04 4.69E-06 3.68E-03 1.96E-02 2.96E-03 2.63E-02 10.0 d 1.01E-04 1.19E-06 3.42E-03 3.03E-03 9.62E-05 6.65E-03 100.0 d 6.90E-05 1.26E-12 1.62E-03 2.89E-11 1.27E-19 1.69E-03 1000.0 d 1.53E-06 0.OOE+00 9.49E-07 0.OOE+00 0.OOE+00 2.48E-06
The nuclides listed in Table 4.4 are those radioactive nuclides that have a
concentration of grater than le-6 curies at the end of the Ti sample irradiation. Figure 4.3
shows a plot of the concentration in grams of the nuclides in Table 4.4 versus irradiation
time, and Figure 4.4 shows a plot of concentration of those same nuclides in curies versus
decay (post-irradiation) time.
Nuclide ca ca sc sc sc Totals